SJR is a measure of journal scientific impact that takes into account both the number of citations a journal receives and the importance or reputation of the journals from which those citations come. It measures the scientific impact of the average journal article. expresses how central to the global This indicator counts the number of citations received by papers from a journal and divides them by the total number of papers published in that journal. The graph shows the evolution of the average number of citations in the current year of documents published in the journal in the last two, three and four years.
Evolution of the total number of journal citations and self-citations received by published journal papers over the past three years. Journal self-citation is defined as the number of citations from the journal citing the article to articles published by the same journal. External citations per document Citations per document The evolution of the number of total citations per document and external citations per document (ie journal self-citations removed) received by published journal documents over the past three years.
External citations are calculated by subtracting the number of self-citations from the total number of citations received by the journal's documents.
INVESTIGATION ON THE MINERALOGICAL PHASE OF ANCIENT BRICK SAMPLES OF KATHMANDU VALLEY
NEPAL) USING XRD AND FTIR ANALYSIS
In this context, the main objectives of the present research work were to characterize the mineralogical phases developed in the ancient brick samples collected from historical sites in the Kathmandu Valley using X-ray diffraction (XRD) and Fourier transform infrared (FTIR) spectroscopic methods and also to understand the knowledge and skills used to produce these rock samples. A total of eight claystone samples were collected, including five archaeological brick samples from different historical sites and three century-old brick samples used in ancient buildings in the Kathmandu Valley to perform their mineralogical phase characterization in the present study. XRD patterns of the powder form of five different archaeological brick samples from different historical sites and three ancient (more than a century old) brick samples from local buildings collected from different parts of the Kathmandu Valley are shown in Figure 1 and 2, respectively.
The common mineralogical phases present in all eight brick samples are quartz, feldspar, spinel, and hematite in CTB-1, RTB-4, BTB-5 brick samples, including the muscovite-type mica mineral phase in samples of BDB-3, TOB -6, POB-7 and KOB-8 (Fig.-1 and 2) and the mineralogical phase of margarite, especially in the stone samples of DTB-2 and BDB-3 (Fig.-1) using the corresponding JCPDS- database files24 . The disappearance of feldspar diffraction peaks and the appearance of the alumina-rich spinel phase is relatively more pronounced in four archaeological brick samples from CTB-1, DTB-2, BDB-3 and BTB-5 (Fig. 1) than in other three ancient rock samples. rock samples from TOB-6, POB-7 and KOB-8 (Fig.-2), including one archaeological rock sample from RTB-4 (Fig.-1). These results indicated that the firing temperature of these eight rock samples should not be the same.
Fig.-1: XRD patterns of the archaeological rock samples from different historical sites in the Kathmandu Valley. An alumina rich spinel and primary mullite phase were developed above 900°C and around 1000°C. Fig.-2: XRD patterns of century-old brick samples collected from different parts of the Kathmandu Valley. Figure-3 shows the recorded FTIR spectra of the six selected brick samples for their mineralogical phase characterization. Fig.-3: FTIR spectra of four archaeological (a-d) and two ancient (e and f) rock samples from the Kathmandu Valley The FTIR spectra of all these six archaeological and ancient brick samples show that the absorbance peaks at and 420 -450 cm–1 consist mainly of quartz.
Similarly, there is a weak and very broad absorption peak in the range of 550–545 cm-1 in all the brick samples analyzed here, which indicated that the fired bricks available in Kathmandu valley contain trace amounts of hematite. The mineralogical phases of five archaeological bricks from five different historical sites and more than century-old three ancient brick samples from Kathmandu Valley were characterized using their XRD patterns and FTIR spectra analysis in this study. The disappearance of diffraction peaks of feldspars and the appearance of the alumina-rich spinel phase in all eight brick samples indicated that the firing temperature of these bricks should be around C.
COMPARISON OF ECOTOXICITY OF NICKEL AND IRON OXIDES AND THEIR NANOFORMS
However, the general agreement is that it is necessary to investigate the ecotoxicity of nanomaterials due to increased risk of environmental pollution with technogenic nanoparticles due to the development of nanotechnologies and increased production of nanomaterials. With a view to verifying the existing hypothesis that toxicity of metal nanoparticles actually does not depend on their chemical essence, but only on the nanoparticle size, it was interesting to compare the toxic impact of Ni and Fe, since Ni is characterized by high toxicity in relation to to biota30, 31, and the Fe content in soil is higher and its toxicity is insignificant. In most cases, the direct interrelationship between pollutant concentration and the degree of deterioration of the considered soil properties was observed.
Thus, when iron and nickel oxides were introduced to the soil at a concentration of 100 mg/kg, the total number of bacteria fell to 92% and 80% of the control, respectively. Bacteria of the genus Azotobacter were more significantly affected by high concentrations (10,000 mg/kg) of nanoparticles of iron (66% of control) and nickel oxides (75% of control) than common iron (81% of control) and nickel oxides (78% of the control). Ni and Fe oxides and their nanoforms exerted greater influence on the fermentative activity of common chernozem compared to their nanoparticles.
For example, with the addition of 10,000 mg/kg of iron and nickel oxides, catalase activity decreases to 62% and 57% of the control, respectively, while iron nanoparticles decrease this indicator to 86% of the control and nickel nanoparticles - to 72% of control. Ni and Fe oxides and their nanoforms affected radish germination in different ways depending on the concentration of the substance. Iron oxide and its nanoform at a concentration of 100 mg/kg reduced this indicator similarly: up to 83% and 87% of the control, respectively.
Table 1: Comparison of the ecotoxicity of oxides of nickel and iron and their nanoforms with respect to microorganisms, radish and Chernozem fermentative activity. Phytotoxicity performance (radish root germination and length) was almost equally influenced by Ni and Fe oxides and their nanoforms. It has not been established that nanoparticles of Ni and Fe oxides (10-20 nm) are characterized by higher ecotoxicity than particles of Ni and Fe oxides of conventional sizes (100 nm and larger).
MODELING AND OPTIMIZATION OF THE ORANGE LEAVES OIL EXTRACTION PROCESS BY MICROWAVE-ASSISTED
BASED ON THE CENTRAL COMPOSITE APPROACH (RSM-CCD MODEL)
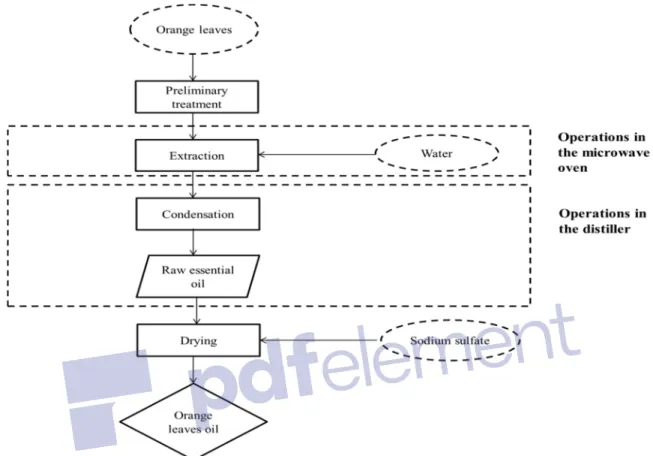
Other uses of the orange essential oil could include a solvent for the extraction of fats and oils from an olive. Due to electromagnetic waves with frequencies from 300MHz to 300GHz, polar molecules in the biomaterial are rapidly rotated, which in turn generates heat in the interior of the material. The purpose of this study is to maximize the amount of extracted essential oil orange leaves.
ANOVA analysis was adopted to assess the effect of process variables on both responses. In order to verify the adequacy of the developed model, we checked the optimal conditions with an actual experimental experiment. Figure-2: Experimental procedure including preparation of orange leaves, microwave assisted hydrodistillation unit and analysis of obtained oil samples.
Gas chromatography-mass spectrometry (GC-MS) was used to analyze the composition of essential oils of all extraction methods. The experimental and predicted results of Table 2 indicate the influence of three process factors on yield. It is found that the data points were almost on a straight line, indicating no serious deviation and reasonable model fit.
Figure 4 shows that all three experimental parameters exerted a significant influence on the yield of oil extraction from orange leaves. Figure 4 shows that the general trends of the three factors are comparable. This result reaffirmed the validity of the model and suggested that the model accurately predicted yield values.
It is worth nothing that the chemical composition of the essential oil may vary depending on geographical location and season of harvest, plant age and method of extraction 48. Fig.-4: 3D Response Surface Plots of the Interaction of Y with (A) Ratio Water and Raw Materials and Extraction Time, (B) Ratio Water and Raw Materials and Microwave Power, (C) Microwave Power and Extraction Time.
SPATIAL AND TEMPORAL VARIATIONS IN SURFACE WATER QUALITY OF THE DAM RESERVOIR IN THE
QUALITY OF THE DAM RESERVOIR IN THE GUENITRA BASIN F. Guenitra) reached the threshold of 75%, is a water volume of 94 million cubic meters with a capacity of 125 million cubic meters. The total volume of the average contribution of all rivers to the dam is estimated at 55 hm3 per year. The Guenitra dam is built on the bottom of the Fessariver, in a point with a size of 110 m and with a catchment area of about 202 km2. In the laboratory, after filtration of the sample through Whatman GF/C glass filters (porosity 0.5 mm) and stored at 4°C until analysis, which was performed within one week.
The physico-chemical characteristics give a good picture of the water quality in each water body. The parameter was within the permissible limit, so the water quality can be considered safe for domestic and agricultural purposes. Conductivity is the measure of the ability of a substance or solution to conduct electrical current through water11.
The level of TDS depends on several factors such as the geological nature of the watershed, rainfall and the amount of surface runoff. Chloride is considered to be a conservative chemical species in water and is therefore considered to be a good indicator of the amount of wastewater discharged at a given time18. Total hardness is a measure of water's capacity for the concentration of calcium and magnesium in water and is usually expressed as mg/l CaCO3 concentration19.
Fig.-2: Temporal and spatial changes of water quality in Guenitra dam from February to May 2017 (P= Intake point). It is available in the form of phosphate (PO4-3) in natural waters and is generally found in low to moderate concentrations. The results of the physico-chemical analyzes of the waters show that the general quality of these waters is generally good.
