This chapter focuses on the first part of the proposed model, which deals with modeling an air force logistics problem. Vasileios Zeimpekis Design, Operations and Production Systems Lab, Department of Financial & Management Engineering, University of the Aegean, Chios, Greece.
UAV Mission Planning: From Robust to Agile
- Introduction .1 Background
- Chapter Purpose and Outline
- Deterministic Models for UAV Mission Planning
- Uncertainty in Fuel Consumption of the UAV
- Robust UAV Mission Planning
- Two-Stage UAV Mission Planning
- Comparing Planning Approaches
- Uncertainty, Time Windows and New Targets
- Weighted Location Coverage
- Online Planning Approach
- Re-planning Illustration
- Conclusions
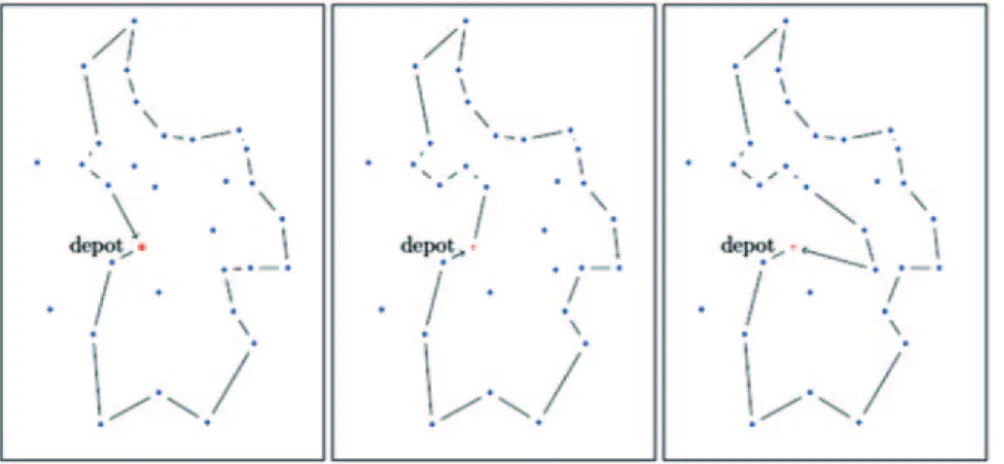
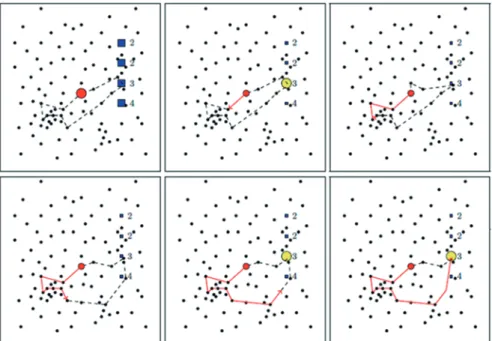
In the TSOP on the other hand, all targets that will be scored in any scenario are already part of the planned TSOP tour. In this illustrative scenario, two time-sensitive targets appear during the flight of the UAV (represented by the yellow circles).
Mufalli, F., Batta, R., Nagi, R.: Simultaneous sensor selection and routing of unmanned aerial vehicles for complex mission plans. Royset, JO, Reber, DN: Optimized routing of unmanned aerial systems for improvised explosive device prohibition.
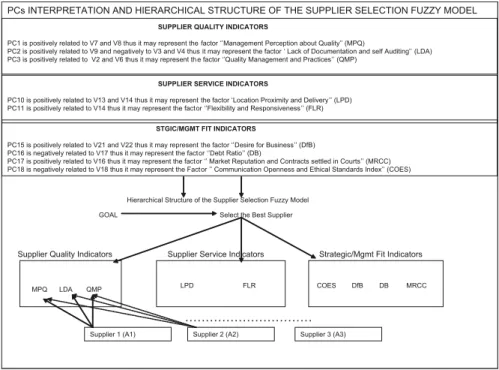
Supplier Selection Procedure of Military
Critical Items: Mutivariate, Fuzzy, Analytical Hierarchy Procedures
Introduction
Thus, the theory of fuzzy logic, proposed by Zadeh (1965), is further used to deal with the vagueness/subjectivity of human thoughts and expressions and therefore, it strengthens the inclusiveness and rationality of the decision-making process (Shen et al 2013). For the outcome of this paper, real data were collected through confidential questionnaires of members of the Hellenic Armed Forces.
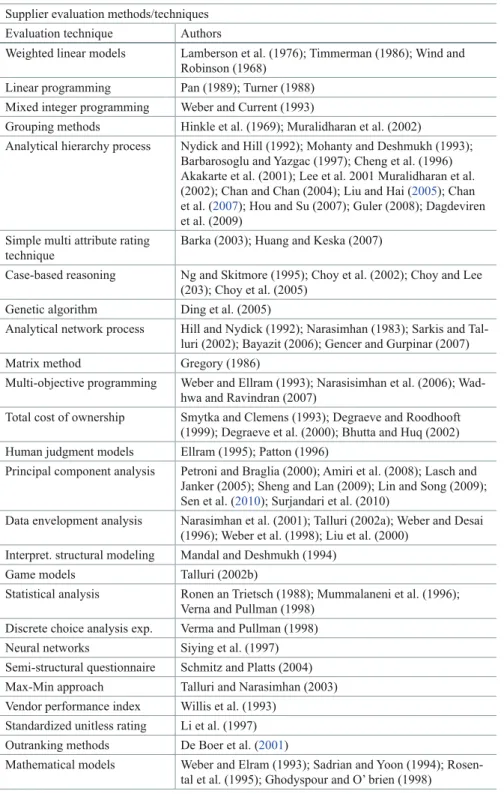
Literature Review
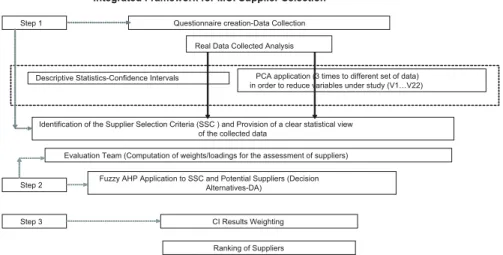
- An Integrated Approach for MCI Supplier Selection
- Competitive Intelligence
- Principal Components Analysis
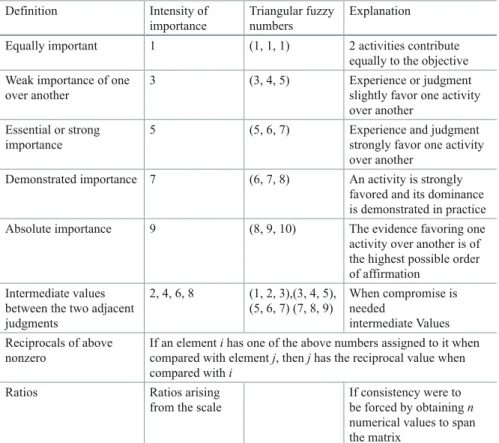
- Fuzzy Sets Theory and Fuzzy AHP
Furthermore, this paper suggests the use of a CI process as a tool that can increase the transparency of the supplier selection procedure. 1 and u are the lower and upper support values of M respectively and m the modal value.
The value of Fuzzy Synthetic Extent ( Si) with respect of the ith object equals to
- Proposed Model of the Integrated Approach with Real Data Evaluation
- First Step of the Integrated Approach
- Second Step of the Integrated Approach
- Third Step of the Integrated Approach
- Conclusions and Future Research Implications
- Acknowledgements
It can be seen as part of contemporary business management (Ding 2009) which improves the objectivity of decision-making process by reducing the risks in that process (West 2001). This paper combines real data with conceptual framework (Integrated Approach) and focuses on the final selection phase of the supplier selection process.
The Proposal of Demand Estimation of Repairable Items for the Weapon Systems
- Problem Statement
- Literature Review
- Scope and Limitations
- The Importance of Repairable Items
- The Aim and Contribution of the Study
- Algorithms Used in Turkey and USAF .1 RDS Algorithm
- TOIMDR Algorithm
- Developed SORTIE 9 Algorithm
- Generating Scenarios from Algorithms
- Data Set and Methodology
- Application
- Approach-I: (Classic Approach)
- Approach-II: (New Approach-I/NSG Based Approach)
- Approach-III: (Extension of Approach-II, NSG Based Approach)
- Approach-IV: (New Approach-II/Item Based Approach)
- Evaluation
- Results and Recommendations
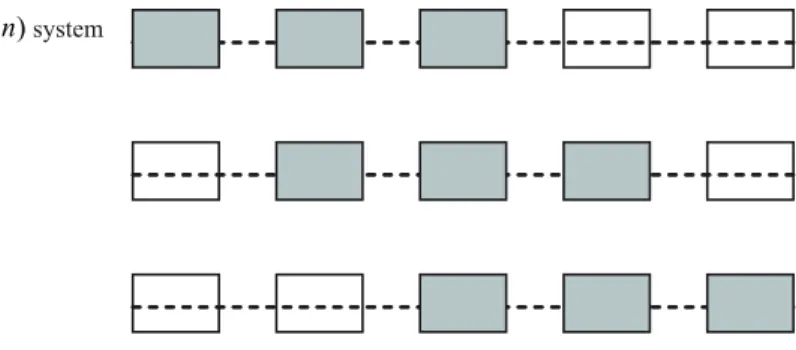
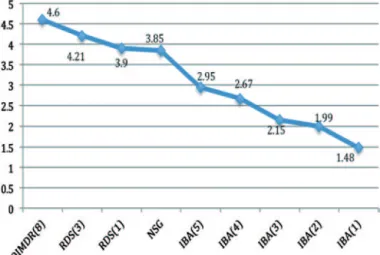
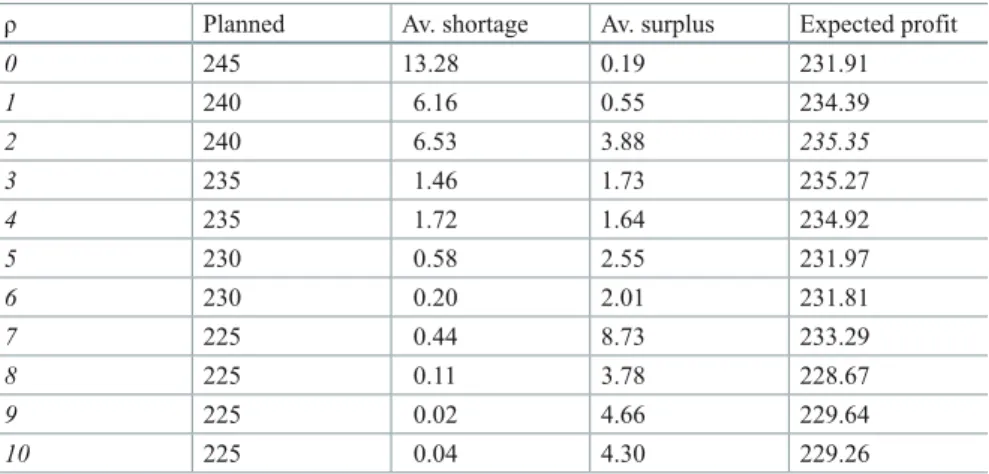
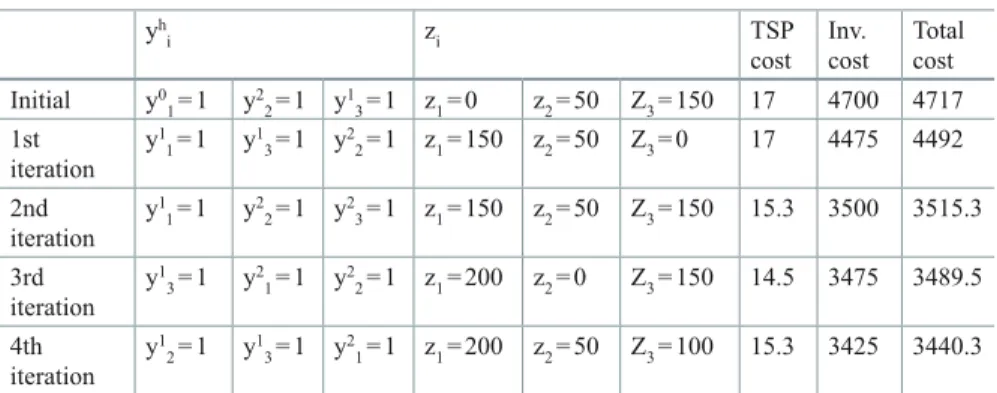
01 March 2012 Determine OIM ANN DEM6: It corresponds to the expected number of errors under PFP.7,8. Determine OIM ANN DEM: It corresponds to the expected number of failures during the PFP. Based on the test result shown in table 3.6 below, it is concluded that there is a significant. The scenario RDS (1) is recommended for the NSGs that did not result in significant difference at the α = 5 % at the end of Friedman and Wilcoxon Sign Test b 8 repairable items belonging to the five different NSGs included in this table due to the insufficient number of observations. The results of Wilcoxon signed test for the recommended scenarios in appendix III for 1-year forecast period. The results of Wilcoxon signed test for the recommended scenarios in appendix-III for 2-year forecast period. The results of the Wilcoxon Sign Test for the recommended scenarios in Appendix-III for 3-year forecast period. Gümüş, A.T., Güneri, A.F.: Multi-echelon inventory management in supply chains with uncertain demand and lead times: Literature review from an operational research perspective. Turkish Air Force Requirement Distribution System (RDS): User's Manual, Turkish Air Force Command Press, Ankara (1997). The amount of storage at depot i is determined by the manager based on the inventory-cost function of the news vendor, as shown in Table 4.2. The cost per unit of storage and repair will – together with the cost of transport – decide the relative advantage of resupplying from the repair shop versus stored inventory. This amount is the sum of repaired and inventoried items delivered from warehouse 0 to warehouse 1 by any vehicle. Here, the travel cost matrix is symmetric: dij = dji—that is, the time spent from node i to node j is the same as the time spent from node j to node i. This suggests that in our example network with four depots, we are focusing on depot 1, with the other depots being home depot 0, depot 2, and depot 3. The local resources available at depot 1 are seven units as shown in Eq. . Khouja, M.: The single-period (news-vendor) problem: Literature review and suggestions for future research. The TSP subproblem to be solved consists of all model constraints except the nonlinear constraints (8) and capacity constraints (10) in the chapter of Part I. Instead of a traditional newsvendor problem, the Delivery-Allocation subproblem can be solved as the following mathematical program: minz Σ Σi I∈ j I i∈ q z( ) subject to constraints (8) and (10) in chapter Part I. The traditional solution ij of the newsvendor problem via Eq. 2) the chapter of Part I presents a "chicken-and-egg" dilemma where ξ and the dual variables Ω and ρ are interdependent, reflecting the competition between the three places of demand for supplies. The solution of this mathematical program gives both z and the dual variables Ω for constraints (8) and (10) in the chapter of Part I, and ρh for the vehicle capacity constraints. When the main problem gives the same solution as in the previous cycle, we have found the optimum. As mentioned, if the main problem yields the same solution as in the previous cycle, we have found the optimum. If we just want to meet the demands in the fastest way, this first solution will apply. Allowing for repairs and lateral resupply, we broke through solution 3 to arrive at the lowest-cost solution 4. Although the result is somewhat intuitive, we will verify the result quantitatively here in Proposition 2. The RLS model will guarantee that it results in a total operating cost no higher than the FZC model. Meanwhile, it is clear that the increase in Benders' cuts is only in the order of │I│ − 1, according to Eq. These linear sections (3) are based on solving the TSP and Delivery-Assignment subproblems, the latter of which is a small mathematical program with the number of variables in the order of │I│2. If we fix the y-vector, Eq. 8) in the Part I chapter is linearized; the problem becomes a MIP instead of a nonlinear program. Here f (y) is a function of the binary variables y, and λ is the solution to the double relaxation of the MIP, and B is a matrix corresponding to the coefficients of the y variables in the original problem. We can add this reduction to the constraints and constraints on vehicle performance, substituting the values of zij in our solution to the newsvendor problem. The solution will provide a new upper bound of the original problem, and each relaxation solution of the master problem will provide a lower bound. We can also include exponentially distributed demands in inventory problems and Poisson distributed demands in repair problems (Gallego and Moon 1993) – in addition to the uniformly distributed ones shown in our example. Hooker (2007) found that logic-based Benders decomposition can be significantly improved on state-of-the-art technology for solving planning and scheduling problems. It is clear that the variable z in the upper bound of the integral in Eq. 2) in the Part I chapter would now be a random variable (instead of a deterministic variable), since it includes the repaired items as shown in the equation zij = Σh [xijh( u) + xijh( d)]. The views expressed here do not represent those of the organizations with which the authors are/have been affiliated. The transportation of relief material is one of the most significant processes as it must be done immediately after the occurrence of a disaster. The first part of the journey between the origin and the intermodal center of the locker is carried out by road transport. The main purpose of this test was to assess whether the online tool could improve the performance of freight transport in terms of administrative cost and time (ie the process of identifying/quoting/booking a journey). To achieve this, 15 tests were carried out in different cases with and without the use of the tool. The results obtained from the initial testing of the tool are very encouraging and show significant reductions in operating costs and time compared to current design operations. Future steps include further testing of the web tool in different scenarios and the possible inclusion of additional parameters for more cost-effective solutions. Divide resources according to the ratio of the cells of the weighted Voronoi chart created in step 5. Additively weighted Voronoi charts can be modified by using a mathematical operator on all weights (see Formula 3). If a negative constant is used, the resulting diagram is the inverse of a regular multiplicative weighted Voronoi diagram. An exponentially weighted Voronoi chart also changes based on the scale of the chart, so it's important to make sure that the weight units are consistent with the distance units. Like a multiplicative weighted Voronoi chart, mixing positive and negative weights should not be mixed. One case where an exponentially weighted Voronoi might prove useful is the distribution of ammunition to military bases with the number of insurgents as the weight. A variation of the Threshold Accepting (TA) method (Dueck and Scheuer 1990) with adaptive threshold list (Nikolakopoulos and Sarimveis 2007) and progressively enhanced Local search (Sarimveis and Nikolakopoulos 2005) is used to improve the solutions. The primary goal was to minimize the number of vehicles, while the secondary goal was to minimize travel times. Remove all customers from the first (in the solution view) kr routes from Routesc, where kr is any integer ∈ [1, Kc]. Specifically, using only one of the moves (i)–(ii), the algorithm is often trapped in suboptimal solutions, while using only one of the heuristics (iii)–(vi), the algorithm cannot successfully address the primary objective. In this sense, the results of the proposed method are not directly comparable to the results of (Gélinas et al. 1995). The primary goal was to minimize the number of vehicles and the second was to minimize the total trip. Further interesting generalizations of the classical consecutive-k-out-of-n:F structure include the r-within-consecutive k-out-of-n:F system (Griffith (1986); Triantafyllou and Koutras (2011)) . In addition, some recurrence relations for the coordinates of the signature vector for a linear consecutive-k-out-of-n:F and an r-within-consecutive k-out-of-n:F system are also established for specific design parameters. The next proposition offers a recursive scheme for the coordinates of the signature vector of a ( , , )n f 2 system. Theorem 9.3 The coordinates v k ni( , ) of the signature vector of a two-within-consecutive k-out-n:F system consisting of n independent and identically distributed components satisfy the following recurrence relation. The ith coordinate of the signature vector of a coherent system can be expressed as (Boland and Samaniego (2004)). Assuming that the mission includes n=8 fighters, the signatures of the corresponding confidence structure are shown in Table 9.1.
Appendix
A Combined Inventory and Lateral Re-Supply Model for Repairable Items—Part I: Modeling
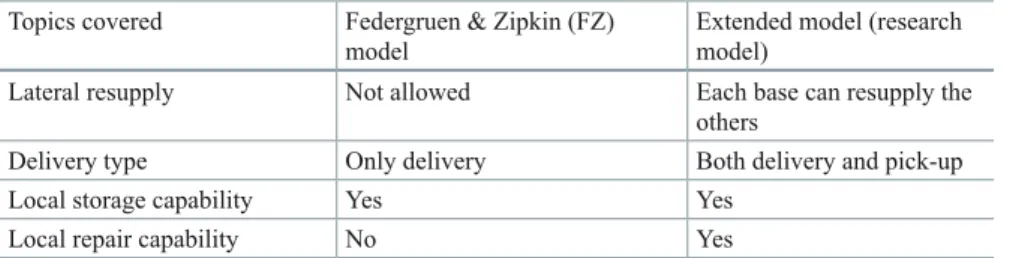
A Combined Inventory and Lateral Resupply Model for Repairable Items—Part II: Solution
Background
Analysis
Summary, Conclusions and Recommendations
A Transportation Planning Tool for Supporting Military Actions in Natural Disaster Relief
Using Plane Tessellation Algorithms to Optimize Resource Allocation
![Fig. 7.1 A Voronoi Diagram with each cell being a different color. [Unless otherwise noted, the sites used in the Voronoi diagrams below are: (34, 15, 2), (73, 26, 1), (93, 26, 3), (3, 28, 4), (84, 30, 4)]](https://thumb-ap.123doks.com/thumbv2/123dok/10258780.0/132.659.131.528.88.400/voronoi-diagram-different-color-unless-noted-voronoi-diagrams.webp)
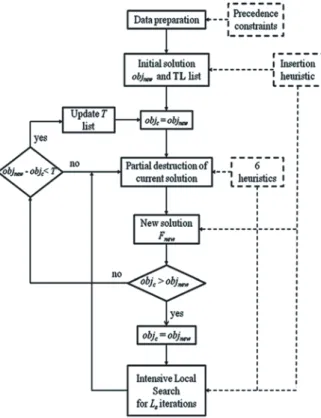
A Metaheuristic Reconstruction Algorithm for Solving Bi-level Vehicle Routing Problems
Reliability Study of Military Operations