Understanding Management and General Expenses in Nonprofits
Thomas H. Pollak The Urban Institute
Patrick Rooney Indiana University
Mark A. Hager The Urban Institute
Overhead Cost Study Working Paper
Presented at the 2001 Annual Meeting of the
Association for Research on Nonprofit Organizations and Voluntary Action New Orleans, LA
Understanding Management and General Expenses in Nonprofits Abstract
There has been growing coverage by the press and the accounting profession about how nonprofits report their management and general costs. There has also been growing attention by some donors, perhaps made most famously by claims by some donors that nothing should go to administration. While this area of nonprofit management has caught the attention of the public, it has largely escaped the research lens of scholars. This paper is a first step to understanding and explaining what management and general costs look like in the nonprofit sector and whether or not various institutional characteristics such as mission, size, age, sources of revenues, and/or accounting practices can help explain some of the variation in management and general
expenses. We find that these institutional characteristics do matter quite a bit in explaining differences in management and general costs in nonprofits.
Understanding Management and General Expenses in Nonprofits
Nonprofit organizations feed the hungry, clothe the naked, and provide for a great variety of other needs in the United States. They also are an important means by which we educate, and a primary means by which we come into contact with arts and culture. The public face of nonprofit organizations is the programs they provide. That is, the Red Cross is known for its relief efforts and ongoing blood drives, and the Cincinnati Symphony Orchestra is known for the music it makes. However, both organizations, like all nonprofits, must spend money on their daily operations in addition to the money they spend to sustain their programs.
Indeed, financial accounting standards in the United States distinguish between three different types of expenses, and ask nonprofit organizations to account for them. Program- related expenses are the most obvious kinds of expenses since they correspond to the public face of the organization. Fundraising expenses support efforts to raise money for the nonprofit, and include such things as postage costs, professional fundraiser fees, and the salaries and wages of staff members engaged in fundraising activities. Management and general expenses are those costs associated with the overall function and management of the nonprofit organization, and include many personnel costs, accounting and legal fees, and outlays for equipment and supplies.
From the perspective of nonprofit executives, management and general expenses are real costs, necessary to the lifeblood of their organizations. Nonetheless, institutional funders, individual donors, and the media often act as if they believe these expenses are unworthy of public support.
Nonprofits researchers have almost entirely ignored them. The purpose of this paper is to provide an overview of management and general expenses, which we refer to as "M&G," and how these costs vary among nonprofits.
The paper proceeds in six sections. First, we provide an overview of on-going efforts to standardize financial accounting practices in the nonprofit sector and how that impacts M&G; we also comment briefly on scholarly efforts to study the importance of the distinction between program-related and other types of organizational expenses. Second, we introduce our data source: data from Forms 990 filed by nonprofit organizations annually with the Internal Revenue Service. Third, we report on the incidence and level of M&G by size of organization and the subsector in which it operates. Fourth, we report on the distribution of specific M&G expense items, and we probe reporting practices by noting the degree to which nonprofit organizations distribute costs to functional categories of M&G and program expenses. Fifth, we investigate the extent to which organizational characteristics and accounting practices explain an organization's level of M&G expenses. Finally, we draw conclusions about management and general costs, limitations of nonprofit accounting practices and their reflection in Form 990, and possible areas for future research.
1. Accounting for M&G
Articulating Financial Accounting Rules
The IRS Form 990 follows Generally Accepted Accounting Principles (GAAP) in differentiating between three major types of expenses: program-related, fundraising, and management and general expenses. The Form 990 instructions state that M&G includes
“expenses for overall function and management, rather than for its direct conduct of fundraising activities or program services… . Overall management usually includes the salaries of the chief officer and that officer’s staff… [when not] directly supervising program services and fundraising activities.” M&G also includes costs such as accounting, general legal services, general liability
insurance, office management, investment expenses, board meetings and general staff meetings, annual reports, as well as auditing, personnel, and other centralized services.
With a few exceptions, the data that organizations report on Form 990 should be consistent with what they report on their books (see General Instruction G and instructions for Part II.) Thus, one must look beyond the IRS Form 990 Instructions for an understanding of how these expenses are likely to be reported. There are four primary sources for these rules:
Generally Accepted Accounting Principles (GAAP) are embodied, first and foremost, in the statements of the Financial Accounting Standards Board (FASB). FASB’s Statement of Financial Accounting Standards 117, issued in 1993, provides the most important articulation on the reporting of functional expenses. It requires that expenses be reported “by their functional classification such as major classes of program services and supporting activities.” (SFAS 117, para. 26).
Various publications of the American Institute for Certified Public Accountants
(AICPA) provide secondary sources for GAAP. The AICPA’s Audit and Accounting Guide for Not-For-Profit Organizations provides a thorough summary of GAAP for the auditors of
nonprofit organizations. The AICPA’s Statement of Position 98-2 directs organizations to use a three-part test for allocating “joint costs” usually associated with mailings to donors or members that combine both fundraising and educational/programmatic content.
The four editions of Standards of Accounting and Financial Reporting for Voluntary Health and Welfare Organizations, better known as “The Black Book,” have played a major role since 1964 in providing a framework for human service organizations’ financial reporting.
Technically, the book does not establish GAAP. (p.3) The current edition, a joint product of two national umbrella associations, spends more than forty pages on the reporting of expenses.
For the subset of organizations that receive federal grants, either directly or passed through state and local governments, Circular A-122 (or Circular A-21 for colleges and universities) of the U.S. Office of Management and Budget governs their cost reporting. This lengthy document details the specific methods that are to be used for allocating each major expense category. These regulations may apply to as many as one-third of the 160,000 nonprofit organizations filing the Form 990 (not the 990-EZ, which can be used by organizations with under $100,000 in gross receipts). (Authors’ analysis of data from Form 990 filers compiled in the NCCS-GuideStar National Nonprofit Research Database.) However, the Form 990 does not permit us to distinguish between federal, state, or local government sources so the one-third estimate may substantially overstate the number of organizations to which these regulations apply.
Finally, the IRS Form 990 Instructions provide additional guidance, both on the
allocation of expenses between the three reported functions and for each line item (e.g., wages or occupancy costs).
The Quality of Reporting
Substantial guidance on the allocation of costs is available to both nonprofit organizations and their accountants. But do organizations comply with GAAP? There are several perspectives on this question. One perspective focuses on the salutary role of the independent audit by a Certified Public Accountant (CPA) in larger nonprofit organizations. No law requires nonprofit organizations as a class to have audits. However, a variety of circumstances may trigger an audit: funder requirements (e.g., federal awards of at least $350,000), state registration
requirements keyed to levels of private contribution income, creditor requirements (e.g., a bank making a substantial loan requires an audit as a condition of a loan). Furthermore, in the absence
of external requirements, a prudent volunteer board of a larger organization may contract for an audit to ensure that proper financial management and accounting procedures have been
implemented and that the organization’s finances are in order.
Independent auditors have passed through a rigorous series of tests and are obligated as CPAs to honestly report on what they find. The audit provides a means for the board, private and public funders, and state charity officials to verify that managers are reporting their organizations’ finances accurately. Anecdotal evidence suggests that a nonprofit organization with a budget of $1 million might typically pay a CPA firm $2,000 for its audit. A larger or more complex organization could pay substantially more. This in-depth review of the
organization’s books precedes the completion of the Form 990 and is often completed by the same firm. Thus, one would expect the Form 990 to reflect the auditor’s judgment on the reasonableness of the functional expense allocation.
However, a less sanguine perspective focuses on the structure of incentives of nonprofit organizations and their auditors. From this perspective, nonprofit organizations wish to
maximize the percentage of funds that they report as being used for program-related purposes.
In a competitive fundraising environment, some donors may be more likely to give to more
“efficient” organizations and the percentage of funds being used for program purposes is the prime indicator of efficiency. Organizations that rely on large government or private sector contracts for earned revenue – a child welfare agency seeking a government contract to provide foster care services or a hospital seeking a contract with an HMO, for example – have similar incentives to minimize reporting of non-program expenses. Auditors, hired by the organization, wish to retain the organization’s business. Thus, they, too, have an incentive to accept their client organizations’ “reasonable” allocations of expenses, even if they don not fully endorse a client's practices.
A third perspective focuses on the abundance of small and unsophisticated organizations in the nonprofit sector. These organizations, according to this view, are likely to display the opposite reporting problem: over-reporting of management and general expenses. They may pay little attention to the nuances of the accounting rules and blithely allocate all of the executive director’s salary, all occupancy, copying, and other indirect expenses to M&G.
Scholarly Attention to Cost Allocations
There is little empirical research on the application of existing guidelines. In a study limited to California welfare organizations, Benjamin (2000) found that approximately half of the nonprofits reported use of guidelines published by FASB, AICPA, and the OMB to help define and allocate M&G, fundraising, and program-related expenses. The percentage relying on IRS and United Way guidelines numbered 16% and 13%, respectively. Benjamin concludes that these resources are inadequate, and that nonprofits allocate costs in inconsistent and idiosyncratic ways.
Nonprofits researchers have argued that the way that nonprofit organizations allocate their costs influences the ways that they behave. All of the cases cited here combine fundraising and M&G expenses as "overhead costs" to investigate how the proportion of non-program expenses relates to other organizational characteristics. For example, Tuckman and Chang (1991) argue that high levels of fundraising and M&G expenses in relation to program expenses represent a buffer that can protect organizations that experience a shock to their finances. That is, rather than cutting back on programs (their public face) during hard times, organizations with comparatively high overhead expenses can cut back on those instead. Following this line of thought, Greenlee and Trussel (2000) found that high fundraising and M&G expenses are
associated with financial flexibility, and Hager (2001) found a correlation with organizational survival.
Several scholars have suggested that donors do not care or should not care about the cost of fundraising in nonprofits (e.g., Rose-Akerman, 1982; Steinberg, 1986). Okten and Weisbrod (2000) and surveys from the BBB-Wise Giving Alliance (2002; see their website) indicate that individual donors care about the proportion of their dollars that go to fundraising or M&G when they make giving decisions. To test this indication, Frumkin and Kim (2001) propose competing hypotheses, one that a low proportion of M&G (thereby indicating an “efficient nonprofit”) is related to the total value of donations received, another that the amount spent on fundraising ("marketing") is related to the value of donations received. They conclude that efficiency is not rewarded with significantly more donations, but money spent on marketing translates into greater contributions.
Other research focuses on institutional rather than individual sources of revenues. Stone, Hager and Griffin (2001) hypothesize that high proportional spending on overhead will be associated with high proportions of revenues from United Way and government since securing money from these sources entails meeting substantial administrative requirements and
developing sophisticated managerial accounting systems. Their research validates the claim for United Way recipients, but did not support the relationship between proportionately high overhead costs and increasing reliance on government funds.
Benjamin (2000) reports a negative relationship between the proportion of budget spent on M&G plus fundraising and the proportion of revenues from government sources. She also
reports a decreasing overhead costs ratio as the number of full-time employees increase, an effect she attributes to economies of scale and specialization of finance staff.
Hence, we have seen that despite great interest in overhead (M&G plus cost of
fundraising) by the press and by the watch groups, there has been relatively little work done on overhead and very little focused on M&G specifically. This paper hopes to fill some of this void.
2. Data and Method
Our analysis of M&G expenses among nonprofit organizations is based on data collected from more than 160,000 IRS Form 990 returns filed by 501(c)(3) public charities for fiscal year 1999, the most recently available data. Data from these returns were keypunched by GuideStar and incorporated in the GuideStar-NCCS National Nonprofit Research Database. We exclude several broad categories of nonprofit organizations, including private foundations (which file the Form 990-PF), 501(c)(4) and other non-charitable nonprofit organizations, and those public charities with less than $100,000 in gross receipts that chose to complete the Form 990-EZ.1
The records used in the analysis include operating and supporting organizations active in the arts, education, the environment, health care, human services, international affairs, as well as those offering other types of “public or societal benefit,” to use the term given to the group by the National Taxonomy of Exempt Entities (NTEE). All supporting organizations are included in the “Other public and societal benefit” category as well.
1We also exclude approximately 873 records classified by NCCS as “out-of-scope” or mutual benefit organizations. These unusual organizations include self-insurance trusts, foreign-based organizations, and several others.
3. Plausible M&G Expenses
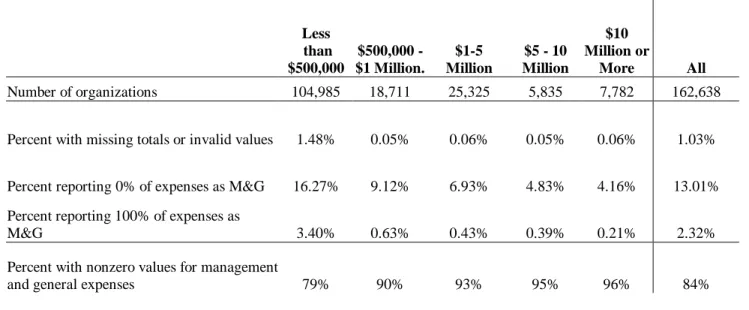
We begin the discussion of results by looking at which nonprofits report “plausible”
M&G expenses on Form 990. (Table 1) Approximately 1% of organizations reported negative values for total M&G or total expenses, or failed to provide total expenses. Thirteen percent reported no M&G expenses, and 2.3% reported ALL of their expenses as M&G.
Overall, only 84% of 990 filers reported plausible M&G expenses. This, however, masks substantial variation by size. With small organizations (operating expenses <$500,000)
representing two-thirds of all organizations, their characteristics usually approximate the characteristics of the population as a whole. Thus, only 79% of these organizations report plausible M&G expenses. But all of the remaining groups have substantially higher percentages of organizations reporting M&G ranging smoothly from 90% for the next larger group
($500,000-$1 mil.) to 96% for the largest size group (>$10 mil.).
Small organizations (<$500,000) had both the largest proportion of organizations
reporting no M&G as well as the largest reporting 100% M&G. At first glance, these two types of outliers appear to be at opposite ends of the reporting spectrum, with one group appearing to evade reporting requirements while the other appearing to be overly conservative in allocating M&G. In order to move beyond these speculations, we examined more than 40 randomly selected Form 990 returns that reported either $0 M&G or reported that 100% of their expenses went to M&G.
Our review of organizations’ Forms 990 reporting no M&G expenses found very few that appeared plausible. Most reported at least one item on the form itself or in the “other expenses”
attachments that would typically have an M&G component. Examples include accounting and legal fees, bank charges, salaries (one expects at least some of the chief staff person’s time to be spent on overall organization management), and insurance. We could find no evidence that
reliance on volunteers and donated goods and services explained the total absence of M&G expenses, although use of volunteers and donated goods and services cannot be ruled out, especially for small organizations such as child care coops, PTAs, or youth sports and recreation leagues that can use their managerial or administrative talents of their relatively large collection of member families.
More than one-third of the organizations that allocated 100% of their expenses to M&G could be readily identified as supporting trusts, foundations, or other organizations that provide funding, management services, or facilities to other nonprofit organizations. While the IRS instructions for the Form 990 do not explicitly deal with allocation of expenses related to
supporting organizations, the definition of program services includes any activities that “form the basis for the organization’s current exemption from tax.” (p.20) Thus, expenses relating to that funding or management support activity should be considered as program expenses, contrary to the practice of the “100% M&G reporters”. (There is a further complexity: Some organizations prepare consolidated financial statements that include closely related operating and supporting organizations. Arguably, for the purposes of the consolidated statement, the expenses that meet the test of the IRS Instructions as program expenses should be classified as M&G for purposes of a consolidated report.)
Our examination of Forms 990 for a sample of the remaining two-thirds of the
organizations that reported 100% M&G revealed no other rationales for their allocations. When their activities were examined carefully, many appeared to fall into the supporting organization category, or simply misreported their expenses. There was little or no evidence to indicate that substantial use of volunteers accounted for the lack of program expenses for the majority of organizations in this category.
The common thread between the “zero reporters” and the “100% reporters” appears to be the general failure of these organizations to exercise their judgment in the allocation of expenses.
For small single-program organizations in which the organization is, in a sense, indistinguishable from its single program, the failure is somewhat more understandable. However, unless
specified otherwise, we are including only those organizations that report a positive amount for both M&G and some other functional expense category in order to best eliminate accounting failure as an explanation for variation among organizations.
[Table 1 here]
4. Organizational Size, and Industry Subsectors
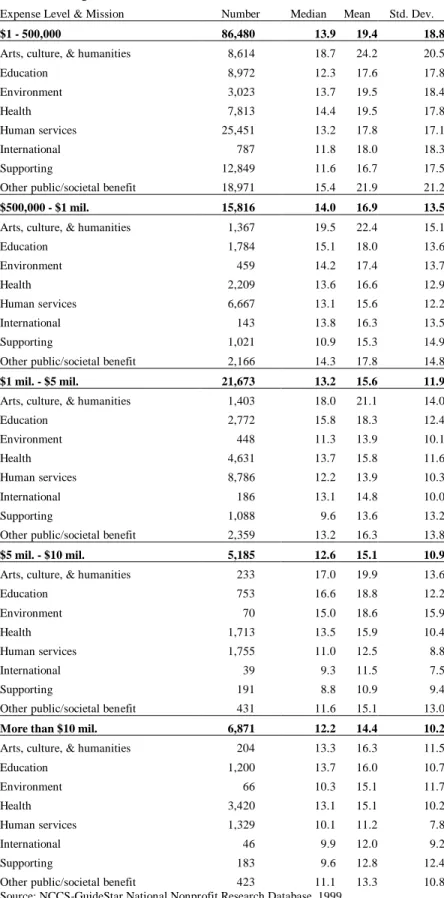
Tables 2 and 3 highlight the variations in reporting by both size and organizational mission for organizations reporting “plausible” levels of M&G expenses. (A parallel analysis that included organizations reporting 0% or 100% M&G levels shows similar relationships between the categories and similar means and medians – typically +/-2% – although, as
expected, the standard deviations tend to be much larger.) The median M&G levels ranged from 12.2% of total expenses for organizations with more than $10 million in total expenses to 13.9%
for organizations reporting less than $500,000. (Table 2) The corresponding means ranged from 14.4% to 19.4%. Among the size-mission categories, M&G levels ranged from a high of 24.2%
(mean) among small arts, culture and humanities organizations to a low of 10.9% for supporting organizations in the $5-10 million range.
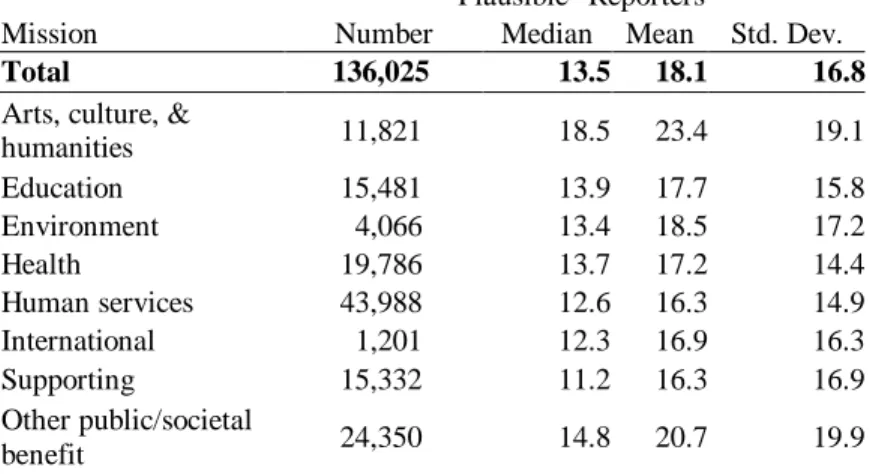
Overall, nonprofits had a median M&G level of 13.5% and a mean of 18.1%.
(Table 3) The “arts, culture, and humanities” and the “other public/societal benefit” subsectors reported substantially higher means (23.4% and 20.7%, respectively) and standard deviations
than other subsectors. The other subsectors clustered in a relatively narrow range around the sector mean and median.
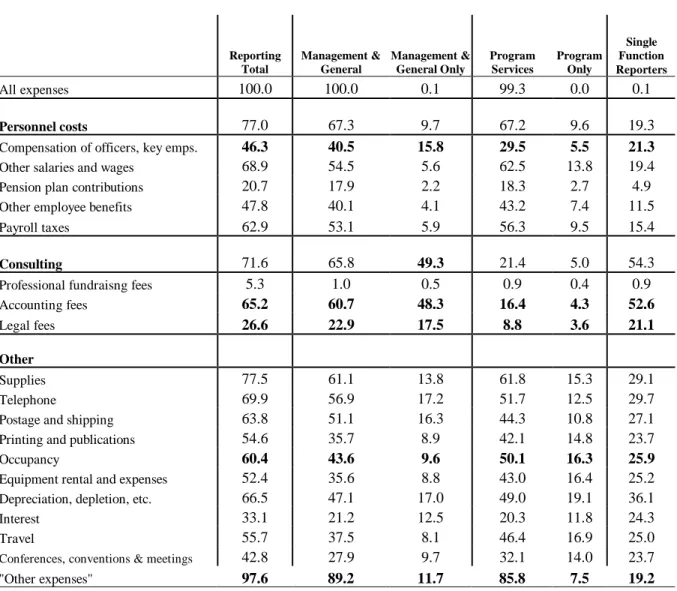
4. M&G Expense Items.
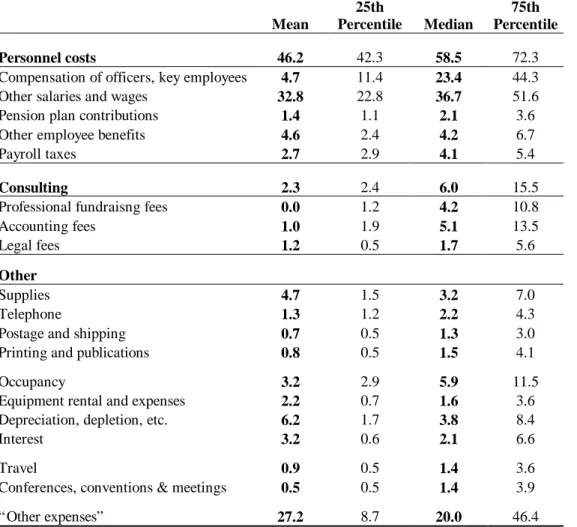
Table 4 examines the relative shares of specific expense items as a proportion of M&G (for those reporting some M&G expense for the line item). As might be expected, personnel costs are the largest single component of M&G, especially salaries and wages. Personnel costs constitute approximately one-half of the “average” nonprofit (46.2% is the mean and 58.5% is the median). One in four nonprofits spend more than 72% of M&G on salaries and wages.
With more than 27% of total M&G, the second largest category is “other expenses.”
Nearly 98% of organizations reported something in this catch-all category. (Table 5)
Approximately 2,000 (<2%) used these lines to allocate indirect costs reported in the specific M&G lines to program services or fundraising.2 The remainder used these lines to report a wide range of expenses, some of which ought to be reported on other lines and others that have no obvious home (e.g., consulting fees (unless legal, fundraising, or accounting) and non-personnel insurance costs). More could be done to either disaggregate this category or shift items that are now left in this category
The only other category that averages more than 5% of total M&G is depreciation and depletion. Occupancy costs, for organizations reporting values, had a median of 5.9% but a mean of only 3.2%.
Reported consulting fees (fundraising, accounting, and legal fees) play a relatively small role in reported M&G with a mean of 2.3% and the median of 6%.
[Table 4 here]
Do organizations carefully track or allocate each type of expense by function, or do they simply toss each expense into a single function with little regard for the actual usage of the expense? For example, are 100% of the salaries of executive directors, positions often associated with pure M&G functions, thrown into M&G, or do organizations try to allocate these salaries?
While this analysis cannot answer these questions definitively, it does permit us to estimate the potential magnitude of any reporting or record-keeping problems.
Setting aside the “implausible” returns where all expenses were allocated to M&G or to program, Table 5 shows the distribution of expenses for all other organizations. Seventy-seven percent reported personnel costs (which typically account for nearly half of total expenses) of some sort. Two-thirds allocated at least some of these costs to M&G and an equal percentage allocated some to program. Nearly 1 in 5 organizations allocated all of their personnel costs to either M&G (9.7%) or to program (9.6%). (Fundraising, the third function, is not displayed on the table but is included in the analysis of single-function reporters.) Thus, as many as 19% of organizations may be failing to distribute personnel costs across the three functions.
As expected, the distribution for the compensation of officers, directors, and key employees (where executive director, COO, and CFO salaries are often reported) looks quite different from the distribution of personnel costs as a whole. Surprisingly, less than half of reporting organizations reported any amounts on this line. However, nearly 16% allocated all of these costs to M&G while only 5.5% allocated these costs solely to program services. Also as expected, nearly half of all organizations (48.3%) allocated all of their accounting fees to M&G while only 4.3% allocated them exclusively to program services. While little more than a quarter
2 These organizations enter a negative value in M&G other expenses and an offsetting positive value to reallocate
of organizations (26.6%) reported legal fees, nearly two-thirds (17.5% of the total) allocated these costs solely to M&G.
The percentage of organizations reporting other items (supplies, telephone costs, etc.) in only one function ranges from 23.7% (printing and publications, and conferences) to 36.1% for depreciation and depletion costs. Arguably, since some of the level of expenses reported in these categories is relatively low, the impact of a “casual” approach to allocating these costs is less.
However, as noted earlier, more research is needed before any firm conclusions can be drawn.
[Table 5 here]
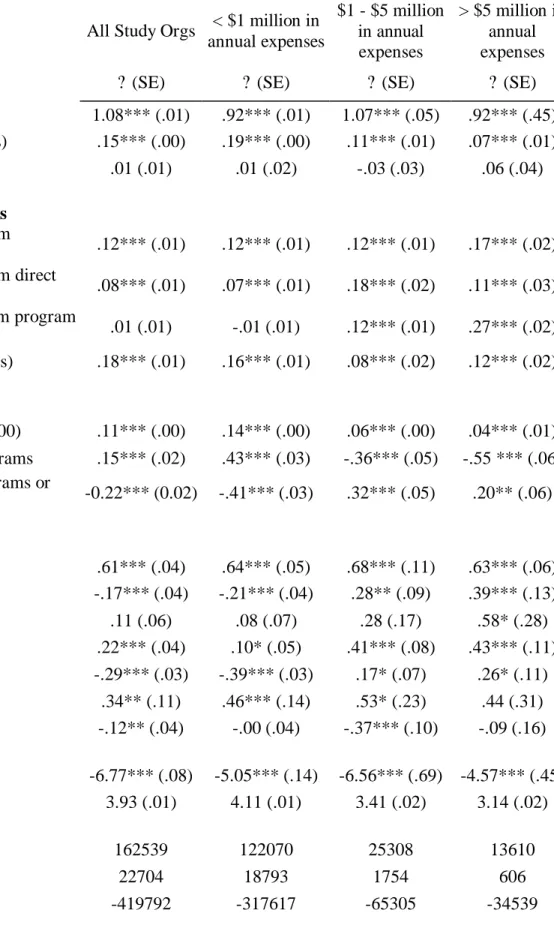
5. Multivariate Analysis
The preceding tables point to substantial variation in M&G expenses across nonprofit organizations. In the following analysis, we investigate the influence of a variety of independent variables on the total amount of money an organization allocates to M&G. Since the raw amount of money spent on M&G is partly a function of an organization's total expenditures, we include total expenses as a control variable. Taking into account the size of an organization, we expect M&G to increase with increased spending on fundraising; that is, increases in one category of overhead expenses will be mirrored by expenditures in another. Since an organization's age (that is, how well established it is in a community, and how well it has established its routines) is also frequently cited as a factor in cost allocations, we also include a measure of organizational age (2001 minus exempt ruling date) in our models.
We also explore three other sets of variables. The first set includes four revenue and asset ratios. The first three variables are the proportion of organizational revenues from
government grants, direct contributions, and program service revenues, respectively. We include these measures because organizations that rely on particular revenue sources presumably face different pressures for how they allocate their expenses. For example, our discussion of previous research above describes conflicting evidence on the relationship between reliance on
government revenues and an organization's funding mix. Inclusion of these revenue ratios provide new insights into this question, as well as others. The fourth measure in this set of variables is the ratio of total organizational assets to operating expenditures. This measure will allow us to test the intuitive claim that increasing organizational assets requires increasing allocations of M&G in order to manage and protect them.
We label the second set of variables "accounting practice" variables. We include these variables to test our concerns that allocation to M&G is due in part to inadequate accounting procedures. The first variable is the amount spent on accounting fees, provided that the
organization spent at least $1000 on this expense. By including the variable, we hope to capture the influence of specialized, professional accounting on allocation of M&G. The other two variables are dummy variables that indicate a level of allocation sophistication. The first takes on a value of one (and zero otherwise) if an organization allocates at least some of its CEO salary to program expenses, rather than allocating all of it to M&G. The second takes on a value of one (and zero otherwise) if an organization allocates at least some of its occupancy costs to programs or fundraising.
The third set of variables are subsector dummy variables that take on a value of one if an organization operates primarily within a particular subsector, and zero otherwise. We assign organizations subsectors based on their National Taxonomy of Exempt Entities code, assigned
by the IRS. We include these markers for arts, education, environmental, health, human services, international, and support organizations. Support organizations operate in any subsector, but are those organizations whose primary purpose is to support the services of another nonprofit organization. The "missing" category in our system of subsector dummy variables is the public benefit category, so the parameters for the subsector dummies reflect their relationship relative to public benefit organizations.
Since a large proportion of organizations in the study report no M&G, the dependent variable includes a large number of zero cases. This condition returns biased estimators when we calculate regression models using ordinary least squares procedures. Consequently, we calculate our models based on the procedure suggested by Tobin (1958), where zero values are approximated based on the sample's non-zero values, the dependent variable has properties of a logit (properly Tobin's logit, known as the "tobit"), and the parameters of independent variables are generated by maximum likelihood estimation. Further, to normalize the distribution of the variables and facilitate interpretation, we estimate log-log models. That is, for both the
dependent variable (total M&G expenses) and non-dummy independent variables, we use the natural logs of the values.
< Table 6 about here >
The results (see Table 6) point to a variety of competing influences on M&G. As expected, M&G increases with the size (total annual expenditures) of an organization, and spending on fundraising independently increases with increased allocations to M&G. These results are consistent with the research in the for-profit world and the organizational behavior
literature. As an organization grows, it requires more layers of management to fight problems of span of control (i.e., how much information and/or staff any one person can handle) and shirking by and monitoring of employees. This effect may also result from relatively large nonprofits being more secure or entrenched, and, therefore, can more readily “afford” to spend more on M&G. Recall that in the bivariate analysis comparing just size and M&G, the smaller nonprofits tended to have higher M&G shares, but after controlling for differences in mission, age, sources of revenues, and accounting practices, the larger nonprofits have larger M&G on the margin.
Age of the nonprofit, however, is unrelated to M&G cost allocations. The routines and legitimacy that come with age have no significant effect on the level of M&G expenses.
Source of revenues has a statistically significant impact on M&G. As organizations become more reliant on a particular source of funds, whether that source is governmental, contributed, or earned, M&G increases. This is an unexpected finding, although we hypothesized that reliance on government would be associated with increased M&G.
Organizations that rely on government grants spend a disproportionate amount of time securing and complying with governmental grants. However, the three revenue proportions collectively suggest that increased M&G is associated with revenue source concentration rather than independent effects associated with a particular income stream. The positive parameters associated with the asset-to-expenses ratio indicate that M&G increases as an organization becomes more asset-intensive.
Accounting practices clearly play a role in the allocation of M&G, although the interpretation of the results is not always straightforward. Regardless of size, payment of accounting fees is positively associated with M&G expenses. This is contrary to the hypothesis
that the use of professional accountants is likely to lead to more sophisticated methods for allocating M&G expenses, which, in turn, could be expected to lead to lower reported M&G—
despite the added M&G expense of employing the outside accountants.
Allocating some or all of the CEOs salary to programs is associated with higher M&G among the small nonprofits (which constitutes three-fourths of the sample), but is associated with lower M&G for the medium and large nonprofits. Conversely, allocating some or all of
occupancy costs to program or fundraising tends to lower the costs of M&G among small
nonprofits, while this practice is associated with higher M&G among the medium and larger size organizations. We intended the CEO allocation and the occupancy allocation variables as
consistent measures of accounting and managerial sophistication, so the mixed results are puzzling.
The system of subsector controls provides some evidence that an organization's mission plays a role in the amount of money it allocates to M&G. The model that includes all the organizations in the study suggests that arts, international, and health organizations allocate higher proportions to M&G than public benefit organizations, which allocate at levels similar to the average environmental organizations. On the other hand, support organizations and
education organizations allocate less to M&G, on average, and human service organizations spend considerably less than public benefit organizations. These generalizations break down somewhat when one looks at the different size categories. Among the smaller and larger organizations, support nonprofits group with public benefit and environmental organizations in their average allocation of M&G. Among medium size and larger organizations, both
educational and human service nonprofits spend significantly more on M&G than their public benefit counterparts, while smaller education and human service nonprofits spend less than small public benefit organizations.
In sum, a variety of factors, some real and some artifacts of accounting procedures, play a role in explaining increased allocation of expenses to M&G. The clearest results are that M&G increases with increases in organizational size, increases in allocation to fundraising, increases in revenue concentration, increased reliance on professional accountants, and in participation in certain subsectors, most notably the arts.
6. Summary and Conclusions
There appears to be substantial inconsistency in the reporting of functional expenses.
While we cannot rule out variations due to organizational structure and activity for individual cases, the substantial percentage of organizations reporting either 0% or 100% M&G costs should raise concerns about the quality of reporting. Looking only at the reporting of line items for organizations reporting some M&G and some other functional expenses, we see that there remain surprisingly large numbers of organizations that allocate all of particular line items to only one function. Further in-depth research is needed to better understand the causes for this.
Setting aside the reporting issues, we have found wide variations in M&G expenses in organizations of all sizes. However, the variations are especially large among the smallest nonprofit organizations (i.e., those with less than $500,000 in operating expenses). Small nonprofits were less likely to report having any M&G, but of those reporting any M&G, the small ones had much higher M&G costs than the larger size categories of nonprofits, on average.
Personnel costs constitute the majority of M&G costs, but it is clear that many nonprofits are still volunteer-driven. At least one-third of all nonprofits filing 990s in 1999 had not paid any salaries, wages or payroll taxes.
The use of regression analyses found that institutional characteristics do make a significant difference in understanding M&G expenses. We found that mission matters; size matters; and the sources of revenue matters. Similarly, accounting practices seem to matter and they serve as a useful proxy for financial sophistication of the nonprofit.
Although this study represents only a beginning, Form 990 data appears to provide a useful tool for comparing M&G expenses for different types of organizations. Future research is needed to refine this analysis within NTEE codes and to help us better understand the allocation decision-making processes.
References
Benjamin, C. (2000). Broken yardstick: Administrative cost rates as a measure of nonprofit effectiveness. CompassPoint Nonprofit Services.
Froelich, K.A., Knopfle, T.W., & Pollak, T.H. (2000). Financial measures in nonprofit
organization research: Comparing IRS 990 return and audited financial statement data.
Nonprofit and Voluntary Sector Quarterly, 29, 232-254.
Frumkin, P., Kim, M.T. (2001). Strategic positioning and the financing of nonprofit organizations: Is efficiency rewarded in the contributions marketplace? Public Administration Review, 61, 266-275.
Greenlee, J.S. (2000). Accountability in the Information Age. In P.P. Pribbenow (ed.), Serving the public trust: Strengthening the role of fundraising research (pp. xx-xx). San
Francisco: Jossey-Bass.
Greenlee, J.S., & Trussel, J. (2000). Predicting the financial vulnerability of charitable organizations. Nonprofit Management and Leadership, 11, 199-210.
Hager, M.A. (2000). Financial vulnerability among arts organizations: A test of the Tuckman- Chang measures. Nonprofit and Voluntary Sector Quarterly, 30, 376-392.
Okten, K., & Weisbrod, B., (2000). Determinants of donations in private nonprofit markets.
Journal of Public Economics, 75, 255-72.
National Health Council, Inc. and the National Assembly of National Voluntary Health and Social Welfare Organizations, Inc. (1998). Standards of Accounting and Financial Reporting for Voluntary Health and Welfare Organizations – 4th Edition (The Black Book). Dubuque, IA: Kendall/Hunt Publishing Co.
Rose-Ackerman, S. (1982). Charitable giving and 'excessive' fundraising. The Quarterly Journal of Economics, 97, 195-212.
Steinberg, R. (1986). Should donors care about fundraising? In S. Rose-Ackerman (ed.), The Economics of Nonprofit Institutions: Studies in Structure and Policy (pp. 347-364).
Oxford University Press.
Stone, M.M., Hager, M.A, & Griffin, J.J. (2001). Organizational characteristics and funding environments: A study of a population of United-Way affiliated nonprofits. Public Administration Review, 61, 276-289.
Table 1: Overview of Management and General Reporting, by Operating Expense Level
Less than
$500,000
$500,000 -
$1 Million.
$1-5 Million
$5 - 10 Million
$10 Million or
More All
Number of organizations 104,985 18,711 25,325 5,835 7,782 162,638
Percent with missing totals or invalid values 1.48% 0.05% 0.06% 0.05% 0.06% 1.03%
Percent reporting 0% of expenses as M&G 16.27% 9.12% 6.93% 4.83% 4.16% 13.01%
Percent reporting 100% of expenses as
M&G 3.40% 0.63% 0.43% 0.39% 0.21% 2.32%
Percent with nonzero values for management
and general expenses 79% 90% 93% 95% 96% 84%
Source: NCCS-GuideStar National Nonprofit Research Database, 1999.
Table 2: Management and General Expenses as a Percentage of Total Expenses
Expense Level & Mission Number Median Mean Std. Dev.
$1 - 500,000 86,480 13.9 19.4 18.8
Arts, culture, & humanities 8,614 18.7 24.2 20.5
Education 8,972 12.3 17.6 17.8
Environment 3,023 13.7 19.5 18.4
Health 7,813 14.4 19.5 17.8
Human services 25,451 13.2 17.8 17.1
International 787 11.8 18.0 18.3
Supporting 12,849 11.6 16.7 17.5
Other public/societal benefit 18,971 15.4 21.9 21.2
$500,000 - $1 mil. 15,816 14.0 16.9 13.5
Arts, culture, & humanities 1,367 19.5 22.4 15.1
Education 1,784 15.1 18.0 13.6
Environment 459 14.2 17.4 13.7
Health 2,209 13.6 16.6 12.9
Human services 6,667 13.1 15.6 12.2
International 143 13.8 16.3 13.5
Supporting 1,021 10.9 15.3 14.9
Other public/societal benefit 2,166 14.3 17.8 14.8
$1 mil. - $5 mil. 21,673 13.2 15.6 11.9
Arts, culture, & humanities 1,403 18.0 21.1 14.0
Education 2,772 15.8 18.3 12.4
Environment 448 11.3 13.9 10.1
Health 4,631 13.7 15.8 11.6
Human services 8,786 12.2 13.9 10.3
International 186 13.1 14.8 10.0
Supporting 1,088 9.6 13.6 13.2
Other public/societal benefit 2,359 13.2 16.3 13.8
$5 mil. - $10 mil. 5,185 12.6 15.1 10.9
Arts, culture, & humanities 233 17.0 19.9 13.6
Education 753 16.6 18.8 12.2
Environment 70 15.0 18.6 15.9
Health 1,713 13.5 15.9 10.4
Human services 1,755 11.0 12.5 8.8
International 39 9.3 11.5 7.5
Supporting 191 8.8 10.9 9.4
Other public/societal benefit 431 11.6 15.1 13.0
More than $10 mil. 6,871 12.2 14.4 10.2
Arts, culture, & humanities 204 13.3 16.3 11.5
Education 1,200 13.7 16.0 10.7
Environment 66 10.3 15.1 11.7
Health 3,420 13.1 15.1 10.2
Human services 1,329 10.1 11.2 7.8
International 46 9.9 12.0 9.2
Supporting 183 9.6 12.8 12.4
Other public/societal benefit 423 11.1 13.3 10.8
Source: NCCS-GuideStar National Nonprofit Research Database, 1999.
Organizations reporting >0 and <100% M&G.
Table 3: Management and General Expenses as a Percentage of Total Expenses
"Plausible" Reporters
Mission Number Median Mean Std. Dev.
Total 136,025 13.5 18.1 16.8
Arts, culture, &
humanities 11,821 18.5 23.4 19.1
Education 15,481 13.9 17.7 15.8
Environment 4,066 13.4 18.5 17.2
Health 19,786 13.7 17.2 14.4
Human services 43,988 12.6 16.3 14.9 International 1,201 12.3 16.9 16.3
Supporting 15,332 11.2 16.3 16.9
Other public/societal
benefit 24,350 14.8 20.7 19.9
Source: NCCS-GuideStar National Nonprofit Research Database, 1999.
Organizations reporting >0 and <100% M&G.
Table 4: Specific Expense Items as a Proportion of Management & General Expenses (Includes only cases with non-zero values of M&G)
Mean
25th
Percentile Median
75th Percentile
Personnel costs 46.2 42.3 58.5 72.3
Compensation of officers, key employees 4.7 11.4 23.4 44.3
Other salaries and wages 32.8 22.8 36.7 51.6
Pension plan contributions 1.4 1.1 2.1 3.6
Other employee benefits 4.6 2.4 4.2 6.7
Payroll taxes 2.7 2.9 4.1 5.4
Consulting 2.3 2.4 6.0 15.5
Professional fundraisng fees 0.0 1.2 4.2 10.8
Accounting fees 1.0 1.9 5.1 13.5
Legal fees 1.2 0.5 1.7 5.6
Other
Supplies 4.7 1.5 3.2 7.0
Telephone 1.3 1.2 2.2 4.3
Postage and shipping 0.7 0.5 1.3 3.0
Printing and publications 0.8 0.5 1.5 4.1
Occupancy 3.2 2.9 5.9 11.5
Equipment rental and expenses 2.2 0.7 1.6 3.6
Depreciation, depletion, etc. 6.2 1.7 3.8 8.4
Interest 3.2 0.6 2.1 6.6
Travel 0.9 0.5 1.4 3.6
Conferences, conventions & meetings 0.5 0.5 1.4 3.9
“Other expenses” 27.2 8.7 20.0 46.4
Source: NCCS-GuideStar National Nonprofit Research Database, 1999.
Organizations reporting >0 and <100% M&G.
Table 5: Percentage of Form 990 Filers Reporting by Line
Reporting Total
Management &
General
Management &
General Only
Program Services
Program Only
Single Function Reporters
All expenses 100.0 100.0 0.1 99.3 0.0 0.1
Personnel costs 77.0 67.3 9.7 67.2 9.6 19.3
Compensation of officers, key emps. 46.3 40.5 15.8 29.5 5.5 21.3
Other salaries and wages 68.9 54.5 5.6 62.5 13.8 19.4
Pension plan contributions 20.7 17.9 2.2 18.3 2.7 4.9
Other employee benefits 47.8 40.1 4.1 43.2 7.4 11.5
Payroll taxes 62.9 53.1 5.9 56.3 9.5 15.4
Consulting 71.6 65.8 49.3 21.4 5.0 54.3
Professional fundraisng fees 5.3 1.0 0.5 0.9 0.4 0.9
Accounting fees 65.2 60.7 48.3 16.4 4.3 52.6
Legal fees 26.6 22.9 17.5 8.8 3.6 21.1
Other
Supplies 77.5 61.1 13.8 61.8 15.3 29.1
Telephone 69.9 56.9 17.2 51.7 12.5 29.7
Postage and shipping 63.8 51.1 16.3 44.3 10.8 27.1
Printing and publications 54.6 35.7 8.9 42.1 14.8 23.7
Occupancy 60.4 43.6 9.6 50.1 16.3 25.9
Equipment rental and expenses 52.4 35.6 8.8 43.0 16.4 25.2
Depreciation, depletion, etc. 66.5 47.1 17.0 49.0 19.1 36.1
Interest 33.1 21.2 12.5 20.3 11.8 24.3
Travel 55.7 37.5 8.1 46.4 16.9 25.0
Conferences, conventions & meetings 42.8 27.9 9.7 32.1 14.0 23.7
"Other expenses" 97.6 89.2 11.7 85.8 7.5 19.2
Source: NCCS-GuideStar National Nonprofit Research Database, 1999.
Organizations reporting >0 and <100% M&G.
Table 6: The influence of organizational characteristics on M&G expenses, Tobit models by organizational size category
All Study Orgs < $1 million in annual expenses
$1 - $5 million in annual expenses
> $5 million in annual expenses
? (SE) ? (SE) ? (SE) ? (SE)
LN(total expenses) 1.08*** (.01) .92*** (.01) 1.07*** (.05) .92*** (.45) LN(total fundraising expenses) .15*** (.00) .19*** (.00) .11*** (.01) .07*** (.01)
LN(age) .01 (.01) .01 (.02) -.03 (.03) .06 (.04)
Revenue and Asset Variables LN(Proportion of revenue from
government grants) .12*** (.01) .12*** (.01) .12*** (.01) .17*** (.02) LN(Proportion of revenue from direct
contributions) .08*** (.01) .07*** (.01) .18*** (.02) .11*** (.03) LN(Proportion of revenue from program
services) .01 (.01) -.01 (.01) .12*** (.01) .27*** (.02)
LN(total assets / total expenses) .18*** (.01) .16*** (.01) .08*** (.02) .12*** (.02) Accounting Practices
LN(Accounting fees, if > $1000) .11*** (.00) .14*** (.00) .06*** (.00) .04*** (.01) CEO salary allocation to programs .15*** (.02) .43*** (.03) -.36*** (.05) -.55 *** (.06) Occupancy allocation to programs or
fundraising -0.22*** (0.02) -.41*** (.03) .32*** (.05) .20** (.06) Subsector Controls
Arts, Culture, Humanities .61*** (.04) .64*** (.05) .68*** (.11) .63*** (.06)
Education -.17*** (.04) -.21*** (.04) .28** (.09) .39*** (.13)
Environment .11 (.06) .08 (.07) .28 (.17) .58* (.28)
Health .22*** (.04) .10* (.05) .41*** (.08) .43*** (.11)
Human Services -.29*** (.03) -.39*** (.03) .17* (.07) .26* (.11)
International .34** (.11) .46*** (.14) .53* (.23) .44 (.31)
Support -.12** (.04) -.00 (.04) -.37*** (.10) -.09 (.16)
Intercept -6.77*** (.08) -5.05*** (.14) -6.56*** (.69) -4.57*** (.45) Tobit Scale Parameter 3.93 (.01) 4.11 (.01) 3.41 (.02) 3.14 (.02)
N 162539 122070 25308 13610
Left-censored (zero) values 22704 18793 1754 606
Log-Likelihood -419792 -317617 -65305 -34539