ATOLL RESEARCH BULLmM
---
NO.
96
Some aspects of the meteorology of the tropical Pacific viewed from an atoll
by
Ronald L. Lavoie
Issued by
THE PACIFIC SCIENCE BOARD
National Academy of Sciences-National Research Council May 15, 1963
Contribution No. 51
Hawaii Institute of Geophysics
It i s a pleasure t o commend t h e f a r - s i g h t e d policy of t h e Office of Naval Research, with i t s emphasis on b a s i c research, as a r e s u l t of which a grant has made possible t h e continuation of t h e Coral A t o l l Program of t h e P a c i f i c Science Board.
It i s of i n t e r e s t t o note, h i s t o r i c a l l y , t h a t much of t h e fundamental information on a t o l l s of t h e P a c i f i c was gathered by t h e U.S. Navy's South P a c i f i c Ekploring Expedition, over one hundred years ago, under t h e command of Captain Charles Wilkes. The continuing n a t u r e of such s c i e n t i f i c i n t e r e s t by t h e Navy i s shown by t h e support f o r the P a c i f i c Science Board's research programs during t h e p a s t f i f t e e n y e a r s .
The d u p l i c a t i o n and d i s t r i b u t i o n of A t o l l Research B u l l e t i n No. 96 has been financed by funds from Contract Nonr-2300 ( 1 2 ) .
The research work leading t o t h e r e s u l t s reported h e r e i n was conducted a t t h e University of Hawaii under t h e j o i n t sponsorship of t h e Geophysics Research Directorate, A i r Force Cambridge Research Laboratories and t h e U.S.
Navy Weather Research F a c i l i t y under Contract No. ~ ~ 1 9 ( 6 0 4 ) - 7 2 2 9 . This paper has been prepared a s a s c i e n t i f i c r e p o r t t o t h e s e agencies and i s here reproduced i d e n t i c a l l y except f o r t h e a d d i t i o n of a Glossary of terms f o r t h e b e n e f i t of t h e broader A t o l l Research B u l l e t i n audience. It i s submitted a s Contribution No. 5 1 of t h e Hawaii I n s t i t u t e of Geophysics.
The s o l e r e s p o n s i b i l i t y f o r a l l statements made by authors of papers i n t h e A t o l l Research B u l l e t i n r e s t s with them, and they do not n e c e s s a r i l y represent t h e views of t h e P a c i f i c Science Board o r of t h e e d i t o r s of t h e B u l l e t i n .
E d i t o r i a l S t a f f F. R. Fosberg, e d i t o r M.-H. Sachet, a s s i s t a n t e d i t o r
Correspondence concerning t h e A t o l l Research B u l l e t i n should be addressed t o t h e above
P a c i f i c Vegetation P r o j e c t c/o National Research Council 2101 Cons ti t u t ion Avenue, N. W
.
Washington 25, D.C., U. S.A.
CONTENTS
Page
-
ABSTRACT INTRODUCTION
PART 1: ElKLWETOK AS AN OBSERVING PLATFORM PART 2 : DIURNAL VARIATIONS
General Comments Sea Level P r e s s u r e S u r f a c e Wind
Low Cloudiness P r e c i p i t a t i o n
Temperature and Humidity Rawinsonde I n f o m t i o n PART
3
: SYNOPTIC -SCALE DISTURBANCESDisturbances i n S u r f a c e Wind D i r e c t i o n Soundings Versus S u r f a c e Wind D i r e c t i o n Disturbances i n S u r f a c e Wind Speed Trade Wind Maxima and Minima
ACKNOrnDGEMENTS rnERENCES
LIST OF TABLFS
AND
FIGURESTable Page
-
9
1 3 Influence of oceanic t i d e on low cloudiness.
Annual harmonic components of d i u r n a l v a r i a t i o n s of pressure, wind, temperature and humidity.
Monthly mean 24-, 12-, and 8-hourly pressure o s c i l l a t i o n s .
Comparison of observed and predicted a i r t i d e s
Variation with a l t i t u d e of d i u r n a l t r e n d s of T and Td.
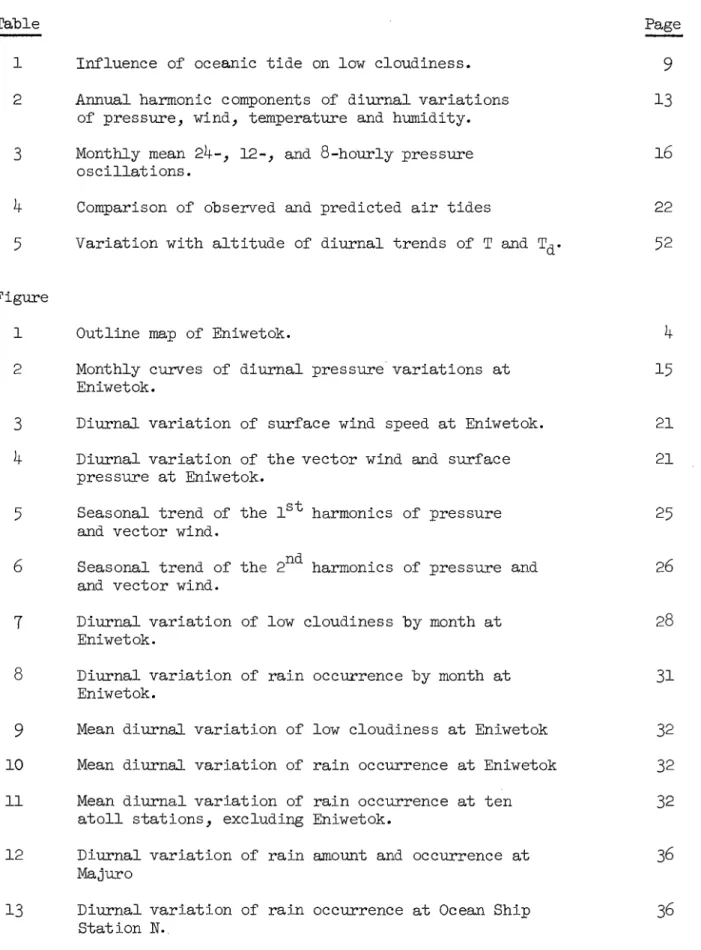
Figure 1 2
Outline map of Eniwetok.
Monthly curves of d i u r n a l pressure' v a r i a t i o n s a t Eniwetok.
Diurnal v a r i a t i o n of surface wind speed a t Eniwetok.
Diurnal v a r i a t i o n of t h e v e c t o r wind and surface p r e s s u r e a t Eniwetok.
Seasonal t r e n d of t h e lSt harmonics of pressure and v e c t o r wind.
Seasonal trend of t h e 2nd harmonics of pressure and and v e c t o r wind.
Diurnal v a r i a t i o n of low cloudiness by month a t Eniwet ok.
Diurnal v a r i a t i o n of r a i n occurrence by month a t Eniwetok.
Mean d i u r n a l v a r i a t i o n of low cloudiness a t Eniwetok Mean d i u r n a l v a r i a t i o n of r a i n occurrence a t Eniwetok Mean d i u r n a l v a r i a t i o n of r a i n occurrence a t t e n a t o l l s t a t ions, excluding Eniwet ok.
Diurnal v a r i a t i o n of r a i n amount and occurrence a t Majuro
Diurnal v a r i a t i o n of r a i n occurrence a t Ocean Ship S t a t i o n N.
Figure
1 4
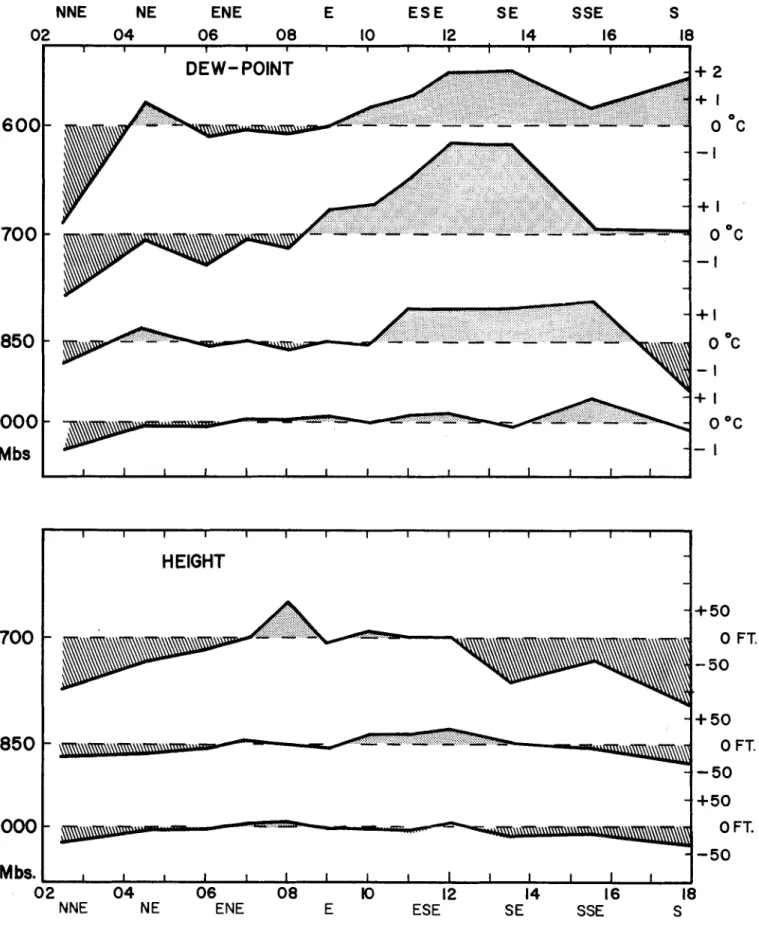
Diurnal v a r i a t i o n of surface temperature and humidity a t Eniwetok.1 5
Diurnal v a r i a t i o n of temperature, humidity and wind speed i n t h e lower atmosphere over Eniwetok.16 Weather versus d i r e c t i o n of surface wind a t Eniwetok.
17
Radiosonde measurements a s a f u n c t i o n of d i r e c t i o n of surface wind a t Eniwetok during strong t r a d e season.18 Radiosonde measurements a s a function of t h e d i r e c t i o n of surface wind a t Eniwetok during weak t r a d e season.
19
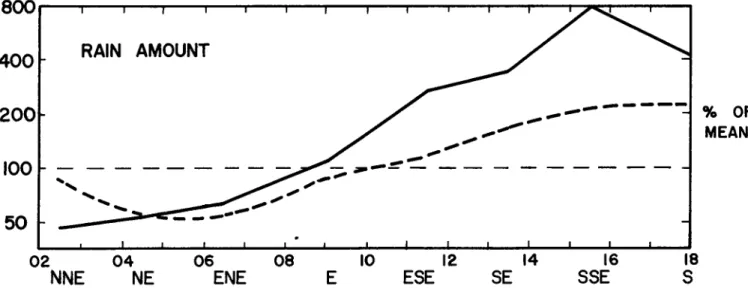
Motorboating a t 600 and 700 mb versus d i r e c t i o n of s u r f a c e wind a t Eniwetok.20 Mean r a i n amount a t Eniwetok versus surface wind d i r e c t i o n .
21 Weather versus speed of surface wind a t Eniwetok.
22 Weather versus magnitude of surface wind speed changes a t Eniwetok.
Page
-
47
ABSTRACT
A d e t a i l e d c l i m a t o l o g i c a l study of s u r f a c e and upper-air d a t a from Eniwetok A t o l l was c a r r i e d out i n order t o throw l i g h t upon v a r i o u s t r o p i c a l oceanic problems including i s l a n d influence, d i u r n a l v a r i a t i o n s , and t h e n a t u r e of synoptic disturbances. Among r e s u l t s of t h e a n a l y s i s a r e : 1) t h e a t o l l i n f l u e n c e upon cloud o r p r e c i p i t a t i o n over t h e a t o l l i t s e l f i s h a r d l y d e t e c t a b l e and probably i n s i g n i f i c a n t ; 2 ) t h e d i u r n a l v a r i a t i o n of t h e s u r f a c e wind i s almost e x c l u s i v e l y t h e r e s u l t of world-wide, atmospheric t i d a l motions, except f o r a p o s s i b l e speed i n c r e a s e of l e s s t h a n 0.1 k t n e a r mid-day; 3) low cloudiness shows a d i u r n a l v a r i a t i o n whose range i s l e s s t h a n
4%
of t o t a l sky w i t h m a x i m u m cover a t 0700 l o c a l time;4)
p r e c i p i t a t i o n occurrence shows a d i s t i n c t e a r l y morning maximum;5
) i n synoptic d i s t u r b a n c e s a f f e c t i n g t h e region, equatorward flow gives r i s e t o a s l i g h t tendency f o r b e t t e r t h a n normal weather while poleward flow i s a s s o c i a t e d with markedly w e t t e r weather;6 )
d i s t u r b a n c e s which make themselves f e l t p r i m a r i l y i n t h e wind speed f i e l d appear t o c o n t r i b u t e s i g n i f i c a n t l y t o bad weather p e r i o d s a t Eniwetok.The problem of d i u r n a l r a i n f a l l v a r i a t i o n i s e l a b o r a t e d by i n c l u s i o n of d a t a from a weather s h i p and s e v e r a l o t h e r a t o l l s t a t i o n s . Various hypotheses a r e examined and it i s concluded t h a t t h e v a r i a t i o n i n shower frequency i s most l i k e l y t h e r e s u l t of cumulative s t a b i l i z a t i o n of t h e cloud l a y e r by a b s o r p t i o n of s o l a r energy i n t h e cloud t o p s by day. The v a r i a t i o n i n low cloud cover i s f e l t t o be due p r i m a r i l y t o a d i u r n a l v a r i a t i o n i n s e n s i b l e h e a t t r a n s f e r a c r o s s t h e a i r - s e a i n t e r f a c e .
I n t r o d u c t i o n
The renaissance which t r o p i c a l meteorology has experienced s i n c e about 1940 has been channelled q u i t e understandably i n t h e d i r e c t i o n of a b e t t e r understanding and p r e d i c t i o n of t h e l i f e c y c l e of t r o p i c a l cyclones. I n s p i t e of t h e tremendous s i g n i f i c a n c e of improvement i n t h i s asea, t h e r e a r e meteorologists who w i l l remind us t h a t t h e import- a n t t r o p i c a l problems demanding s o l u t i o n a r e not l i m i t e d t o t h e c i r c u - l a t i o n of t h e t r o p i c a l cyclone. I n t h i s group of meteorologists a r e t h e f o r e c a s t e r s i n those a r e a s g e n e r a l l y f r e e f r o m . t h e s e d e s t r u c t i v e storms who must f a c e t h e vexing problems provided by t h e "undisturbed"
o r weakly d i s t u r b e d t r o p i c a l atmosphere. Also t h e r e a r e those who f e e l t h a t t h e improvement i n our understanding and p r e d i c t i o n of t h e t r o p i c a l cyclone w i l l be, o r indeed may a l r e a d y be, s t u n t e d by t h e d e f i c i t of knowledge of t h e smaller s c a l e o r more normal processes of t h e t r o p i c a l atmosphere. F i n a l l y , t h e s t u d e n t of t h e g e n e r a l c i r c u l a t i o n of t h e g l o b a l atmosphere w i l l remind us t h a t t h e heat and moisture f e d
i n t o t h e t r o p i c a l atmosphere plays t h e r o l e of prime mover f o r t h e l a r g e s c a l e motion systems of ocean and a i r . Most of t h i s d r i v i n g energy and i t s day t o day v a r i a t i o n s must be provided through processes a p a r t from t r o p i c a l cyclones.
The t r o p i c a l l a t i t u d e s a r e l a r g e l y oceanic. The proper framework f o r b u i l d i n g an understanding of t h e t r o p i c a l atmosphere must r e s t upon a p r e c i s e d e s c r i p t i o n of ocean-atmosphere i n t e r a c t i o n processes and a c c u r a t e measurements of t h e atmosphere over t h e sea. But where does one g a t h e r such information? There have been no weather s h i p s s t a t i o n e d
deep w i t h i n t h e t r o p i c s , and oceanographic expeditions r a r e l y s t a y i n one p l a c e long enough t o provide d e f i n i t i v e d e s c r i p t i o n .
I s l a n d s a r e p l e n t i f u l only i n r e s t r i c t e d r e g i o n s of t h e t r o p i c a l oceans, y e t t h e s e provide us w i t h s t a b l e observing p l a t f o m which have c o n t r i b u t e d much of our knowledge of t r o p i c a l maritime weather. However, t h e t r o p i c a l atmosphere i s f r e q u e n t l y i n such d e l i c a t e balance w i t h t h e s e a s u r f a c e t h a t even a r a t h e r small i s l a n d might conceivably l e a v e an i n d e l i b l e imprint upon l o c a l weather and our p i c t u r e of t h e low l e v e l atmosphere. Accounting f o r t h e s e l o c a l i n f l u e n c e s i s g e n e r a l l y f a r from a simple t a s k . Furthermore,how can a r a t i o n a l understanding be conceived u n t i l one l e a r n s what t h e v a r i a t i o n s would be without t h e i n t r u s i o n of a land mass ?
The primary o b j e c t i v e of t h i s i n v e s t i g a t i o n has been t o s c r u t i n i z e t h e standard meteorological o b s e r v a t i o n s from a c o r a l a t o l l t o determine:
1) t h e e x t e n t t o which such a t i n y i s l a n d d i s t u r b s i t s atmospheric
environment; 2 ) t h e c h a r a c t e r of d i u r n a l v a r i a t i o n s over t h e sea; 3) t h e c o n t r i b u t i o n s which a d e t a i l e d c l i m a t o l o g i c a l a n a l y s i s of such records might be a b l e t o make on t h e question of t h e n a t u r e of low-level d i s t u r b - ances i n t h e c e n t r a l t r o p i c a l P a c i f i c .
When problems such a s t h e s e have been d e a l t w i t h s a t i s f a c t o r i l y it should be p o s s i b l e t o make more i n t e l l i g e n t use of i s l a n d and s h i p obser- v a t i o n s i n t h e t r o p i c s . . From t h e a p p l i e d s t a n d p o i n t such information would be v e r y h e l p f u l i n b u i l d i n g a proper frame of reference f o r t h e e v a l u a t i o n of orographic and h e a t source e f f e c t s on t r o p i c a l i s l a n d s .
P a r t I: Eniwetok As an Observing Platform
It i s , of course, improper t o ask whether a small i s l a n d has any e f f e c t on t h e overlying atmosphere. Even t h e s m a l l e s t i s l e t has some e f f e c t , even i f t h e influence be l i m i t e d t o t h e lowest few centimeters of a i r . Furthermore one must not n e g l e c t t h e a c t i o n of t h e sub-surface land mass a s an o b s t a c l e t o normal oceanic processes. This might a l t e r t h e surface-water p r o p e r t i e s i n t h e neighborhood of t h e i s l a n d and t r a n s - m i t i t s i n f l u e n c e t o t h e atmosphere i n d i r e c t l y .
One must f i r s t s e l e c t t h e v a r i a b l e and t h e l o c a t i o n of i t s measure- ment and t h e n ask whether t h e i n f l u e n c e of t h e i s l a n d makes a s i g n i f i c a n t impression. Conjuring up experiments t o answer such a question i s an i n t e r e s t i n g pastime, b u t under t h e c o n s t r a i n t of e x i s t i n g d a t a t h e approaches a r e few and t h e answers a r e perhaps only suggestive.
Eniwetok a t o l l was s e l e c t e d f o r i n t e n s i v e study f o r s e v e r a l reasons.
It i s f i r s t l y r e p r e s e n t a t i v e of a moderate s i z e d a t o l l f a r removed from o t h e r land and o v e r l a i n by a p e r s i s t e n t t r a d e wind regime throughout t h e year. Secondly, t h e a t o l l has been t h e s i t e of s p e c i a l i n t e n s i v e d a t a c o l l e c t i o n on s e v e r a l occasions a s t h e r e s u l t of n u c l e a r test'programs i n t h e a r e a . Thirdly, t h e U n i v e r s i t y bf Hawaii has on f i l e some 150,000 punched cards c o n t a i n i n g hourly s u r f a c e observations, radiosonde and rawinsonde d a t a f o r much of t h e period of record a t Eniwetok. This f i l e i s a p o r t i o n of t h e P a c i f i c d a t a l i b r a r y t r a n s f e r r e d t o t h e U n i v e r s i t y by t h e meteorological support arm of 'Joint Task Force Seven.
Eniwetok i s an i s o l a t e d a t o l l s i t u a t e d a t t h e northwest edge of t h e Marshall I s l a n d s group. It i s some 2500 s t a t u t e miles west-southwest of
Eniwetok Atoll
Eniwetok Island
B
Fig 1. Outline map of Eniwetok Atoll. Dark areas depict dry land, clear out- lines show outer margin of reef flats. Location of weather instruments is
' shown on enlarged chart of the main islet at bottom.
Honolulu a t
1 1 . 4 ~ ,
162.33. The a t o l l c o n s i s t s of a chain of about t h i r t y small i s l e t s s t r u n g on c o r a l r e e f around a n oval lagoon 25 miles long by about 20 miles wide ( F i g 1 ) . Most of t h e i s l e t s a r e l e s s t h a n13
f t high but some have coconut palms reaching t o over 80 f t . The lagoon i s q u i t e deep, approximately155
f t on t h e average. A d e t a i l e d p r e s e n t a t i o n of t h e geology and hydrography of t h e a t o l l i s a v a i l a b l e i n a r e p o r t of t h e U. S. Geological Survey (Rnery e t a l ,1954).
A compre- hensive swnmary of t h e topography, vegetation, and climate of Eniwetok i s provided, along with o r i g i n a l d a t a from a b r i e f , i n t e n s i v e microclimatic o b s e r v a t i o n a l program, by Blumenstock and Rex (1960).The only meteorological d a t a of s u f f i c i e n t e x t e n t and homogeneity were c o l l e c t e d near t h e main runway on Eniwetok I s l e t ( F i g 1). It w i l l be noted t h a t t h i s l o c a t i o n i s on t h e windward s i d e of t h e a t o l l under p r e v a i l i n g e a s t - n o r t h e a s t flow. The standard instruments a r e so s i t u a t e d t h a t t h e a i r reaching them under t y p i c a l t r a j e c t o r y probably t r a v e r s e s l e s s t h a n 400 meters of land s u r f a c e .
With d a t a from only one s t a t i o n on an a t o l l t h e e v a l u a t i o n of disturbances r e s u l t i n g from t h e a t o l l i s d i f f i c u l t a t b e s t . An obvious approach i s t o determine t h e d i u r n a l v a r i a t i o n of v a r i o u s elements and t o compare t h e s e with t h e expected t r e n d s r e s u l t i n g from t h e presence of a land surface. This w i l l be done i n t h e next s e c t i o n . C e r t a i n l y t h e most important e f f e c t s of t h e a t o l l would be t h e r e s u l t of t h e c o n t r a s t -
ing heat t r a n s f e r processes of land v e r s u s water and t h e s e should be exemplified by d i u r n a l curves.
This approach i s not completely s a t i s f a c t o r y s i n c e t h e r e may remain some systematic i n f l u e n c e p r e s e n t both day and night. One might expect,
f o r example, a d i f f e r e n t s u r f a c e f r i c t i o n regime over t h e i s l e t s t o have some e f f e c t on l o w - l e v e l winds. Also t h e lagoon water temperature may w e l l b e maintained a t a s l i g h t l y h i g h e r v a l u e t h a n t h a t of t h e surrounding f r e e ocean where f r e e c i r c u l a t i o n i s unimpeded. The temperature d i f f e r - ence i s probably s l i g h t i n t h i s c a s e w i t h a deep lagoon and c o n s i d e r a b l e t i d a l and wave exchange through channels and over i n t e r - t i d a l r e e f s .
Some s c a n t y d a t a a r e a v a i l a b l e
l lumen stock
and Rex, 1960) which i n d i c a t e t h a t t h e lagoon s u r f a c e w a t e r i s u s u a l l y l e s s t h a n 1 0 F warmer t h a n t h e nearby ocean i n August. A h e a t source of t h i s magnitude seems u n l i k e l y t o make i t s e l f f e l t i n t h e cloud and p r e c i p i t a t i o n regime.An attempt t o throw some l i g h t on t h i s l a t t e r problem was made by a study of weather v a r i a t i o n s a s s o c i a t e d w i t h t h e s t a t e of t h e oceanic t i d e . The r e a s o n i n g h e r e was a s f o l l o w s . A t o l l s g e n e r a l l y p o s s e s s a l a r g e r e e f a r e a which i s e s s e n t i a l l y exposed a t low t i d e b u t submerged a t h i g h t i d e . I n t h e c a s e of Eniwetok t h e t o t a l d r y l a n d a t h i g h t i d e i s o n l y 2.5 m i 2 while a t low t i d e exposed l a n d (and t i d a l p o o l s ) covers some 34 m i 2
(!&nory
-,
e t a 11954).
This f o u r t e e n - f o l d i n c r e a s e i s t h e r e s u l t of a mean d i u r n a l t i d a l range of 3.9 f t . It i s r e a s o n a b l e t o expect t h a t t h e magni- t u d e of t h e a t o l l h e a t source would be s i g n i f i c a n t l y i n c r e a s e d t h e r e f o r e during t h o s e days when t h e low t i d e c o i n c i d e s w i t h t h e hour of maximum h e a t i n g . I n a d d i t i o n t o t h e o r d e r of magnitude d i f f e r e n c e i n exposed land a r e a t h e r e would be more shallow w a t e r and l e s s lagoon w a t e r exchange a t low t i d e .Following t h i s reasoning, t h e U. S. Coast and Geodetic Survey Tide Tables were examined f o r c a s e s of maximum o r minimum t i d e occurrence between t h e hours of 1200 and 1330
LMT
f o r Eniwetok. Such a n e v e n t w i l lbe r e f e r r e d t o a s e i t h e r a "high t i d e day" o r a "low t i d e day". The
d a t e s of occurrence a s w e l l a s t h e h e i g h t of t h e t i d e and i t s range during t h e previous s i x hours were recorded f o r t h e p e r i o d of record, June
1949
t o February
1959.
The h o u r l y s u r f a c e r e p o r t s were t h e n examined f o r t h e s e d a t e s and d a t a were recorded f o r 0700, 1000, and 1300 W. The recorded observa- t i o n s included v a l u e s of temperature, dew-point, low cloud amount and p r e c i p i t a t i o n occurrence.
The mean i n c r e a s e s of temperature and dew-point from 0700 t o 1300 h r s were computed on low t i d e days and on high t i d e days and t h e s e were
compared. It w a s hoped t h a t t h i s procedure would tend t o reduce t h e p o s s i b i l i t y t h a t any d i f f e r e n c e between t h e two s e t s of days could b e due t o chance s y n o p t i c i n f l u e n c e s . It might be expected t h a t on days when
t h e t i d e reached a minimum n e a r 1300 h r s t h a t t h e temperature (and p o s s i b l y . t h e dew-point a l s o ) would show g r e a t e r i n c r e a s e from e a r l y morning t o
1300 h r s . The a n a l y s i s i n f a c t r e v e a l e d no s i g n i f i c a n t d i f f e r e n c e between low and high t i d e days. The temperatures and dew-points showed mean
d i f f e r e n c e s of l e s s t h a n 0 . 0 5 ' ~ a s a r e s u l t of t i d e change. This r e s u l t i s not unexpected, however, s i n c e t h e t i d a l v a r i a t i o n w i l l have only a s l i g h t e f f e c t on t h e l e n g t h of a i r p a r c e l t r a j e c t o r y from w a t e r ' s edge t o thermometer s h e l t e r ( s e e F i g 1). The t o t a l h e a t t r a n s f e r between t h e p a r c e l and t h e s u r f a c e must be i n s i g n i f i c a n t l y d i f f e r e n t from low t o high t i d e s i t u a t i o n s .
This should n o t be t h e c a s e w i t h low cloud cover and p r e c i p i t a t i o n , however. These q u a n t i t i e s might be expected t o respond t o t h e a r e a
e f f e c t of t h e heat source and t o i n t e g r a t e t h e exposed reef increments over a l a r g e p a r t of t h e a t o l l .
The a n a l y s i s of p r e c i p i t a t i o n could not be made s a t i s f a c t o r i l y due t o t h e nature of t h e data. There were no hourly p r e c i p i t a t i o n amounts a v a i l a b l e , only occurrence versus non-occurrence. Furthermore, t h e l a t t e r had t o be taken from hourly " ~ i r w a y s " observations which r e p o r t weather only during a 3 minute segment of t h e hour. Thus, i n dealing with a small sample of days, t h e element of chance observations plays t o o l a r g e a r o l e t o allow s t a t i s t i c a l s i g n i f i c a n c e .
The amount of sky covered by low cloud f o r t h i s 3-minute period i s reported i n t e n t h s of t o t a l sky. This v a r i a b l e was c a r e f u l l y analyzed.
I n order t o f u r t h e r l i m i t t h e chance t h a t a few synoptic disturbances might approach t h e a t o l l i n t h e forenoon and give a random increase t o one o r t h e other s e t s of " t i d e days", values were compared a t 1300 and 1000 LNP on each day. With t i d a l maxima o r minima occurring near 1300 h r s on t h e s e days, 1000 h r s should represent t h e t i d a l node and t h e s e d a t a should t h u s have l i t t l e dependence upon t h e d i r e c t i o n of t i d a l change.
Those who have examined t i d a l records, however, w i l l r e a l i z e t h a t not all "high t i d e s " o r "low t i d e s " correspond t o a s i g n i f i c a n t change i n e l e v a t i o n of t h e s e a surface. This d i l u t i n g f a c t o r was reduced here by ranking t h e cases according t o t h e magnitude of t h e t i d a l deviation and s e l e c t i n g t h e t o p one t h i r d of each s e t of t i d e days s o ranked f o r f u r t h e r analys i s
.
The change i n low cloudiness from 1000 t o 1300 LNP was then recorded f o r low t i d e days and f o r high t i d e days and values averaged f o r each of t h e 1 2 months. The comparison by month appeared advisable because of t h e
possible existence of a seasonal trend in the background diurnal variation of low cloud cover. Table 1 summarizes the results of this analysis which utilizes data from June
1949
to December1958.
Entries are in tenths of sky cover.Influence of Oceanic Tide on Low Cloudiness
Month Jan Feb Mar A P ~ May June July A w Sept Oct Nov Dec TOTAL
High Tide Low Tide ANh
~ ~ ( ~ 3 - l ~ ) Nh(l3-l0) C O ~ . l-col . 2 NO. of Pairs
With the exception of May the values seem to indicate more cloud cover during afternoons with a high tide,although the mean cloud increase
(May included) is only
0.35
tenths of sky. The result is contrary to expectations. A two-tailed test of significance utilizing the Student'sI1 I1
t distribution shows no cause to accept this result as significantly
d i f f e r e n t from z e r o a t t h e
95%
l e v e l of confidence ( t h i s i s l a r g e l y due t o t h e adverse May v a l u e which survived a thorough rechecking). With t h e v a r i a n c e demonstrated i n t h e s e d a t a a d i f f e r e n c e a s l a r g e a s 0.35 might be expected about14%
of t h e time i n s i m i l a r samples from a population of d i f f e r e n c e s whose r e a l mean i s zero.The only conclusion t o be drawn i s t h a t t h e a n a l y s i s was unable t o show t h a t an o r d e r of magnitude change i n t h e exposed land s u r f a c e of t h i s a t o l l had any e f f e c t upon low-level cloud cover. This r e s u l t might be used t o argue t h a t t h e a t o l l i t s e l f has no i n f l u e n c e on low clouds. I n defense of proponents of t h e a l t e r n a t e hypothesis, however, it should be pointed out t h a t l e s s t h a n h a l f of t h e sky viewed from t h e observing s t a t i o n l i e s over t h e a t o l l and t h a t much of t h e extensive r e e f a r e a l i e s a c r o s s t h e lagoon ( ~ i g 1 ) . Furthermore it w i l l be observed t h a t t h e lagoon i t s e l f covers an a r e a (360 m i 2 ) which i s an o r d e r of magnitude l a r g e r t h a n t h e land exposed a t low t i d e . However, lagoon waters c e r t a i n l y provide a r e l a t i v e l y f e e b l e h e a t source when compared t o land near mid-day.
The conclusion reached h e r e i s compatible with r e p o r t s from meteorol- o g i s t s who have r e s i d e d on a t o l l s , i . e . t h a t t h e r e appears t o be no p r e f e r - e n t i a l l o c a t i o n by quadrant, f o r t r a d e cumulus build-ups. On t h e o t h e r hand it runs counter t o many s t o r i e s t h a t claim experienced polynesian n a v i g a t o r s could d i s t i n g u i s h t h e presence of t i n y i s l a n d s i n t h e d i s t a n c e by v i r t u e of t h e cloud d i s t r i b u t i o n . It must be s t r e s s e d h e r e t h a t t h e foregoing a n a l y s i s could only hope t o uncover a f a i r l y s i z a b l e e f f e c t observable from t h e a t o l l i t s e l f . It i s p o s s i b l e t h a t t h e d i s t u r b a n c e i n cloud o r g a n i z a t i o n i s f e l t p r i m a r i l y downstream from t h e a t o l l . Some
evidence i n f a v o r of t h i s conclusion i s found i n t h e s t u d y of d i u r n a l r a i n - f a l l v a r i a t i o n on Majuro A t o l l (page 35).
P a r t I1 : Diurnal V a r i a t i o n s .
General comments.
The punched card deck a v a i l a b l e f o r Eniwetok c o n s i s t e d of h o u r l y
" ~ i r w a y s " r e p o r t s f o r t h e p e r i o d from June 1949 t o February 1959.
S e v e r a l months i n t h i s p e r i o d were incomplete, however. There were
s c a t t e r e d periods when o n l y 3-hourly observations were recorded and o t h e r p e r i o d s when one o r more elements of t h e r e p o r t s were missing i r r e g u l a r l y . I n compiling d i u r n a l v a r i a t i o n s from t h i s d a t a f i l e using t h e IBM 650, c a r e was t a k e n t o a s s u r e accuracy and homogeneity'of record. The machine was programmed t o make elementary c o n s i s t e n c y checks on t h e d a t a and t o
exclude t h o s e days when more t h a n one observation was missing. Monthly mean h o u r l y v a l u e s were t h e n computed f o r each month f o r each of t h e following: s e a l e v e l p r e s s u r e , wind speed, zonal and meridional wind components, temperature, dew-point, wet bulb temperature, r e l a t i v e humid- i t y , low cloud amount and occurrence of p r e c i p i t a t i o n . Each monthly mean v a l u e r e p r e s e n t s a t l e a s t 200 days o r about
7
y e a r s of homogeneous d a t a .I n order t o f u r t h e r e l u c i d a t e t h e c h a r a c t e r of t h e d i u r n a l v a r i a t i o n s , harmonic a n a l y s e s were performed on t h e monthly and annual mean h o u r l y v a l u e s of p r e s s u r e , wind, temperature and humidity. The a n a l y s i s was
c a r r i e d t o f o u r harmonics f o r each v a r i a b l e according t o s t a n d a r d procedures (e. g. Panofsky and B r i e r , 1958). The v a l u e s of t h e s e harmonic components f o r t h e annual means a r e presented i n Table 2. The r e p r e s e n t a t i o n f o r t h e magnitude of t h e v a r i a b l e x at l o c a l mean s o l a r time ti ( i n h o u r s ) i s given by:
-
2n 2n 271x = x +
c1
cos [- ( t- t l ) l
+ C2c0s [- ( t- t 2 ) l
+ C cos [-(t- t 3 ) 1
24 1 2 3 8
+ C cos [- 2n ( t
-
t ) ] + H.H.. . .
4
6
4 (1)where
x
i s t h e mean d a i l y value of t h e v a r i a b l e , C1 t o Cj+ a r e t h e ampli- tudes of t h e f i r s t t o f o u r t h harmonics r e s p e c t i v e l y , t t o t4 a r e t h e1
r e s p e c t i v e phase hours of each harmonic, and H.H. represents t h e contribu- t i o n of t h e e i g h t higher order harmonics which a r e needed f o r a complete representation. If t h e observed mean hourly values of x a r e p l o t t e d and compared with t h e p l o t of t h e s i n g l e cosine curve given by t h e f i r s t harmonic i n ( l ) , t h e observed p o i n t s w i l l of course not a l l l i e exactly
on t h i s curve. A measure of t h e c o n t r i b u t i o n which each individual
harmonic makes toward reconstructing the observed curve i s given by form- ing t h e r a t i o of t h e variance of t h a t harmonic curve t o t h e variance of t h e meandiurnalcurve. If t h i s r a t i o i s multiplied by 100 we have t h e percent of t h e observed variance which i s "explained" by t h e given harmonic.
This information i s provided i n t h e row headed
"$v"
i n Table 2. The percent variance i s a d d i t i v e so t h a t when a l l 12 harmonics a r e u t i l i z e d ,With a l l meteorological v a r i a b l e s it i s found t h a t t h e d i u r n a l and semi-diurnal harmonics t o g e t h e r provide f o r most of t h e mean d a i l y v a r i a - t i o n of t h e v a r i a b l e . Higher harmonics g e n e r a l l y make increasingly
smaller contributions and t h e i r p h y s i c a l s i g n i f i c a n c e become increasingly more questionable. They a r e more and more l i k e l y t o be t h e r e f l e c t i o n of random e r r o r s i n t h e data.
c1
C2 C
3 C4
t 1 t2t3 t 4
%vl
%v2
%v3
%v4
TOTAL $V ANNUAL
MEAN . ~ .
Sea Level Pressure
0.39
m b s1.03
0.
og
0.02
4.53
h r s10.04 1.60 4.28 12.6%
86.6 0.6 0.04 99.9 1009.96
m b sTABL;E 2
Annual Harmonic Components of Diurnal Variations of Pressure, wind; Temperature and Humidity
E
Wind Component
0.10 k t s 0.20
0.03
0.02
7.11
h r s9-99 4.60 1.72 19.1%
73.4
1 . 2
0.7 94.4 12.65
k t sN
Wind Component
0.07
k t s0.18 0.03 0.03 22.29
h r s6.76 2.26 23.24 13 3%
78.5 1.6
1-
5 94.9
3-73
k t sA i r
Dew
Temperature Point
13.22
h r s13.26
h r s0.38 11.47
0.60 1.31
3.48 3.20
Wet
B u l b 1 . 0 1 ' ~
0.39 0.06 0.08 13.24
h r s11.98
1 . 0 1
3.34 86.1%
12.
g 0.3 0.6 99.9 76.54'~
Relative
Humidity
4.6%
1.4
0.2
0.3 1.23
h r s6.18 4.34 0.58 90.9%
8.4
0 . 1
0.5
99- 9
78.45%
The phase hour, ti, i s t o be i n t e r p r e t e d a s t h e f i r s t time on t h e
-
24 hour clock a t which t h e ith harmonic of t h a t v a r i a b l e reaches a maximum. Oviously t h e ith harmonic has i maxima and i minima over t h e 24-hour day. The hours a r e given i n l o c a l mean s o l a r time (LST minus
1.18
h r s ) . A l l susequent r e f e r e n c e s t o time i n t h i s r e p o r t w i l l be l o c a l mean time (LMT) unless otherwise noted.
Consideration of t h e s i g n i f i c a n c e of t h e harmonics i n Table 2 w i l l be included i n t h e following d i s c u s s i o n s of t h e d i u r n a l v a r i a t i o n s of i n d i v i d u a l meteorological elements.
Sea l e v e l p r e s s u r e
Both t h e d e s c r i p t i v e and t h e o r e t i c a l a s p e c t s of t h e mean d i u r n a l v a r i a t i o n of atmospheric p r e s s u r e have been s t u d i e d e x t e n s i v e l y f o r n e a r l y 200 years. The most r e c e n t survey of t h i s problem i s probably given by S i e b e r t (1961). It was e a r l y recognized t h a t t h e s e v a r i a t i o n s were of l a r g e r amplitude i n t h e t r o p i c s and were more e a s i l y s t u d i e d a t t h e s e l a t i t u d e s where synoptic p r e s s u r e disturbances were g e n e r a l l y small and i n f r e q u e n t . S t i l l t h e r e e x i s t some unanswered questions o r a t l e a s t some weak hypotheses concerning s e v e r a l f a c e t s of t h e s u r f a c e p r e s s u r e o s c i l l a t i o n s . The r e s u l t s of an a n a l y s i s of t h e mean d i u r n a l p r e s s u r e v a r i a t i o n a r e presented h e r e i n some d e t a i l p a r t l y a s a d a t a c o n t r i b u t i o n t o t h e g e n e r a l d e s c r i p t i v e problem of atmospheric t i d e s but a l s o a s
supporting information f o r t h e following d i s c u s s i o n of d i u r n a l wind v a r i a - t ions.
The semi-diurnal component of t h e atmospheric t i d e s has received t h e most concentrated a t t e n t i o n and i t s d e s c r i p t i o n has achieved t h e most
Jan
Fe b
Mar
Jun
July
Fig 2. Mean monthly curves of diurnal variation of surface pressure at Eniwetok.
Values are expressed as deviations from the monthly mean pressure in millibars.
Time of day is local mean time.
u n i v e r s a l agreement. The d i u r n a l o s c i l l a t i o n i s c o n s i s t e n t l y weaker, more s u s c e p t i b l e t o l o c a l influences (land-sea breeze, a l t i t u d e , cloud cover, e t c . ), and l e s s s t a b l e with respect t o i t s seasonal f l u c t u a t i o n s . Table 3 d e p i c t s t h e seasonal t r e n d of t h e f i r s t t h r e e harmonic t i d a l components of pressure a t Eniwetok, while Fig 2 p r e s e n t s t h e observed mean monthly c k e s .
TABLE 3
Monthly Mean 24-, 12-, and 8-hourly Pressure O s c i l l a t i o n s .
Jan Feb Mar Apr May June July Aug
Sept Oct Nov Dec
The d i u r n a l component of t h e atmospheric t i d e s i s a g l o b a l
phenomenon which i s due p r i m a r i l y t o t h e heating c y c l e of t h e s o l a r day.
The d a i l y migration of t h i s pressure wave around t h e e a r t h i s g r e a t l y d i s t o r t e d by l o c a l h e a t t r a n s f e r s but should be i d e n t i f i a b l e i n i t s fundamental form a t an a t o l l s t a t i o n i n mid-ocean. No s a t i s f a c t o r y
theoretical treatment of this oscillation has been given and no global description has been attempted to the author's knowledge.
The hypothetical picture of the global diurnal pressure wave given, for example, by Humphreys
(1940,
p 243) and Godske-
et a1(1957,
p589)
calls for a single progressive wave moving with the speed of the sun from east to west with maximum pressure observed at the coldest hours and minimum pressure in late afternoon. Observations on the U. S. mainland seem to support this hypothesis. However, recent work on Atlantic ship and island data (~aurwitz,
1955;
Rosenthal and Barn,1956;
Harris 9-et a1 1962) give hours of maximum pressure for the diurnal component ranging from about 1000 LST in the eastern to 2300 LST in the western Atlantic.Chapman
(1951,
p 522) on the other hand states that the diurnal component is not a world wide oscillation, yet paradoxically indicates that where unaffected by local peculiarities this component would have a maximum at local noon.The phase hour of the diurnal tide at Eniwetok is about O5OO and thus seems to agree with the deductions fromthe continental data. The amplitude of
0.4
mb is, however, about twice the value suggested by Godske et a1(1957)
as appropriate to "mid-pacific pinpoint islands".A hasty review or the literature on this subject leads one to suspect that the observations of the diurnal pressure wave may not be compatible with the hypothesis of a single progressive wave. There may
I
well be a standing wave component which varies with universal time. There would seem to be a strong need for clarification of the nature of this fundamental atmospheric oscillation.
The seasonal v a r i a t i o n of t h e d i u r n a l component of t h e s o l a r t i d e appears (from Table 3) t o be q u i t e r e g u l a r . Largest amplitude occurs i n l a t e w i n t e r a s s o c i a t e d with l a t e s t phase hour. Minimum amplitude and e a r l i e s t phase hour a r e found i n l a t e summer. This r e g u l a r i t y i n season- a l t r e n d i s unexpected i n view of o t h e r published r e s u l t s ( e . g. Rosenthal and Baum,
1956).
Furthermore t h e r e seems t o be a g e n e r a l consensus of opinion i n t h e l i t e r a t u r e t h a t t h e g r e a t e s t amplitude should be found during t h e warmest months.There i s g r e a t e r uniformity of r e s u l t s and hypotheses concerning t h e semi-diurnal component of t h e s o l a r t i d e . Hauywitz
(1956)
g i v e s t h e most r e c e n t g l o b a l r e p r e s e n t a t i o n of t h i s o s c i l l a t i o n . The annual mean v a l u e of t h i s component i n Table 2 d i f f e r s by l e s s than .001 mbs i namplitude and 30 minutes i n phase hour from values computed from h i s f u n c t i o n a l r e p r e s e n t a t i o n f o r t h i s l a t i t u d e and longitude. Haurwitz and Sepulveda (1957) have s t u d i e d t h e seasonal v a r i a t i o n of t h i s component.
The seasonal t r e n d deduced by t h e s e a u t h o r s i s s t r o n g l y supported by t h e r e s u l t s of Table 3. They hypothesize maximum amplitude i n March and minimum i n J u l y , a s observed. They f u r t h e r expect t h e e a r l i e s t maximum t o occur i n w i n t e r and l a t e s t phase hour t o be found i n s m e r , again i n p e r f e c t agreement with f i n d i n g s a t ~ n i w e t o k .
The 8-hourly component of t h e atmospheric t i d e has received consid- e r a b l e a t t e n t i o n , and a p l a n e t a r y r e p r e s e n t a t i o n of t h i s o s c i l l a t i o n has been given by S i e b e r t (1957). The Eniwetok d a t a show no s i g n i f i c a n t disagreement w i t h t h e s e r e s u l t s . One of t h e i n t e r e s t i n g f a c e t s of t h i s o s c i l l a t i o n i s i t s near r e v e r s a l of phase from swnmer t o winter. This i s a g e n e r a l l y accepted f e a t u r e of t h i s harmonic and i s demonstrated i n Table 3.
Surface Wind
The d i u r n a l v a r i a t i o n of t h e wind speed over most land a r e a s i s l a r g e , c o n s i s t e n t , and e a s i l y r a t i o n a l i z e d . Winds tend t o be s t r o n g e s t during hours of maximum s o l a r warming and weakest during t h e c o o l e a r l y morning hours. The mechanism can be a s c r i b e d t o t h e d i u r n a l change of
s t a b i l i t y of t h e lowest a i r s t r a t a which a f f e c t s t h e downward t r a n s f e r of momentum from t h e s t r o n g e r wind flows a l o f t . Diurnal speed v a r i a t i o n s over t h e sea appear t o be t h e s u b j e c t of some d i f f e r e n c e of opinion i n t h e l i t e r a t u r e . Most textbooks of meteorology and climatology supplement t h e explanation of t h e c o n t i n e n t a l s i t u a t i o n with t h e statement t h a t s i n c e d i u r n a l s t a b i l i t y changes a r e smaller over t h e oceans t h e amplitude of t h e speed v a r i a t i o n i s reduced. One i s s t i l l l e d t o expect some speed i n c r e a s e during t h e day. Bartrum
(1957)
f o r example, found a pronounced d i u r n a l speed m a x i m u m a t noon a t Bermuda. The mean d i u r n a l range was appraximately 2 mph. On t h e o t h e r hand B m t (1952) quotes Galle a s r e p o r t i n g t h a t a t l e a s t during months May t o October t h e m a x i m u m v e l o c i t y of t h e SE t r a d e s of t h e I n d i a n Ocean occurs during t h e night hours.R i e h l e t a 1
(1951)
i n a study of t h e NE t r a d e s between C a l i f o r n i a and Hawaii found an i n c r e a s e i n wind speed from noon t o midnight. I n t h i s l a t t e r study only two observation hours were compared, 0100 and 1300 INT.The speeds were higher throughout t h e subcloud and cloud l a y e r s a t 0100 h r s with d i f f e r e n c e s a t t h e s u r f a c e of about
1.5
mph, reaching a maximum of n e a r l y4
mph near cloud base. No explanation f o r t h e s e observations was advanced. Riehl(1954)
quotes work by Meinardus a s w e l l a s t h a t j u s t mentioned t o confirm t h e e x i s t e n c e of d i u r n a l wind v a r i a t i o n s a t sea.Texts i n oceanography, on t h e o t h e r hand, f r e q u e n t l y give t h e i q r e s s i o n
that the wind does not vary diurnally on the open ocean.
The mean hourly wind speed without regard to direction at Eniwetok is depicted in Fig
3
for a period of record of 2957 days. The striking similarity of this curve to that for the diurnal pressure variation (Fig 2) is immediately apparent. There can be no doubt that the atmospheric tides are the controlling factor for diurnal variations of surface wind on this atoll. The primary component here, as in the barometric oscillation, is the semi-diurnal.The theory for the response of the wind to the semi-diurnal pressure wave has been given as early as l9lO by Gold and host recently examined in detail by Stolov
(1955).
According to this development the winds are antibaric, i.e. they blow anticyclonically around the two low pressure centers and cyclonically around the two high centers. The four pressure cells are strung, equally-spaced, around the equator. Thus at Eniwetok the tidal wind should be from the east as the high pressure cell passes at 1000 hrs, from the south at 1300 hrs, from the west at1600
hrs as the pressure minimum arrives, from the north at l9OO hrs, etc. Since the prevailing wind is ENE with high steadiness, the tidal winds will account for the maximum speed near 1000 hrs (and 2200 hrs) and minimum near1600
hrs(and 0400 hrs).
Godske
-
et a1(1957,
p590)
argue that the winds produced by the diurnal pressure wave should also be antibaric, at least between30
0N
and30°~. This would explain, then, the close similarity between the pressure and wind curves; each component contributes in the same sense -Lo the tidal winds.
0 2 4 6 8 10 12 14 16 18 20 22 24 LMT
I
I I I 1 I I 1 I I 1 I1
F i g 3. Mean d i u r n a l v a r i a t i o n of speed of t h e s u r f a c e wind a t Eniwetok. Curve shows 3-term running mean; d o t s a r e a c t u a l h o u r l y v a l u e s . Dashed l i n e shows mean a n n u a l v a l u e .
;. N o r t h Wind
F i g
4.
Mean d i u r n a l v a r i a t i o n of s u r f a c e p r e s s u r e and of E a s t and North cornpo- n e n t s of t h e s u r f a c e wind a t Eniwetok. Heavy s o l i d l i n e s connect a c t u a l h o u r l y v a l u e s . Thin s o l i d c u r v e s a r e lSt harmonics of t h e d i u r n a l v a r i a t i o n .I n o r d e r t o examine more c r i t i c a l l y t h e r e l a t i o n s h i p between p r e s s u r e and winds i n the atmospheric t i d e s problem, a harmonic a n a l y s i s was made of t h e hourly mean wind v e c t o r . The d a t a were not i d e a l f o r t h i s purpose s i n c e wind d i r e c t i o n was r e p o r t e d t o o n l y
16
p o i n t s of t h e compass. This decreases t h e s e n s i t i v i t y of t h e d a t a somewhat but t h e period of record i s probably long enough (2715 days) t o surmount t h i s d i f f i c u l t y .The d i u r n a l curves of observed e a s t ( u ) and north ( v ) components along with s e a l e v e l p r e s s u r e ( P ) a r e given i n Fig
4
t o g e t h e r with t h e 24-hour harmonics computed therefrom. It i s of i n t e r e s t t o compare both t h e 24- and 12-hour harmonics (from Table 2 ) w i t h . t h o s e expected from t h e o r y f o r t h e l a t i t u d e and l o n g i t u d e of Eniwetok. This done i n Table4.
TABLE
4
Comparison of Observed and Predicted A i r Tides.
Diurnal Component
-
Semi-diurnal ComponentObserved Godske e t a 1 Observed S t olov
u (cm/sec)
-
+ 5.0 unknown-
+ 1 0 . 3-
+ 22.8v (cm/sec)
-
+ 3.5 unknown-
+ 9.3- +
10.6tu ( h d
7.11 4.53 9.99 9.81
tv ( h r s ) 22.29 22.53
6.76
6.81P (mbs)
-
+ 0.39-
+ 0.2 0-
+ 1.03-
+ 0.93tp ( h d
4-53 -
IV5
a.m. 10.049.81
Considering f i r s t t h e semi-diurnal component it i s seen t h a t t h e
agreement i s v e r y good w i t h regard t o phase but t h a t t h e p r e d i c t e d amplitude of t h e t i d a l motion i s t o o high. This may perhaps p a r t l y b e d u e t o f r i c t - i o n a l r e t a r d a t i o n which was not included i n S t o l o v ' s development o r t o a f a u l t y r e p r e s e n t a t i o n of t h e amplitude of t h e p r e s s u r e wave a t t h e s e
l a t i t u d e s . Stolov u t i l i z e d Simpson's formulation composed i n
1918.
The p r e d i c t e d v a l u e of 0.93 mbs p r e s s u r e amplitude i s based on t h i s expression.The d i u r n a l component, a s mentioned e a r l i e r i s much more p o o r l y under- stood. There i s , however, s u f f i c i e n t agreement with t h e i d e a s expressed by Godske e t a 1 (1957) t o l e n d s t r o n g support t o t h e i d e a t h a t t h i s v a r i a - t i o n i s due p r i m a r i l y , i f not completely, t o a g l o b a l t i d a l phenomenon.
I f t h e r e e x i s t s any r e s i d u a l d i u r n a l wind v a r i a t i o n not due t o a i r t i d e s , it must indeed be small. Close examination of t h e f i r s t two columns of Table
4
w i l l r e v e a l , however, some argument f o r t h e r e a l i t y of such asmall d i u r n a l e f f e c t . It w i l l be noted t h a t t h e phase hour of t h e v compo- nent follows e x p e c t a t i o n v e r y c l o s e l y while t h a t f o r t h e u component i s advanced by more t h a n two hours. For t h e sake of argument we may suppose t h a t t h e wind speed a t t h e s u r f a c e i n c r e a s e s s l i g h t l y toward mid-day a s it does over land. Since winds a r e predominantly e a s t e r l y t h i s e f f e c t would be f e l t i n t h e u component b u t h a r d l y a t a l l i n t h e v. The e f f e c t would be e s s e n t i a l l y t o superimpose a second d a i l y c o s i n e curve which would tend t o p u l l t h e e a r l y morning m a x i m u m of u toward noon and i n c r e a s e
it amplitude somewhat. This s h i f t r e l a t i v e t o t h e p r e s s u r e wave i s observed ( s e e F i g
4 ) .
C e r t a i n l y , t h e d a t a do not warrant d e f i n i t i v e conclusions from such minute e f f e c t s . It does seem p l a u s i b l e though t h a t t h e " l o c a l wind" v a r i a t i o n , a p a r t from a i r t i d e s , i s l i m i t e d t o a speed i n c r e a s e with a maximum near noon of amplitude about 3 cm sec -1 o r about .07 k t s . There i s , of course, no way of knowing whether t h i s , i f r e a l i s t i c , i s r e p r e s e n t a - t i v e of t h e a t o l l only o r of t h e open ocean. A f t e r c o n s i d e r a t i o n ofs t a b i l i t y v a r i a t i o n s i n t h e lower a i r over t h e open ocean it becomes more reasonable t o a s c r i b e t h i s e f f e c t t o t h e a t o l l .
Before l e a v i n g t h e s u b j e c t of atmospheric t i d e s it might be of i n t e r - e s t t o consider b r i e f l y t h e seasonal t r e n d of t h e wind v a r i a t i o n t o see how c l o s e l y it agrees with t h a t of p r e s s u r e .
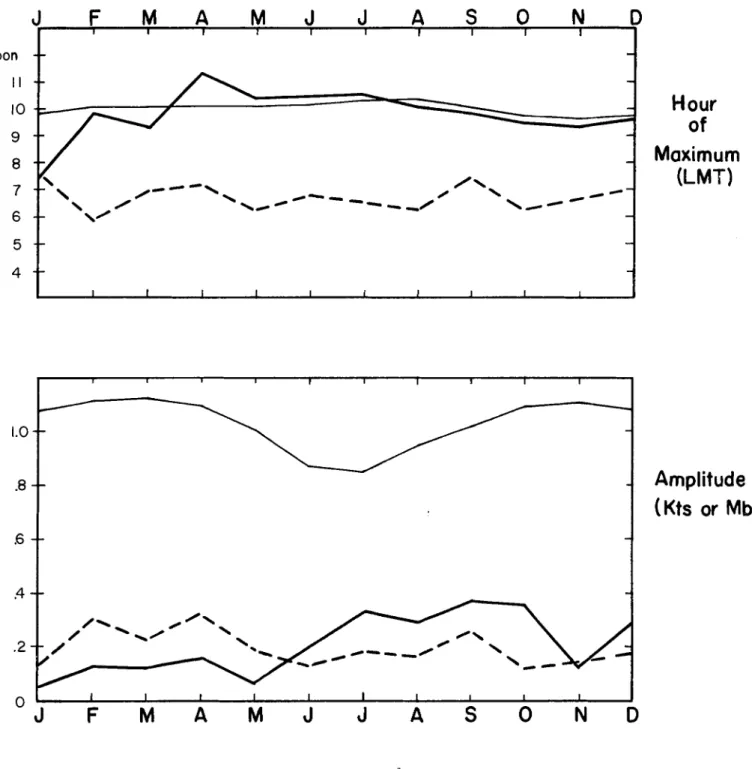
F i g
5
d e p i c t s t h e s e a s o n a l t r e n d of both t h e amplitude and phase hour of t h e lSt harmonic of p r e s s u r e and wind components. A v e r y curiousf e a t u r e p r e s e n t s i t s e l f here. The phase hour of p r e s s u r e v a r i e s s l i g h t l y b u t r e g u l a r l y a s noted e a r l i e r . The phase hours of t h e u and v components, however, show a p e c u l i a r tendency t o move s t e a d i l y around t h e clock ( i n opposite d i r e c t i o n s ) with t h e seasons. The f e a t u r e may q u i t e l i k e l y be spurious. I f it i s r e a l , t h e explanation f o r it escapes t h e w r i t e r . The amplitude v a r i a t i o n does demonstrate t h a t a c e r t a i n degree of randomness i s p r e s e n t .
F i g
6
gives a p r e s e n t a t i o n s i m i l a r t o t h a t of Fig5
f o r t h e semi- d i u r n a l harmonic. Much g r e a t e r correspondence i s demonstrated herebetween t h e t h r e e v a r i a b l e s , and t h e t h e o r y of atmospheric t i d e s i s q u i t e w e l l v e r i f i e d .
Low cloudiness
The g r e a t d i f f i c u l t y of securing a c c u r a t e observations of middle and high clouds i s w e l l known. The s i t u a t i o n i s not helped a t a l l by t h e prevalence of opinion ( p a r t i c u l a r l y i n t h e 1 9 4 0 ' s ) t h a t t h e t r o p i c a l sky i s u s u a l l y covered by a v e i l of c i r r o s t r a t u s
--
whether o r not it cana c t u a l l y be seen. Furthermore, observing high cloud a t n i g h t i s n o t o r i o u s - l y d i f f i c u l t . For t h e s e reasons,taken t o g e t h e r with t h e o b j e c t i v e of
a s s e s s i n g t h e a t o l l i n f l u e n c e , only low cloud d a t a a r e examined i n t h i s r e p o r t .
J F M A M J J A S O N D
I I I I I I I I I 1
Noon
-- -
/ /
-
4--
2--
-
Mid.
-- -
-
-
-
- -
Noon
-- 1
1 -
1 I I I I I I I L I
Hour of Maximum
(LMT)
I I I I I I
J
I1
F M A M J J A S O N D
F i g
5 .
S e a s o n a l t r e n d of a m p l i t u d e and phase hour of t h e lSt harmonic of p r e s s u r e and wind components a t Eniwetok. Heavys o l i d c u r v e s d e p i c t E a s t wind component, dashed c u r v e s r e f e r t o North wind component, and t h i n s o l i d c u r v e s r e f e r t o p r e s s u r e .
J F M A M J J A S 0 N D
I I I
Noon
t 1
Hour of Maximum
(LMT)
I I I I I I I I I
I
C
1
-- - -
-
-
-
-
/
d
0
-
J F M A M J J A S O N D
Fig
6.
Same as Fig5
except for the 2nd harmonic of pressure and wind.
The same p r e c a u t i o n s taken w i t h t h e processing of o t h e r v a r i a b l e s were followed with t h e cloud a n a l y s i s , r e s u l t i n g i n t h e s e l e c t i o n of
2719 days of homogeneous data. No d i s t i n c t i o n was made between cloud types o r cloud h e i g h t s provided t h e y were c l a s s i f i e d a s s t r a t u s , s t r a t o - cumulus, cwnulus, o r cumulonimbus. The overwhelming m a j o r i t y of low cloud t y p e s r e p o r t e d , however, was cwnulus w i t h bases a t about
1800
f t . When- ever low clouds were r e p o r t e d a t s e v e r a l l e v e l s t h e amount reported under a c o l m t i t l e d "swmnary amount" was recorded. This l a t t e r v a l u e g i v e s t h e decimal cover by a l l low cloud.An a n a l y s i s of t h e seasonal t r e n d of t h e d i u r n a l v a r i a t i o n of c l o u d i - ness i s given i n F i g 7. The i s o p l e t h s a r e based upon hourly values of low cloud amount expressed a s percent d e v i a t i o n f rom t h e i n d i v i d u a l monthly mean. Monthly mean v a l u e s v a r y l i t t l e throughout t h e year, having a
m a x i m u m of 3.2 t e n t h s low cloud cover i n May and minimum of
2.8
i n Sept- ember.F i g 7 demonstrates some consistency i n t h e d i u r n a l v a r i a t i o n through- out t h e year. Each month shows an i n c r e a s e i n low cloud from midnight o r e a r l i e r through t h e e a r l y morning hours. This f e a t u r e i s undoubtedly r e a l . The only d i s t i n c t seasonal t r e n d i s t h e tendency f o r an afternoon maximum i n cloudiness t o develop during t h e summer months, J u l y through November. These months encompass t h e season of weakest t r a d e s , maximum s e a s u r f ace temperatures, and g r e a t e s t i n s t a b i l i t y i n t h e lower atmosphere.
It i s p o s s i b l e t h a t t h e afternoon maximwn during t h i s season i s brought about by t h e increased frequency of calms o r l i g h t winds which r e s u l t i n g r e a t e r h e a t i n g of t h e s u r f a c e waters during e a r l y afternoon. The a t o l l h e a t source would be expected t o have i t s maximum e f f e c t under t h e same
circumstances s o t h a t t h e two a r e d i f f i c u l t t o s e p a r a t e ; The r e s u l t s of t h e a n a l y s i s r e p o r t e d i n P a r t I a r e probably not s u f f i c i e n t l y s e n s i t i v e t o uncover such s l i g h t v a r i a t i o n s of cloud amount. However, resumes of oceanographic c r u i s e s o c c a s i o n a l l y i n d i c a t e a secondary maximum a f t e r noon ( e. g. Garstang,
1958).
The main f e a t u r e s of F i g 7 a r e q u i t e evident i n F i g
9
which d e p i c t s t h e annual mean d i u r n a l v a r i a t i o n curve. The d a i l y range of c l o u d i n e s si s seen t o be q u i t e small, 10-12% of t h e mean o r 3.7% of t o t a l sky. The primary c h a r a c t e r i s t i c of t h e curve i s undoubtedly t h e pronounced maximum a t about 0700 and minimum near 2200 h r s . The small secondary maximum
j u s t a f t e r noon i s t h e c o n t r i b u t i o n of t h e weak t r a d e season discussed i n t h e previous paragraph.
There appears t o be g e n e r a l agreement i n t h e l i t e r a t u r e concerning t h e t e n d e n c y t o w a r d maximum low c l o u d i n e s s over oceans during t h e e a r l y morning hours although d e t a i l e d s t u d i e s of t h i s p o i n t a r e v e r y few.
R i e h l
(1947)
i n v e s t i g a t e d d a t a f o r 920 observing days from t h r e e s h i p s t a t i o n s near 3 5 ' ~ i n t h e A t l a n t i c Ocean. Using :-hourly observations only, he found t h e d i u r n a l v a r i a t i o n of low cloud t o be s i m i l a r a t each s h i p with a maximum a t 0600 h r s (3.4 t e n t h s ) and minimum a t 2100 h r s(3.2 t e n t h s ) . These r e s u l t s show remarkable agreement with t h o s e reported here.
These r e s u l t s may be s a i d t o support t h e conclusions from P a r t I concerning t h e absence of a s i g n i f i c a n t i n f l u e n c e of t h e a t o l l upon low cloudiness. I f t h e d i u r n a l v a r i a t i o n of cloud o v e r t h e a t o l l d i f f e r s n e g l i g i b l y from t h e v a r i a t i o n observed a t a s h i p s t a t i o n , one i s l e d t o b e l i e v e t h a t t h e i n f l u e n c e s of t h e two observing platforms d i f f e r
n e g l i g i b l y . Again, c a u t i o n must be taken t o admit t h e p o s s i b i l i t y of a systematic i n f l u e n c e which does n o t r e a c t t o t h e d a i l y h e a t i n g cycle. It seems c l e a r , however, t h a t textbook statementson t h e s u b j e c t such a s ( ~ i e h l ,
1954,
p 111): " ~ v e n a t o l l s have a d e f i n i t e e f f e c t on t h e l o c a l cloud s t r u c t u r e and i t s d i u r n a l course", do not a p p l y a t Eniwetok.I f t h e r e can be s a i d t o be some consensus of opinion concerning t h e c h a r a c t e r of t h e d i u r n a l v a r i a t i o n of low cloud over t h e sea, t h e r e i s y e t l i t t l e evidence of agreement on i t s cause. A d i s c u s s i o n of hypotheses w i l l be postponed u n t i l t h e n a t u r e of t h e hourly t r e n d of p r e c i p i t a t i o n i s
explored. It seems reasonable t o consider t h e e x p l a n a t i o n of t h e s e two f e a t u r e s i n tandem.
P r e c i p i t a t i o n
The r e a l i t y of t h e o f t - r e p o r t e d n o c t u r n a l r a i n f a l l maximum over t h e ocean has never been f u l l y i n v e s t i g a t e d . The o b j e c t i o n r a i s e d a g a i n s t most published records which demonstrate t h e e x i s t e n c e of such a f e a t u r e
i s t h a t p o s s i b l e c o a s t a l o r i s l a n d i n f l u e n c e s have not been excluded.
C e r t a i n l y , most of t h e long term d a t a on oceanic p r e c i p i t a t i o n has been gathered on c o n t i n e n t a l c o a s t l i n e s o r on r a t h e r l a r g e mountainous i s l a n d s . I n e i t h e r case it i s d i f f i c u l t t o e v a l u a t e t h e e f f e c t s of land-sea breeze regimes, orography, and mountain-valley winds upon t h e "undisturbed"
p r e c i p i t a t i o n p a t t e r n . Nevertheless, it i s common p r a c t i c e among c l i m a t - o l o g i s t s t o d i s t i n g u i s h between maritime and c o n t i n e n t a l p r e c i p i t a t i o n regimes according t o whether t h e d i u r n a l maximum occurs by n i g h t o r by day. The q u e s t i o n remains, however: i s t h e "maritime regime" r e p r e s e n t - a t i v e of open ocean o r only of c o a s t s ? Shipboard observations of p r e c i p - i t a t i o n a r e g e n e r a l l y confined t o occurrence v e r s u s non-occurrence.
I
1 1 I I 1 LF i g
9.
Annual mean d i u r n a l v a r i a t i o n of low cloud amount a t Eniwetok.D e v i a t i o n s a r e i n p e r c e n t o f a n n u a l mean ( 2 . 9 3 t e n t h s ) . S o l i d c u r v e i s 3-term r u n n i n g mean of h o u r l y v a l u e s (heavy d o t s ) .
F i g 1 0 . Same as F i g
9
b u t r e f e r r i n g t o p r e c i p i t a t i o n o c c u r r e n c e a t Eniwetok.F i g 11. Same as F i g 1 0 b u t cornposited from p r e c i p i t a t i o n o c c u r r e n c e a t Wake, Kwajalein, Majuro, Johnston, Marcus, Canton, C h r i s t m a s , Fanning and Palmyra I s l a n d s .