Of course, not everything in my life in the last few years has been solely about my PhD. Every lesson you have taught me over the past decade will continue to shape my thinking for the rest of my life.
ABSTRACT
For this we turn to information theoretic concepts of maximal mutual information (otherwise known as channel capacity) between the state of the environment and the gene expression response of bacterial cells. Finally, we compare our predictions of the maximum amount of information—measured in bits—that cells can collect with single-cell derivations of this amount.
PUBLISHED CONTENT AND CONTRIBUTIONS
126 4.6 Phenotypic properties of induction with several specific binding sites 127 4.7 Phenotypic properties of induction with one specific site and. 219 5.10 Comparison of equilibrium and kinetic inducer titration predictions220 5.11 Comparison of predicted protein noise between single and a.
LIST OF TABLES
FROM BIO TO BIT: HOW DO CELLS SENSE THE WORLD AROUND THEM?
Introduction
Thus, the physical details of how organisms perceive the environment must be determined—that is, gathering information about the state of the environment, encoding such information in a particular form within their physical boundaries, and acting on it. information—is the core of cutting-edge research in biophysics [7]. In physics, calling something a hydrogen atom X means that, for the field of study X, this "something" represents a system that is simple enough to lend itself to analytical models that can be solved by standard mathematical methods, but rich enough to capture the general characteristics of the phenomena .
Gene Regulation as a Physics 101 Problem
Therefore, we can define as our "macrostate" the particular configuration of the receptor as shown schematically in Fig. For the adjusted case, we have the probability that the promoter is bound by an RNAP takes the form
Entropy, Information, and the Math Behind the Bit
Given that the uncertainty is additive, for each of the routes, our total uncertainty is given by What we just demonstrated is that the functional form for the uncertainty metric we scale as the logarithm of the number of possible characters in our alphabet.
![Figure 1.7: Abstract communication system. (A) Reproduced from Shannon’s original seminal work [27]](https://thumb-ap.123doks.com/thumbv2/123dok/10412290.0/54.918.147.777.122.608/figure-abstract-communication-reproduced-shannon-original-seminal-work.webp)
TUNING TRANSCRIPTIONAL REGULATION THROUGH SIGNALING: A PREDICTIVE THEORY OF ALLOSTERIC
INDUCTION
Abstract
Introduction
Specifically, we study a simple repression motif—a widespread bacterial genetic regulatory architecture in which transcription factor binding impedes RNA polymerase binding, thereby inhibiting transcription initiation. The work presented here fully demonstrates that one extremely compact set of parameters can be self-consistently and predictively applied to a variety of regulatory situations, including simple repression on a chromosome, cases in which decoy repressor binding sites are placed on plasmids, cases where multiple genes competing for the same regulatory mechanism, examples involving multiple repressor binding sites leading to DNA looping, and induction by signaling. Thus, rather than viewing the behavior of each circuit as the cause of its unique input-output response, the MWC model provides a means of characterizing these seemingly diverse behaviors using a single unified framework governed by a small set of parameters.
Results
Instead, we measure the change in gene expression due to the presence of the repressor. Error bars for the experimental data show the standard error of the mean (eight or more replicates). In other words, what trade-offs between the system's parameters will lead to the same average cellular output.

Discussion
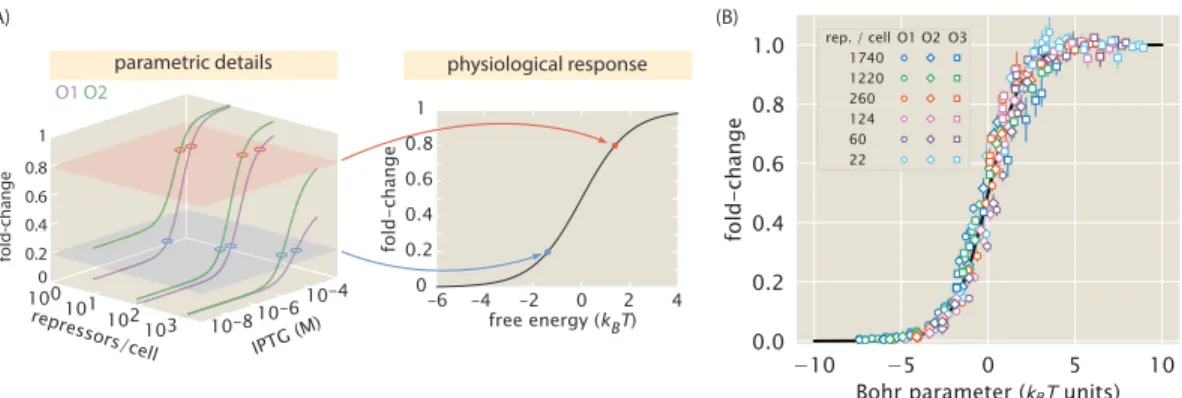
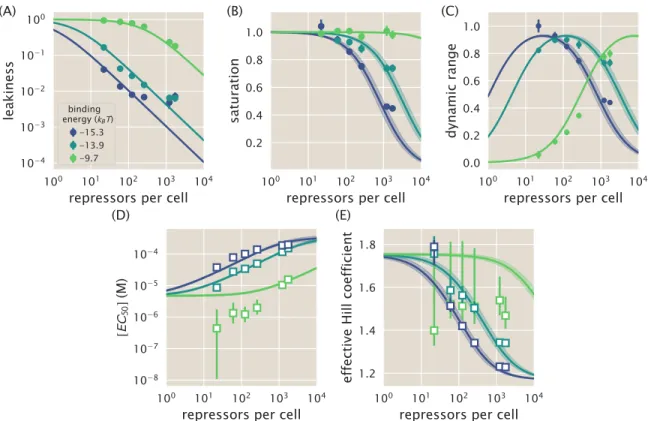
In addition to observing changes in fold change as a function of effector concentration, our use of the MWC model allows us to predict the values of explicit key parameters of induction curves, namely leakage, saturation, dynamic range [EC50] and effective Hill coefficient. We can consistently accurately predict leakage, saturation and dynamic range for each strain. In particular, we have shown that our model for the fold change can be rewritten in terms of the free energy equation Eq.
Materials & Methods
2.14, we assume that the experimental fold change for the current date is given the parameters of the shape. If we assume that these(i) errors are normally distributed with mean zero and standard deviation σ, the probability of the data given the parameters P(D| KA,KI,σ) is of the form. All the data used in this work and all relevant code can be found at this dedicated website.
FIRST-PRINCIPLES PREDICTION OF THE INFORMATION PROCESSING CAPACITY OF A SIMPLE GENETIC CIRCUIT
Abstract
Introduction
This question is at the heart of understanding the precision of the cellular response to environmental signals. From an environmental input (inducer molecule concentration) to a phenotypic output (protein expression level), cellular signaling systems can be modeled as noisy communication channels. B) We treat the cellular response to an external stimulus as a Bayesian inference of the state of the environment. Because the phenotype (protein level) serves as the internal representation of the environmental state (inducer concentration), the probability that a cell is in a specific environment given this internal representation P(c | p) is a function of the probability of the answer given the environmental status P(p | c). C) The accuracy of environmental state inference depends on how well cells can resolve various inputs.

Results
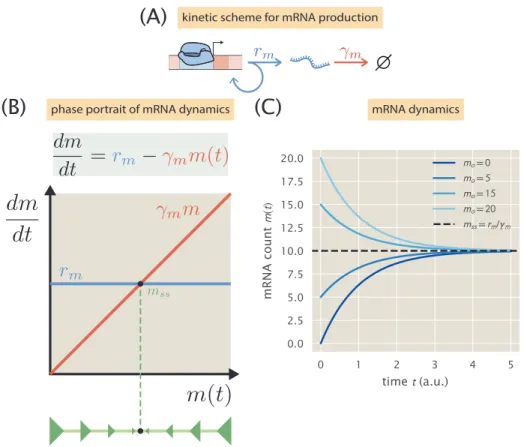
The repressor rate is assumed to be of the form k(onr) = ko[R] where ko is a diffusion-limited rate and [R] is the concentration of active repressor in the cell [84]. 3.3 (B) shows an example corresponding to the average mRNA level (upper panel) and the average protein level (lower panel) for the case of the unregulated promoter. Cells go through part of the cell cycle with a single copy of the promoter (light brown) and the rest of the cell cycle with two copies (light yellow).

Discussion
A kinetic treatment of the system brings with it greater predictive power compared to the equilibrium picture. This optimal combination of parameters is a direct consequence of the fact that the LacI repressor cannot be completely deactivated [113]. Each concentration of IPTG was derived from a single stock preparation stored in 100-fold concentrated aliquots.
SUPPORTING INFORMATION FOR TUNING
TRANSCRIPTIONAL REGULATION THROUGH SIGNALING: A PREDICTIVE THEORY OF ALLOSTERIC INDUCTION
Abstract
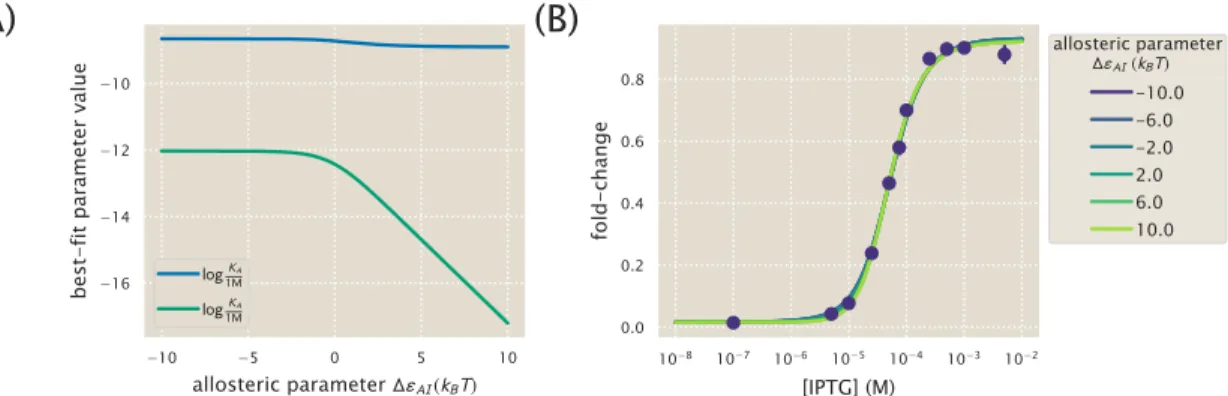
Inferring Allosteric Parameters from Previous Data
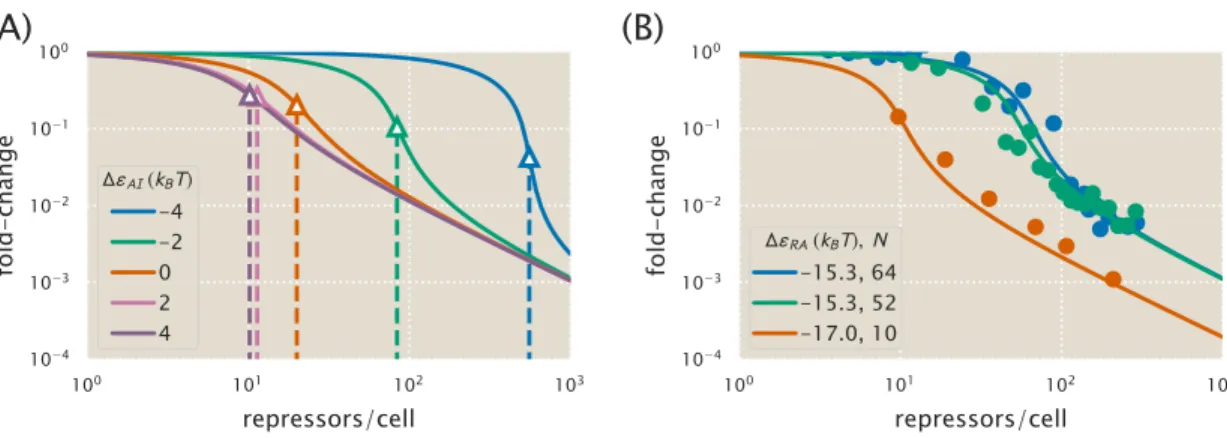
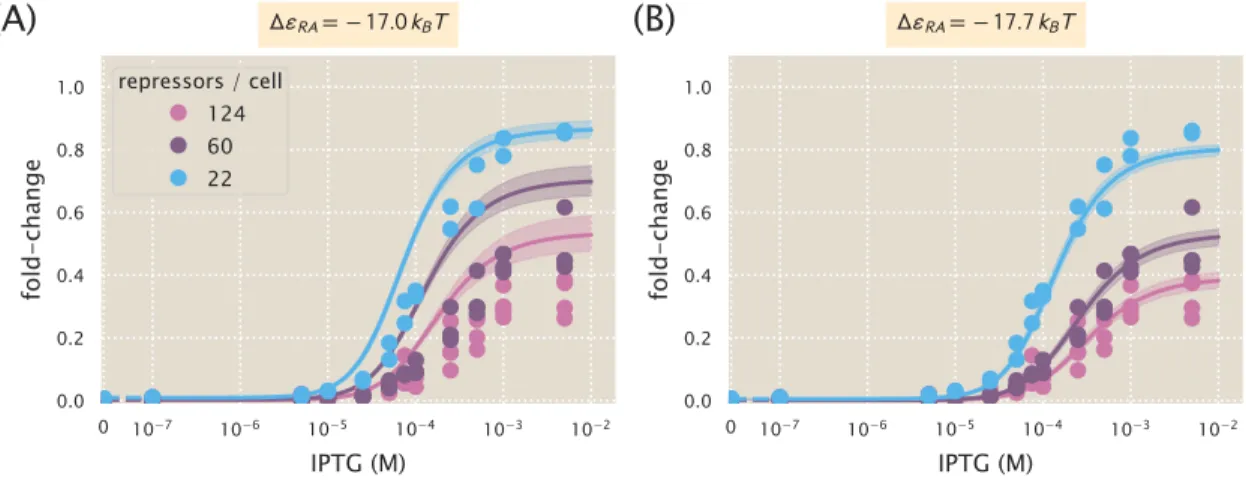
The resulting best-fit functions for several values of ∆εAI all give nearly identical fold-change responses. As shown in the previous section, the fold-change response of a single strain is not sufficient to determine the three MWC parameters (KA, KI, and ∆εAI), since degenerate sets of parameters give almost identical fold-change responses . In the presence of N =10 identical promoters, the fold change equil. 4.6 strongly depends on the allosteric energy difference ∆εAI between the active and inactive states of the Lac repressor.
Induction of Simple Repression with Multiple Promoters or Competitor SitesSites
We now expand our definition of the total number of repressors in the system,Rtot, so that it is given by. If the number of competing sites and their average binding energy are known, this can be taken into account in the model. The leakage, saturation, and dynamic range are shown for systems with a single specific binding siteNS =1 and a number of competing sitesNC=10 or NC =100.
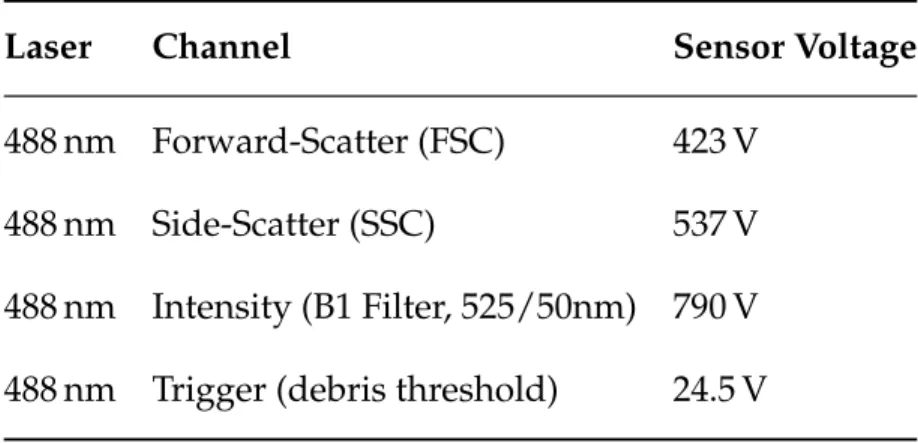
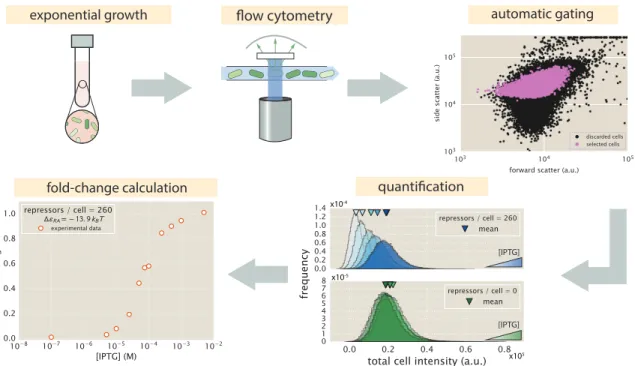
Flow Cytometry
The measured fold-change values in the reverse ordered plate appear to be out. The experimentally measured fold-change values for the two sets of plate arrangements show that samples measured in the forward arrangement appear to be indistinguishable from those measured in reverse order. The consistency of these three readouts validates the quantitative use of flow cytometry and unsupervised fencing to determine the fold change in gene expression.
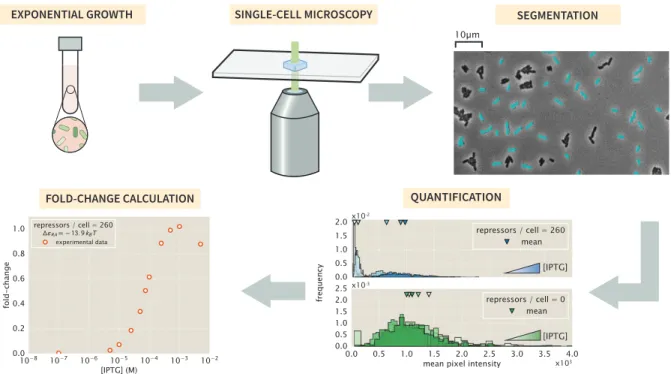
Single-Cell Microscopy
The means of the distributions were used to calculate the fold change in gene expression. With these experimentally measured fold-change values, the best-fitting parameter values of the model were derived and compared with those obtained from flow cytometry. Experimentally measured fold-change values obtained by single-cell microscopy and flow cytometry are shown as white filled and solid colored circles, respectively.
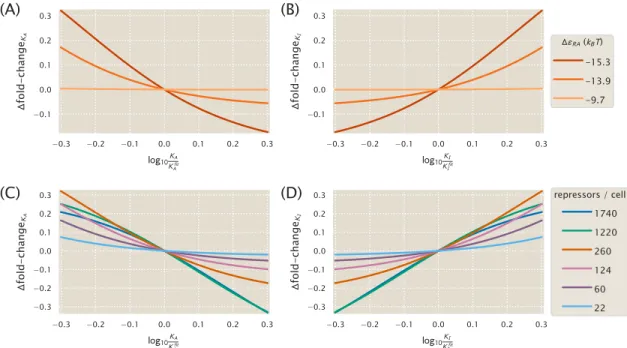
Fold-Change Sensitivity Analysis
To understand how the width of the credible region scales with ∆εRA and R, we can Taylor expand the difference in fold-change to the first order, ∆fold-changeKA. The fold change is calculated in the saturation inductor concentration limit (c→∞, see Eq. 2.7) where the reliable regions in Figs. As in panel (A), but showing how folding sensitivity varies for different repressor copy numbers.
Alternate Characterizations of Induction
The molecular details of copy number and the strength of DNA binding are subsumed in this parameter. 2.5 (which were made using the MWC model), we emphasize that the Hill function approach is more complex than the MWC model (containing four parameters instead of three) and hides the relationships with the physical parameters of the system. For our purposes, the Hill function is unrelated to the physics of the system and provides no insight into how transcription depends on such mutations.
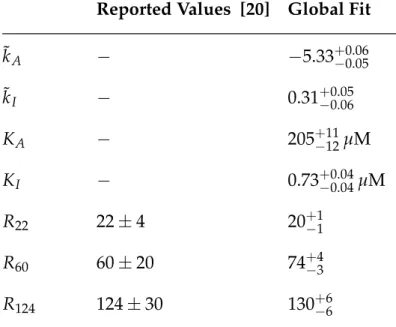
Global Fit of All Parameters
To adjust all parameters simultaneously, we follow an approach similar to that described in the Methods section. The fit values of the repressor copy numbers were all within one standard deviation of those previously reported from [20]. Note that there is overlap between all repressor copy numbers and the net difference in the repressor DNA binding energies is less than 1 kBT.
Applicability of Theory to the Oid Operator Sequence
All data points are shown for the Oid operator after a smaller number of iterations have been taken. 4.21(B), we again plot the Oid fold change data with theoretical predictions using the new estimate for the Oid binding energy from our global fit. Data for (A) flow, (B) saturation, and (C) dynamic range were obtained from fold change measurements in Figs.
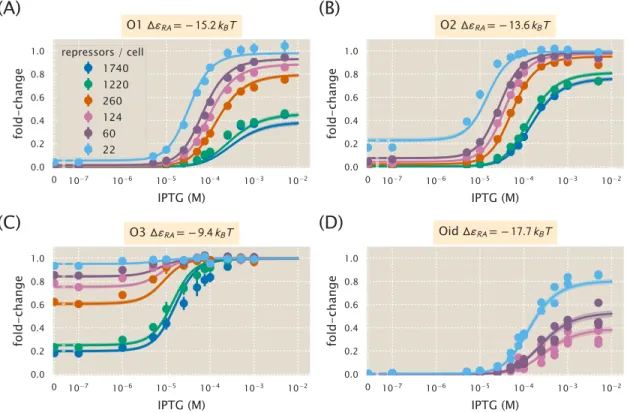
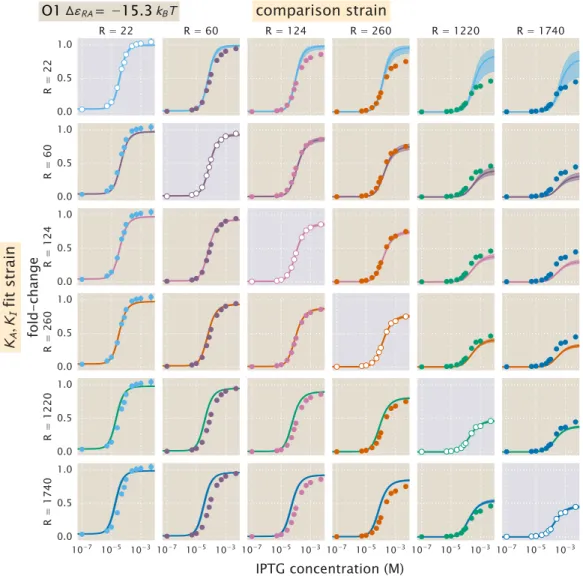
Comparison of Parameter Estimation and Fold-Change Predictions across StrainsStrains
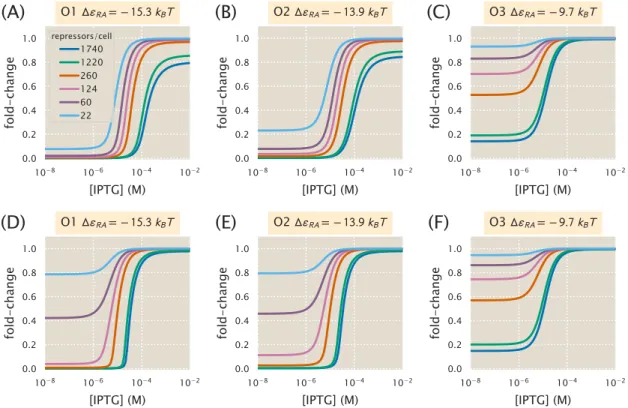
Here we present a comparison of the strain-specific predictions and measured fold-change data for each of the three operators considered. Fold change curves for the various suppressor DNA binding energies∆εRA are plotted as a function of suppressor copy number when IPTG concentration= 0. The remaining plots in this row show the predicted fold change using these values for KA and KI.
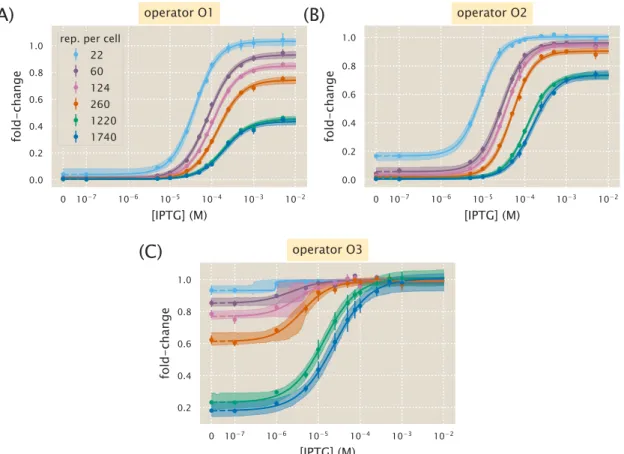
Properties of Induction Titration Curves
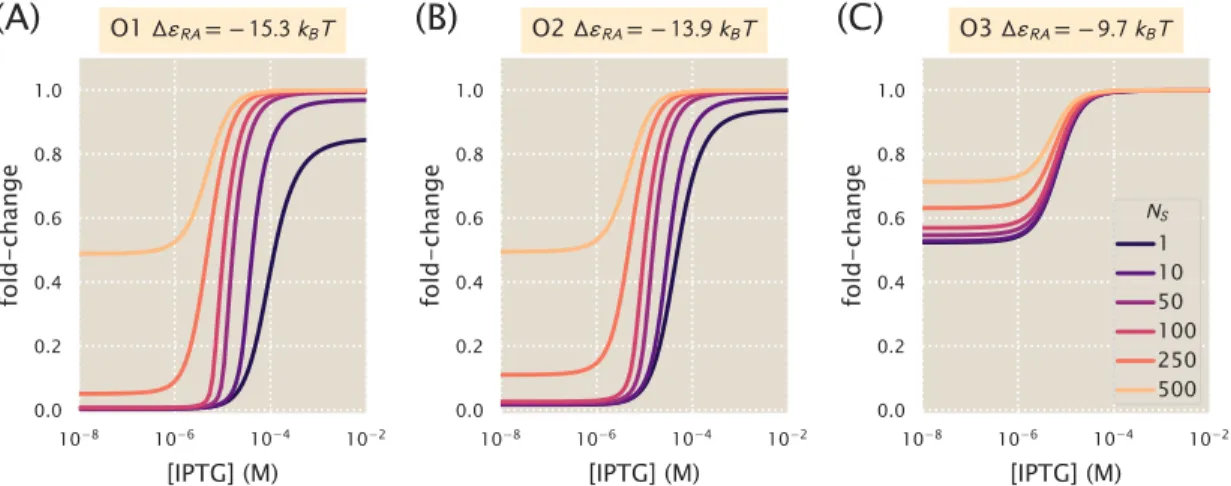
Increasing repressor copy number or decreasing repressor-operator binding energy represses gene expression and reduces flux and saturation. Both [EC50] and h vary significantly with repressor copy numbers for sufficiently strong operator binding energies. Interestingly, for weak operator binding energies of the order of the O3 operator, it is predicted that the effective Hill coefficient should not change with repressor copy number.
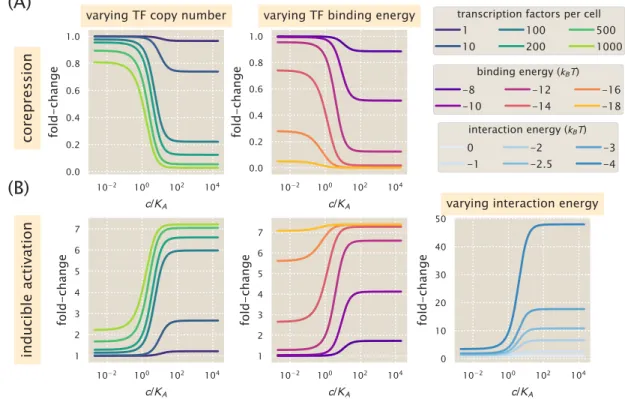
Applications to Other Regulatory Architectures
We draw the reader's attention to the decrease in fold change as effector concentration increases. Note that in this architecture, the binding of the activator does not preclude the binding of the polymerase. 4.28(B) examines fold change predictions in gene expression by manipulating activator copy number, DNA binding energy, and polymerase-activator interaction energy.
Measurement of Steady State
To make a simple estimate of DNA occupancy, let us assume that all transcription factors bind DNA as dimers and occupy a DNA length of 15 bp (this appears to vary from 7 bp to 38 bp in the E. coli RegulonDB [ 141]), we find. that about 2.3 kbp or about half of the genome will be occupied. In the most extreme case, we could assume that this fraction is inaccessible, which would reduce the NNS by a factor of about 2. 4.46 we see that this has a negligible effect on the actual binding energy that we would derive and only corresponds to for a change in energyεRA of about 0.7 kBT.
![Figure 3.5: Comparison of theoretical and experimental channel capacity. (A) Channel capac- capac-ity as inferred using the Blahut-Arimoto algorithm [123] for varying number of repressors and repressor-DNA affinities](https://thumb-ap.123doks.com/thumbv2/123dok/10412290.0/132.918.182.743.105.387/comparison-theoretical-experimental-capacity-algorithm-repressors-repressor-affinities.webp)