A preliminary investigation of the He 3. reaction in 1960 by this author indicated further disagreements with the measurements of Holmgren and Johnston. It was in light of these disagreements and in light of the interest in and importance of the reaction·, as mentioned above, that the following investigation of the He 3. In the same long-wavelength approach we can write (Moszkowski, 1955) ). grade r Y L) J . where m · is the mass of the proton,· . p. p. is the magnetic moment in nuclear magnetons, L is the angular momentum operator, and . cr is the Pauli spin operator.
We can write in this way. where r, e and ¢ are now the relative coordinates of the two particles, and H~ t can now be written in the form is the mass of the ith particle in proton mass units and. where these terms correspond to Ml, Eland E2 radiation. The differential cross section was calculated from the expression l. using the above form of the interaction Hamiltonian and the following initial and final state wave functions. The wave function of the initial state outside the core can be written in the usual way as a fractional wave expansion of an incident Coulomb distorted plane wave and an outgoing Coulomb distorted spherical wave.
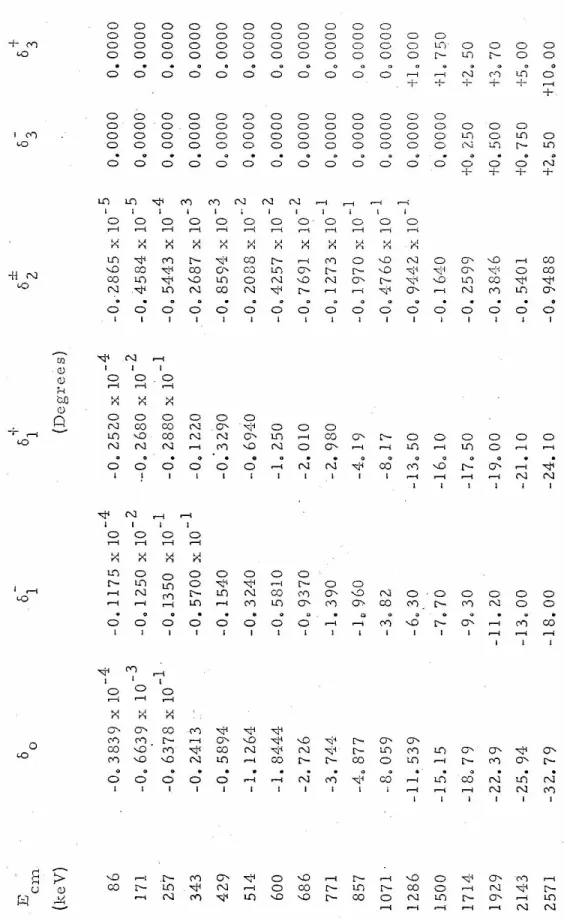
The calculations described above were performed for both possible gamma-ray transitions over the entire range of the experiment.
EXPERIMENTAL APPARATUS AND PROCEDURE A. Target System
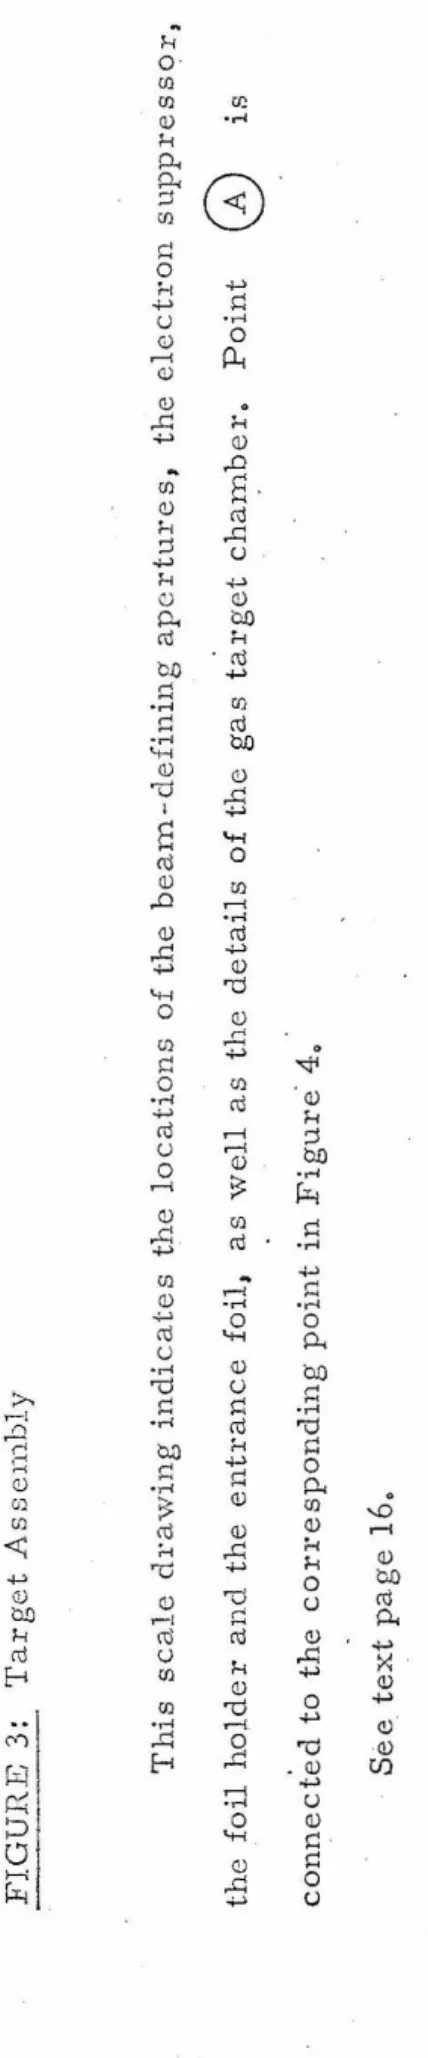
The heart of the target assembly lies in the foil holder, the thin nickel inlet foil, and the gas cell and associated gas handling manifold. The cell depth was 0.530 inches, which accounted for the platinum coating and. A thin metal tube was soldered to the side of the gas cell leading to the gas handling system.
In the current experiment, the effect was measured by looking at the leading edge of l. The entrance foil was included in the collection system and therefore any corrections for the effective charge of the incident alpha particles were rendered unnecessary. In the present experiment, the thickness of the foil was measured using the narrow resonance in the reaction, B10.
An alpha: particle beam of the desired energy and intensity was then directed at the target.
DATA ANALYSIS
The number of counts (1:;) in a given region of the spectrum (excluding the low energy region near the full energy peak of y . 3) is then divided by. N a I{ Tl) in the region of 43 2 ke V in coincidence with the events in the neighborhood of the full energy peak of. 1 and in cases where E is found from an input thickness measurement.
This spreading was caused by the retention in the entrance foil and by the thickness of the gas. In the case of foil straggling, the effect was measured by observing the width of the 1. They represent the number of counts in the full energy peaks of the response function for y1 and the response function for the summation of {y .
As a further simplification, it should be noted that, in the case of the branching ratio, the statistical errors1 of the net spectrum cancel out.
RESULTS
Because in roughly half of the cases it was easy to determine the cross sections for each transition separately, it was possible to measure the branching ratio between these two transitions as a function of energy. This is plotted in Figure 23, where the branching ratio is defined as the ratio of the cross-sectional area of the cascade transition to that of the crossover transition. The errors indicated on these graphs are the relative errors described in the previous chapter and do not include the absolute uncertainties of the experiment.
However, in the case of the branching ratio, due to its insensitivity to such absolute errors, the value is 0. For the case of the total cross-section, however, when the absolute uncertainty is combined with the roughly lOo/o relative uncertainty at each point, the total uncertainty should probably be estimated at ± 15o/o. It is somewhat surprising that the extra-nuclear approach under which the theoretical calculations were made should be valid over such a wide energy range, as evidenced by the quality of the fits obtained.
In the case of the £ waves this is due to the effects of the two P. 3 resonances just above this region. The contributions of the p-waves and £-waves, combined in the Ml and E2 cross-sections, never amount to more than four percent of the total cross-section. As noted in the previous sections, a point was made to check the accuracy of the shape-matching and unfolding analysis used above using a coincidence technique to measure only the cross section for the · cascade transition, cr( "y.
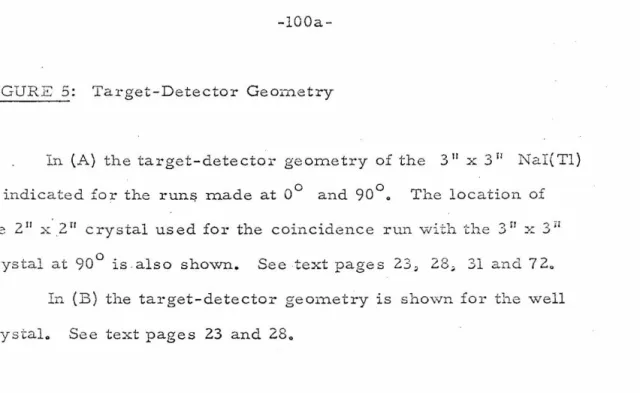
Attempts were also made to measure the angular distribution of the intercept radiation as a function of energy to compare it with the theoretically predicted values of the parameters ap a. 2, a 3 and a4• Measurements of the yield were made with the solid crystal at 90° and 0° to the incident beam and with the well crystal. On the basis of the accuracy of the theoretical fit to the experimental measurements, the theoretical calculation was used to extrapolate S(E) to .. z7ro energy and obtain the low energy eros s section factor.
the proton-proton chain is completed about half the time via the He{a.,-y)Be reaction. Once the fraction of He 4. produced by each termination is known, it is important to calculate the means by which the energy rate is determined. production {R} also varies with temperature due to the difference. production rates of the different terminations and the differences in the effective Q1-s of those terminations due to the different.
APPENDIX I
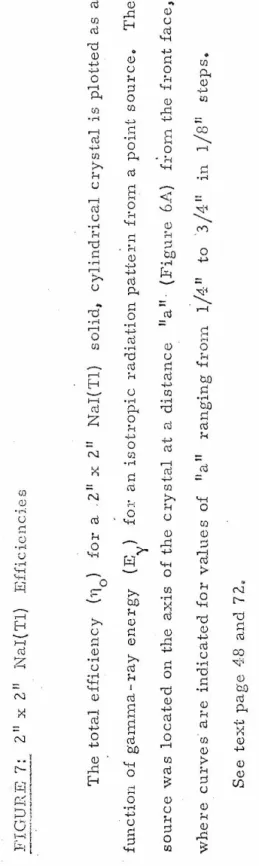
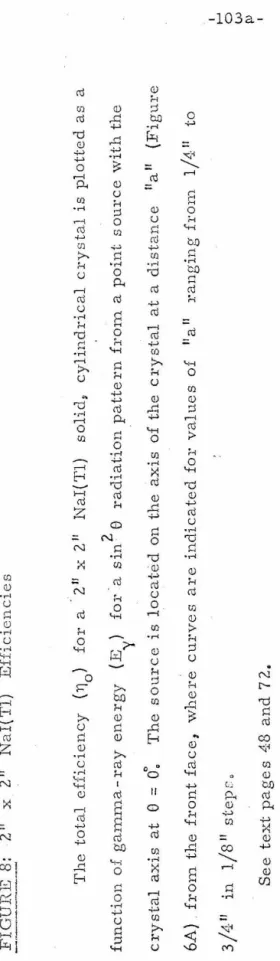
The probability that a ga:rnma ray will interact with a Nai(Tl} crystal. and i is the length of the path that the gamma ray travels in the crystal. In the present experiment the geometries of interest were ( l) the well crystal with the beam axis (a = . 0°) along the axis of the crystal for both isotropic and sin2 Detailed discussions of the nature of these interactions and their dependence on the energy of the incident gamma ray are available elsewhere, e.g.
In photoelectric events all the energy of the incident photon is transferred to an atomic electron. If this electron stops inside the scintillator, all the energy of the gamma ray is transferred to the Finally, for the case of pair production, all the energy of the incident photon is transferred to an electron-positron pair.
022 MeV of energy appears in two 511 keV gamma rays resulting from the annihilation of the created positron. 000 at the top of the full energy peak and this spectrum is then plotted as a function of (E - E. However, these response functions are usually restricted to the high-energy part of the spectrum,.
This was achieved in the present experiment by renewing the entire lead shield and as little of the other material as possible. The crystal 1 response functions were then redetermined using the same reactions and techniques as listed previously. In the present experiment, however, a serious difficulty was found in comparing the absolute determinations of 311 x 311.
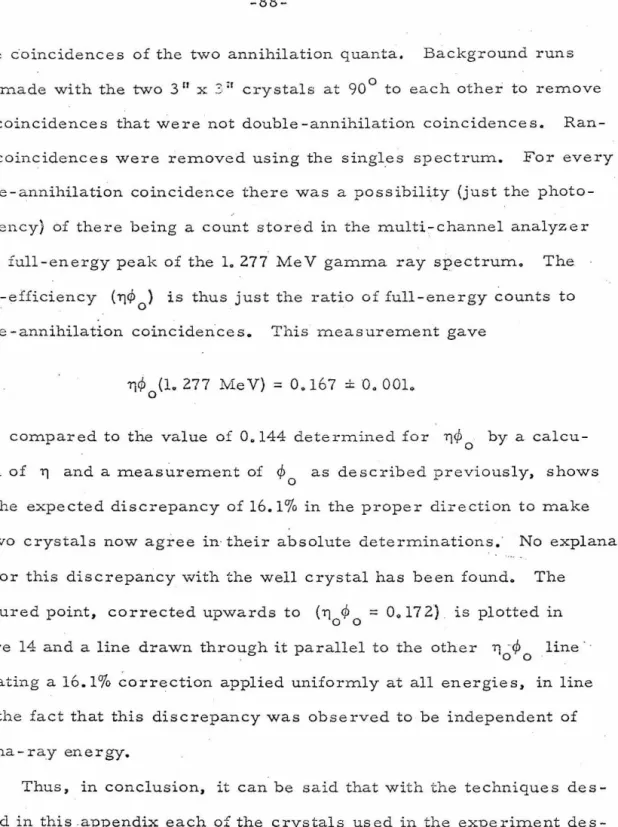
This comparison indicated that the photoefficiency of one of the crystals was about 15 to 20% lower, independent of the gamma ray energy. The source was placed in the well crystal and two 311 x 3n Nai(Tl) crystals were placed on either side of the well crystal. For each double destruction event, there was a possibility (only the photoefficiency) that a count was stored in the multichannel analyzer l.n the full energy peak of the l.
This is a schematic representation of the manifold system used to fill the target with the appropriate gas and measure the gas density in the target.
4.0 . (MeV)
TARGET •
TARGET
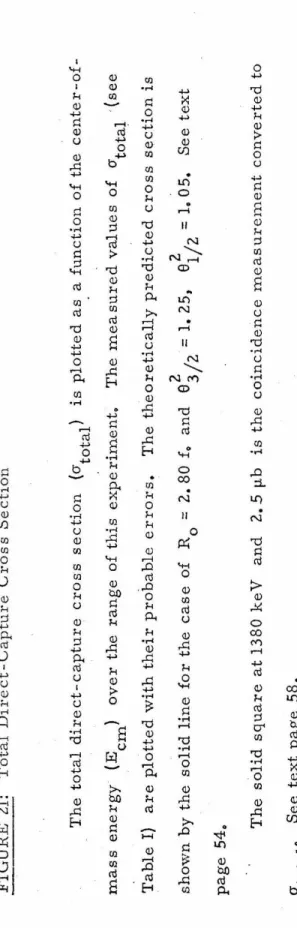
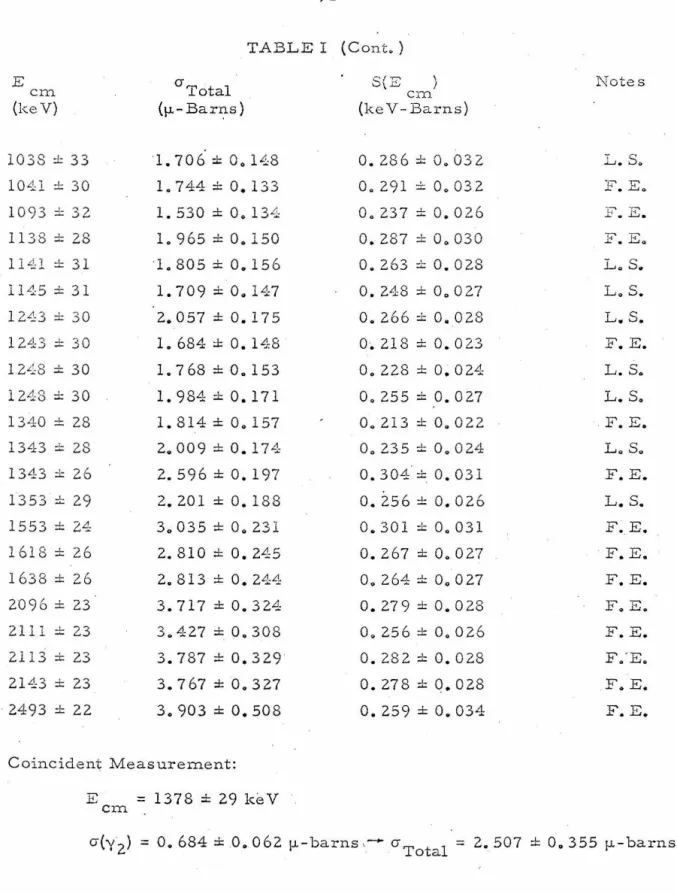
The cross sections for the ground state transition (y .. 3) are now determined from these curves by assuming that the peaks at full energy are symmetric and determining the peak yields at full energy as. Note the contribution of the summation events to the full energy peak and the lack of resolution of the various secondary peas in the total respan function. The theoretically predicted cross-section is shown by the solid line for the case Ro = 2. 5 p.b the coincidence measurement is converted to atotal".
Ml and E2 eros s sections; across the entire region, these contributions together never amount to more than about 2 percent of the total cross-pollination. The upward turn at the high energy end of the E2 curve is resonance at E=2950 key. FIGURE 23: Branching ratio The branching ratio for the directly captured gamma-ray transitions is plotted as a function of the energy center-of-mass. The branching ratio is defined as the ratio of the cascade cross section. The solid curve is the theoretically predicted branching ratio using the same values for core radius and reduced width as in Fig. Zl. The solid curve again represents the theoretically predicted values of S(E ) obtained using the above equation to transform the em curve in Figure 21. The theoretical curve was used to obtain values for the low-energy cross section, S ~ of 0 S =0.47±0, 07 keV-barns. 00, so that the proton-proton chain in the center of the Sun goes to completion through the He3 (a., y)Be 7 reaction approximately 84 percent of the time.