PREFERENCE OF NON-MUSLIM CUSTOMERS TOWARDS ISLAMIC BANKS WITHIN MUSLIM
MINORITY AREAS IN INDONESIA
Hamzah1*
Agus Yudiawan2 St. Umrah3
1Universitas Islam Negeri Alauddin Makassar, South Sulawesi, Indonesia
2,3Institut Agama Islam Negeri Sorong, West Papua, Indonesia
*1Corresponding email: [email protected]
ABSTRACT – This study aims to explore the factors influencing the preferences of non-Muslim customers towards Islamic banks in Muslim minority areas in Indonesia. A quantitative approach was employed, with a sample of 232 non-Muslim customers participating as respondents. Data was collected using questionnaires administered directly to the participants and analyzed using exploratory factor analysis (CFA). The findings revealed four main preference factors: 1) access factors, encompassing variables related to facilities and location; 2) product quality factors, comprising variables pertaining to product, promotion, and reputation; 3) psychological factors, including variables of satisfaction, perception, and knowledge; and 4) socio-cultural factors, consisting of variables related to social status and religious status. These findings offer preliminary insights into the preferences of non-Muslim customers towards Islamic banks within Muslim minority areas in Indonesia. Further studies are warranted, particularly in non-Islamic countries aiming to establish Islamic banks. Moreover, future research can explore the formed variables using other analytical methods such as linear regression, discriminant analysis, or alternative analyses to deepen the understanding of Islamic banking development in Muslim minority regions. The outcomes of this study contribute valuable insights for Islamic banks to consider when developing banking services for non-Muslim customers, thereby promoting the growth of Islamic banking in Muslim minority areas. This research also adds to the existing literature on non-Muslim customer preferences in Islamic banks within Muslim minority areas.
Keywords: customers preferences factors, non-Muslim customers, Indonesian Islamic banks
ABSTRAK – Preferensi Nasabah Non-Muslim terhadap Bank Syariah dalam Wilayah Minoritas Muslim di Indonesia. Penelitian ini bertujuan untuk mengeksplorasi faktor-faktor yang memengaruhi preferensi nasabah non-Muslim terhadap bank syariah dalam wilayah minoritas Muslim di Indonesia.
Pendekatan kuantitatif digunakan dalam penelitian ini, dengan melibatkan sampel sebanyak 232 pelanggan non-Muslim sebagai responden. Pengumpulan data dilakukan melalui penggunaan kuesioner yang diberikan langsung kepada para responden, dan analisis dilakukan menggunakan metode analisis faktor eksploratori (CFA). Temuan penelitian ini mengungkapkan adanya empat faktor preferensi utama, yaitu: 1) faktor akses, yang meliputi variabel-variabel terkait fasilitas dan lokasi; 2) faktor kualitas produk, yang mencakup variabel-variabel terkait produk, promosi, dan reputasi; 3) faktor psikologis, yang melibatkan variabel-variabel kepuasan, persepsi, dan pengetahuan; dan 4) faktor sosial-budaya, yang terdiri dari variabel-variabel terkait status sosial dan status keagamaan. Temuan ini memberikan gambaran awal yang penting terkait preferensi nasabah non-Muslim terhadap bank syariah dalam wilayah minoritas Muslim di Indonesia. Untuk memperdalam pemahaman mengenai perkembangan perbankan syariah di wilayah minoritas Muslim, penelitian lanjutan perlu dilakukan, terutama di negara- negara non-Muslim yang berencana mendirikan bank syariah. Selain itu, penelitian selanjutnya dapat mengkaji permasalahan tersebut berbagai analisis lain, seperti regresi linear, analisis diskriminan, atau metode lainnya. Hasil penelitian ini berkontribusi dalam pengembangan layanan perbankan syariah untuk nasabah non-Muslim dan mendorong pertumbuhannya di daerah minoritas Muslim. Penelitian ini juga berkontribusi dalam memperkaya literatur terkait preferensi nasabah non-Muslim pada bank syariah di daerah minoritas Muslim.
Kata Kunci: faktor preferensi nasabah, nasabah non-muslim, bank syariah indonesia
INTRODUCTION
Islamic banking was established as an alternative for individuals seeking banking services that adhere to Sharia principles. The establishment of Islamic banking is based on a philosophy that prohibits the practice of usury in financial and non-financial transactions. Consequently, Islamic banking operates on the basis of partnerships and cooperation (mudharabah and musharakah) with a profit-sharing principle (Mokoagow & Fuady, 2015; Ibrahim & Fitria, 2012).
The number of customers in Indonesian Islamic banks is currently growing rapidly. Both Muslim and non-Muslim communities comprise a significant portion of the customer base (Saptasari & Aji, 2020; Widiyaningsih &
Mustamim, 2021). Non-Muslim academics are also becoming increasingly aware of the superior products and services offered by Islamic banks (Musse, 2015). This illustrates that individuals from all walks of life can benefit from Islamic banks. The Vice President of the Republic of Indonesia emphasized that Indonesian Islamic banks, as one of the tools of Islamic economics and finance, should be a rational choice for the community, avoiding exclusivity and instead promoting universality in accordance with the principles of Islamic teachings (Aldila, 2021).
Amidst government and banking sector efforts to attract non-Muslim customers, an interesting phenomenon has been observed in Indonesian Islamic banks operating in the Muslim minority region of West Papua. Field data indicates that there are 550 non-Muslim customers in West Papua, accounting for 34.5% of the total 1,593 customers (Habibah, 2022). This is quite intriguing, considering the Muslim minority population in the West Papua region (Ismail Suardi Wekke, 2017). Furthermore, the enthusiasm of non-Muslim customers to utilize Islamic banking services is remarkably high, with non-Muslims constituting 90% of the customer base in Islamic banks operating in the Muslim minority region of Bali (Nababan, 2022). These phenomena present a challenge for Islamic banking to expand its reach and enhance customer service to play a more significant role in the Muslim minority communities. However, there is a growing perception in society that Islamic banks are similar to conventional banks, indicating a lack of awareness about Islamic banking (Fathurrahman &
Azizah, 2018; Dimitha, Ibrahim, & Ahmadsyah, 2021). This condition results in a low level of public preference for Islamic banks.
To address these conditions, it is essential to understand the factors that influence the growth and development of Islamic banks in the Muslim minority region of West Papua. How can the increase in non-Muslim customers be maximized? The answer lies in understanding the preferences of non-Muslim customers. Exploring and mapping their preferences for Indonesian Islamic banks will provide valuable insights into the factors that attract them to Islamic banking. This, in turn, will facilitate efforts to improve services and tailor them to their specific needs and desires.
Studies on the preferences of non-Muslim customers in Indonesian Islamic banks within Muslim minority areas have been limited in scope. Existing studies predominantly concentrate on the priorities of Muslim customers in Islamic banks (Fathurrahman & Azizah, 2018; Larasati, 2017), neglecting the perspectives of non-Muslims. Naturally, the preferences of these two groups will differ. Muslim customers typically choose Islamic banks due to their faith and religious beliefs (Ma’arif, 2016; Rohmadi, Nurbaiti, & Junaidi, 2016).
Conversely, non-Muslims often possess a favorable perception of Islamic banking (Mbawuni & Nimako, 2018; Muarif, Ibrahim, & Amri, 2021), which influences their decision to opt for Islamic banking services. Consequently, Islamic banking institutions must enhance these factors to promote Islamic banking within the Muslim minority (Saiti, Ardo, & Yumusak, 2022).
Additionally, the quality of service provided serves as a determinant of customer loyalty (Thaker, Sakaran, Nanairan, Thaker, & Hussain, 2020; Uddin, Shammo, Mahbub, & Ahmed, 2016). Furthermore, knowledge of reputable Islamic banks can motivate customers to utilize Islamic banking services (Rassool, 2018; Mohamad & Che Majid, 2016). Therefore, ongoing efforts to promote Sharia literacy are necessary to attract non-Muslim customers (Suci &
Hardi, 2019). Although there are practical differences in the attitudes of Muslims and non-Muslims toward Islamic banking (Soud & Sayılır, 2017;
Aulia, Ibrahim, & Tarigan, 2020), both groups share a positive perception of Islamic banking institutions (Faisal, Akhtar, & Rehman, 2014; Nadia, Ibrahim,
& Jalilah (2019) which ultimately influences their intention to use Islamic banks in Indonesia (Saptasari & Aji, 2020). Consequently, Islamic banks must consider these factors when designing their marketing strategies.
Given the diverse preferences of non-Muslim customers regarding Islamic banks, there is a need for a standardized mapping effort. This would enable Islamic banking to serve as a role model in developing non-Muslim customers'
interest in Islamic banking services, particularly in Muslim minority areas.
Therefore, this study aims to explore the factors that influence the preferences of non-Muslim customers in Indonesian Islamic banks. By identifying the key preference factors, this research study will focus on targeted development of Islamic banking services for non-Muslim customers. Failure to do so would render the efforts to develop Islamic banking in Muslim minority areas or non- Muslim communities futile. Thus, this study holds significant importance and should be conducted to facilitate the growth and development of Islamic banks, aligning them with the principles of being "rahmatan lil 'Alamin”.
LITERATURE REVIEW
Previous studies have indicated that the choice of Islamic bank customers is influenced by their individual preferences for the provided services (Howard &
Sheth, 1969; Tunggal, 2005; Elkamiliati & Ibrahim, 2014). The stronger the preference for a particular product or service, the more confident customers are in selecting the offered services (Simamora, 2013; Keller & Keller, 2013).
Consumer preferences may vary, but according to Simamora (2013) at least five stages contribute to the formation of these preferences consumers perceive products as a combination of attributes, with different buyers having distinct opinions regarding the attributes that best meet their expectations; 2) the level of benefit derived from these attributes differs among customers due to their diverse needs; 3) consumer confidence in each attribute of a product plays a role; 4) consumers exhibit varying levels of satisfaction with a product; and 5) different levels of satisfaction influence consumers' attitudes towards brands through evaluation.
Understanding consumer preferences is a complex task due to the numerous influencing characteristics that tend to interact with one another (Kotler, 2003;
(Keller & Keller, 2013). Howard argues that customer preferences reflect the decision-making process in purchasing. In simpler terms, customer preferences are influenced by five characteristics of assessment, which lead each customer to make choices regarding product purchases (Tunggal, 2005; Sutarso, 2010).
These five characteristics include: 1) Culture, encompassing attributes such as physical form, models, values, attitudes, principles, religion, and norms; 2) Personal factors, including age, occupation, and lifestyle; 3) Economic factors, such as income, savings, and type of work; 4) Psychological aspects, such as motivation, perception, knowledge, and satisfaction; and 5) Social factors,
encompassing aspects of status and social class (Pels & Sheth, 2017; Howard
& Sheth, 1969; Tunggal, 2005)
This differs from previous research, which states that non-Muslim customers' preferences for Islamic banks are motivated by various complex attributes.
Generally, non-Muslim customers exhibit a preference for Islamic banking (Mbawuni & Nimako, 2018). This preference arises from a good understanding of Islamic bank governance (Rassool, 2018; Mohamad & Che Majid, 2016).
They believe that banks managed with religious values provide quality services and are free from harmful elements. Customers perceive that all religions promote goodness, making financial transactions at Islamic banks appear safer (Ma’arif, 2016; Rohmadi et al., 2016). Additionally, Islamic banks do not rely on interest (usury), speculation (maysir), or uncertainty (gharar) in their operations, which increases customer confidence in using Islamic banking services (Zainuddin, 2008).
In general, various scholars have defined Islamic banking from their respective perspectives. Islamic banks are financial institutions primarily engaged in providing credit and other services in payment traffic and money circulation, operating according to Sharia principles (Alma & Priansa, 2014). They operate without relying on interest and primarily provide financing and other services in payment traffic and money circulation, following Islamic Sharia principles (Antonio, 2001).
Previous studies have examined the diverse reasons behind non-Muslim customers opting for Islamic banks. Furthermore, the West Papua region, also known as a Muslim minority area (Ismail Suardi Wekke, 2017), has a competitive market share in Sharia banking. Islamic banks were initially established to serve all segments of society, including individuals of different religions (Aldila, 2021). Moreover, embracing literacy in Islamic religious practices, which promote compassion for all humanity (Suci & Hardi, 2019), adds to the appeal. Hence, this study will focus on the variables strongly believed to influence the preferences of non-Muslim customers in Indonesian Islamic banks. These variables are based on the theory of customer preference adapted from (Howard & Sheth, 1969; Tunggal, 2005; Sutarso, 2010) as well as previous studies. The variables in question encompass Social Status, Religion, Products, Facilities, Satisfaction, Perception, Promotion, Location, Reputation, and Knowledge. This study aims to explore these ten variables as
preference factors for non-Muslim customers in Indonesian Islamic banks, specifically within the Muslim minority area of West Papua.
METHODOLOGY Population and Sample
The population for this study consisted of non-Muslim customers at Indonesian Islamic banks in the West Papua region, totaling 550 individuals. The sample size was determined using the Slovin formula with a significance level of 5%
(0.05). Once the sample size was determined, a simple random sampling technique was employed to select the respondents. The calculation for the sample size is as follows:
N = 𝑵
𝟏+𝑵𝒆𝟐 (1)
= 550
1+(550 𝑥 0,0052) = 550
1+(550 𝑥 0,0025) = 550
1+(1,375) = 550
2,375
N = 231,578 ~ 232 sample people (rounding)
Data Type
The data type used in this study is primary data, which refers to data obtained directly from the research subjects through the administration of questionnaires.
Data Collection Techniques
The data collection technique involved the use of a questionnaire, which is a method of collecting data by presenting a set of closed-ended questions to respondents. The questionnaire aimed to gather data on the research variables.
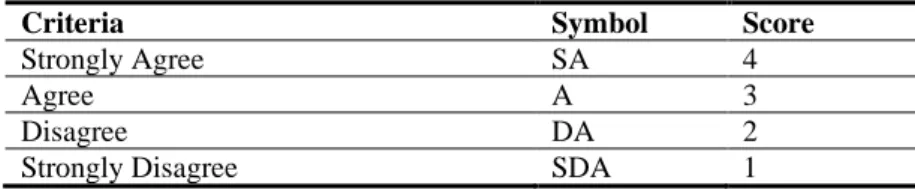
The Likert scale with four alternative answers was used in the questionnaire, as shown in Table 1.
Table 1. Questionnaire Measurement Scale
Criteria Symbol Score
Strongly Agree SA 4
Agree A 3
Disagree DA 2
Strongly Disagree SDA 1
Instrument Validity and Reliability Test
The validity test assesses the extent to which a questionnaire can accurately measure what it intends to measure. This test involves comparing the calculated r-value with the r-table. The calculated r-value is obtained from the Corrected Item Total Correlation value and is compared with the r-table using DF=n-2, with a significance level of 95% (α=0.05). An instrument is considered valid if the r-value > r-table or if the significance value < 0.05 (Arikunto, 2010).
Mathematically, the correlation coefficient (r-value) is calculated using the following formula:
𝒓𝒙𝒚 = 𝒏𝚺𝐱𝐲−(∑𝒙𝟐)(∑𝒚𝟐)
√{𝒏𝚺(𝒙)𝟐− (𝚺𝒙)𝟐} {𝒏𝚺(𝒚)𝟐− (𝚺𝒚)𝟐}
(2)
rxy : correlation coefficient (r-value)
∑x : respondent's answer score/ question item score
∑y : total score of respondents' answers
∑x : product of item score with a total score n : number of respondents
After conducting the validity test, the next step is to perform a reliability test.
The reliability test assesses the consistency and stability of respondents' answers over time. It also determines the degree to which an instrument is reliable as a data collection tool. A reliable questionnaire produces consistent answers. In this study, the reliability test was conducted using the Cronbach's Alpha statistical test (α), assisted by the SPSS program. If the value of α > 0.60, the instrument is considered reliable (Ghozali, 2018). The formula for calculating Cronbach's Alpha is as follows:
α =
𝒌.𝒓𝟏+(𝒌−𝟏)𝒓 (3)
Where:
α : reliability coefficient r : correlation between items k : number of items
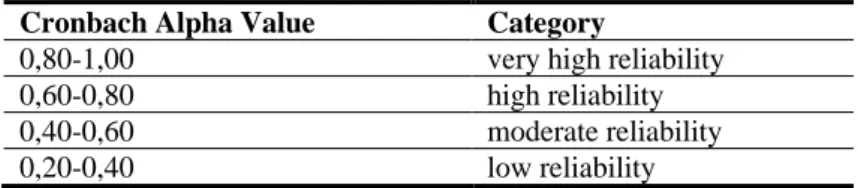
There are 4 (four) categories of reliability based on the test results as shown in Table 2.
Table 2. Data Reliability Category
Cronbach Alpha Value Category
0,80-1,00 very high reliability
0,60-0,80 high reliability
0,40-0,60 moderate reliability
0,20-0,40 low reliability
Data Analysis
Exploratory Factor Analysis (EFA) was utilized to analyze the research data using SPSS 25 for Windows. The analysis consisted of four steps: 1) initial solution, 2) extraction, 3) rotation, and 4) factor naming (Supranto, 2004; Emin Öcal, Oral, Erdis, & Vural, 2007).
Figure 1. Stages of Factor Analysis The stages are described in detail as follows:
Step I: Initial Solution
The initial solution tests the feasibility of the analysis by assessing whether the assumptions for factor analysis are met. Two criteria determine if the data can undergo factor analysis: the Kaiser-Meyer-Olkin (KMO) coefficient and Bartlett's Sphericity test. The KMO test evaluates the adequacy of the sample being analyzed, comparing the observed correlation coefficients with the partial correlation coefficients. The KMO formula is as follows (Norušis, 2012):
(4) Where:
i : 1,2,3,…., p and j = 1,2,3,…, p
rij : observed correlation coefficient between variables i and j aij : partial correlation coefficient between variables i and j
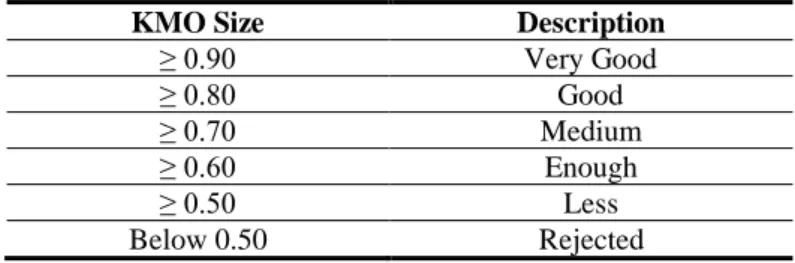
According to Sharma (1996), the KMO values can be interpreted as follows:
step 1: initial
solution step 2: extracting
the factors step 3: rotating the
factors step 4: naming the
factors
Table 3. Kaiser-Mayer-Olkin Criteria
KMO Size Description
≥ 0.90 Very Good
≥ 0.80 Good
≥ 0.70 Medium
≥ 0.60 Enough
≥ 0.50 Less
Below 0.50 Rejected
If the KMO value is less than 0.50, factor analysis is unsuitable for these variables.
Additionally, the Bartlett test is conducted to determine if there is a relationship between variables. If the variables X1, X2, ..., Xp are independent, the correlation matrix between variables is the same as the identity matrix.
Bartlett's test has high accuracy (significance) when p < 0.0000, indicating that the correlation matrix is suitable for factor analysis. The hypothesis tested by Bartlett's test is as follows (Ibrahim, 2023):
H0: Correlation matrix = identity matrix H1: Correlation matrix ≠ identity matrix Rejection of H0 is determined through two criteria:
1. Bartlett test value > chi-square table value
2. Significance value < 5% significance level (0.05) Bartlett's test is formulated by Norušis (2012) as follows:
Bartletts Test = -ln |𝑹| [𝒏 − 𝟏 − 𝟐𝒑+𝟓
𝟔 ] (5)
Where:
|R| : determinant value N : the amount of data
P : number of items/ items/ variables
If H0 is rejected, the multivariate analysis is feasible, especially factor analysis.
Step II: Extracting the Factors
The extraction process aims to reduce the number of factors (eigenvalues factors) from the set of variables and determine the contribution of each factor
to the overall variance explained. In this study, the Principal Component Analysis (PCA) method is employed for factor extraction.
Step III: Rotating the Factors
Rotation involves adjusting the axis around the variable points' coordinates.
The extraction process determines the number of factors that summarize the variables but does not determine how the variables are distributed across these factors. Rotation performs a process that the extraction procedure does not accomplish, which is aligning the variables more closely with the factors that represent them.
Step IV: Naming the Factors
The final step involves assigning names or labels to the factors obtained from the extraction and rotation processes. Names are given based on the similarities among the characteristics of the variables/items that load onto each factor.
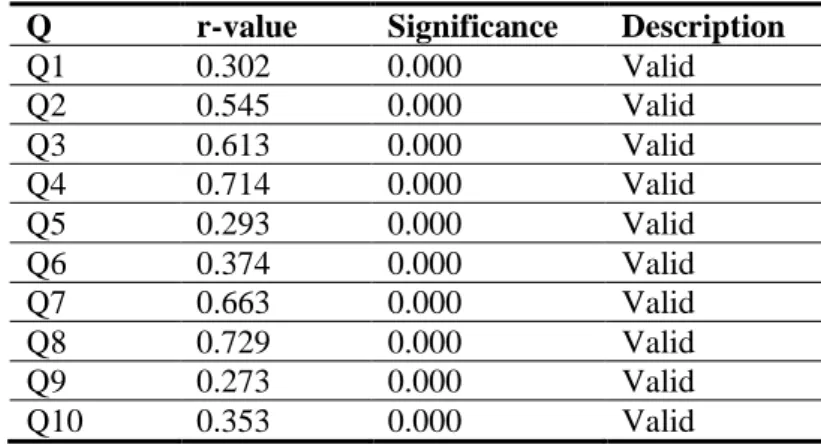
RESULT AND DISCUSSION Validity and Reliability Test Results
The results of the research instrument reliability analysis are shown in Table 4.
Table 4. Validity Test Results
Q r-value Significance Description
Q1 0.302 0.000 Valid
Q2 0.545 0.000 Valid
Q3 0.613 0.000 Valid
Q4 0.714 0.000 Valid
Q5 0.293 0.000 Valid
Q6 0.374 0.000 Valid
Q7 0.663 0.000 Valid
Q8 0.729 0.000 Valid
Q9 0.273 0.000 Valid
Q10 0.353 0.000 Valid
The significance values for Q1 to Q10, as presented in the table above, are all
<0.05. Therefore, it can be concluded that all statement items used in data
collection are considered valid. Additionally, the results of the reliability analysis for the research instrument are displayed in Table 5.
Table 5. Reliability Test Results
Cronbach's Alpha N of Item Description
0.649 10 Reliable
The Cronbach's Alpha value presented in the table above is 0.649. Therefore, it can be concluded that the data used falls into the moderate category and is considered reliable.
Factor Analysis Results
Factor analysis in this study is employed to identify the underlying factors that shape the preferences of non-Muslim customers at Indonesian Islamic banks, thereby generating new components or factors. The analysis was conducted in four stages using the Statistical Package for the Social Sciences (SPSS) version 25 for Windows. The results of the analysis for each stage, namely the initial solution, extraction, rotation, and factor naming, are described below.
Step I: Initial Solution
The initial solution was conducted to assess the suitability of the analysis and determine if the assumptions for factor analysis were met. The test results for the Kaiser-Meyer-Olkin (KMO) measure and Bartlett's test are presented below.
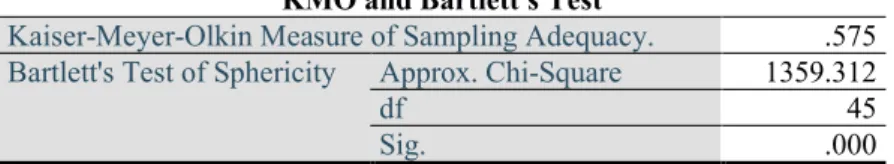
Table 6. KMO and Bartlet's Test
KMO and Bartlett's Test
Kaiser-Meyer-Olkin Measure of Sampling Adequacy. .575 Bartlett's Test of Sphericity Approx. Chi-Square 1359.312
df 45
Sig. .000
The table above presents the results of the KMO Measure of Sampling Adequacy (MSA) and Bartlett's test. The KMO Measure of Sampling Adequacy value is 0.575, which is greater than the recommended threshold of 0.5. This indicates that the sample is adequate for further analysis. Additionally, the chi-square value for Bartlett's test is 1359.312 with a significance of 0.000,
which is less than 0.5. This indicates a significant correlation between variables and suggests that further processing is feasible.
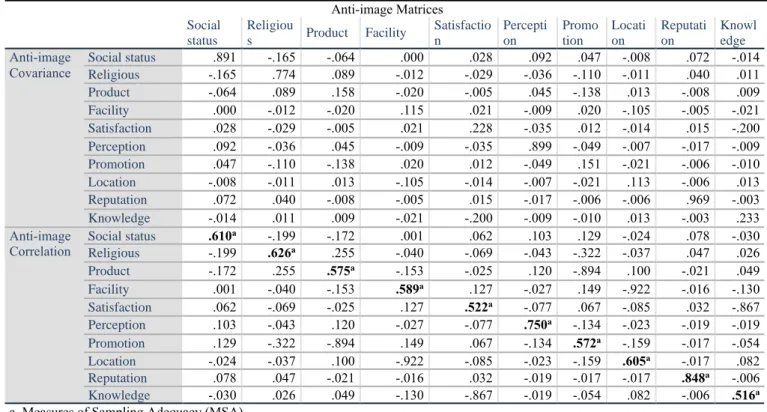
Furthermore, the Anti-image matrices table below can be referred to in order to determine which variables can be included in further analysis and which ones should be excluded.
Tabel 7. Anti-image Matrices
Anti-image Matrices Social
status
Religiou
s Product Facility Satisfactio n
Percepti on
Promo tion
Locati on
Reputati on
Knowl edge Anti-image
Covariance
Social status .891 -.165 -.064 .000 .028 .092 .047 -.008 .072 -.014
Religious -.165 .774 .089 -.012 -.029 -.036 -.110 -.011 .040 .011
Product -.064 .089 .158 -.020 -.005 .045 -.138 .013 -.008 .009
Facility .000 -.012 -.020 .115 .021 -.009 .020 -.105 -.005 -.021
Satisfaction .028 -.029 -.005 .021 .228 -.035 .012 -.014 .015 -.200 Perception .092 -.036 .045 -.009 -.035 .899 -.049 -.007 -.017 -.009
Promotion .047 -.110 -.138 .020 .012 -.049 .151 -.021 -.006 -.010
Location -.008 -.011 .013 -.105 -.014 -.007 -.021 .113 -.006 .013
Reputation .072 .040 -.008 -.005 .015 -.017 -.006 -.006 .969 -.003
Knowledge -.014 .011 .009 -.021 -.200 -.009 -.010 .013 -.003 .233
Anti-image Correlation
Social status .610a -.199 -.172 .001 .062 .103 .129 -.024 .078 -.030 Religious -.199 .626a .255 -.040 -.069 -.043 -.322 -.037 .047 .026
Product -.172 .255 .575a -.153 -.025 .120 -.894 .100 -.021 .049
Facility .001 -.040 -.153 .589a .127 -.027 .149 -.922 -.016 -.130
Satisfaction .062 -.069 -.025 .127 .522a -.077 .067 -.085 .032 -.867 Perception .103 -.043 .120 -.027 -.077 .750a -.134 -.023 -.019 -.019 Promotion .129 -.322 -.894 .149 .067 -.134 .572a -.159 -.017 -.054 Location -.024 -.037 .100 -.922 -.085 -.023 -.159 .605a -.017 .082 Reputation .078 .047 -.021 -.016 .032 -.019 -.017 -.017 .848a -.006 Knowledge -.030 .026 .049 -.130 -.867 -.019 -.054 .082 -.006 .516a a. Measures of Sampling Adequacy (MSA)
In the Anti-image Matrices table provided above, the MSA values of each variable are indicated by the numbers marked with (a) and in bold. The MSA values for the variables are as follows: social status (0.610), religious (0.626), product (0.575), facilities (0.589), satisfaction (0.522), perception (0.750), promotion (0.572), location (0.605), reputation (0.848), and knowledge (0.516). Since all of these MSA values are greater than 0.5, it can be concluded that all variables can be further processed.
Step II: Extracting the factors The extraction step aims to identify a reduced number of factors (eigenvalues factor) from the set of variables and determine the contribution of these factors to all variables (total variance explained).
Principal Component Analysis (PCA) was employed for the extraction analysis, and the results are presented below:
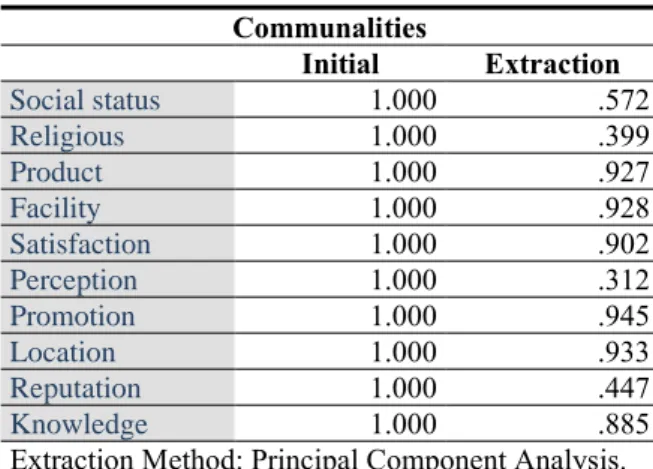
Table 8. Communalities Test
Communalities
Initial Extraction
Social status 1.000 .572
Religious 1.000 .399
Product 1.000 .927
Facility 1.000 .928
Satisfaction 1.000 .902
Perception 1.000 .312
Promotion 1.000 .945
Location 1.000 .933
Reputation 1.000 .447
Knowledge 1.000 .885
Extraction Method: Principal Component Analysis.
In the communalities table, the social status variable has a value of 0.572. This indicates that the derived factors can explain approximately 57.2% of the variance in the social status variable. Similarly, the religious variable has a value of 0.399, suggesting that the formed factors can account for about 39.9%
of the variance in the religious variable. It follows that lower communalities indicate a weaker relationship with the included factors.
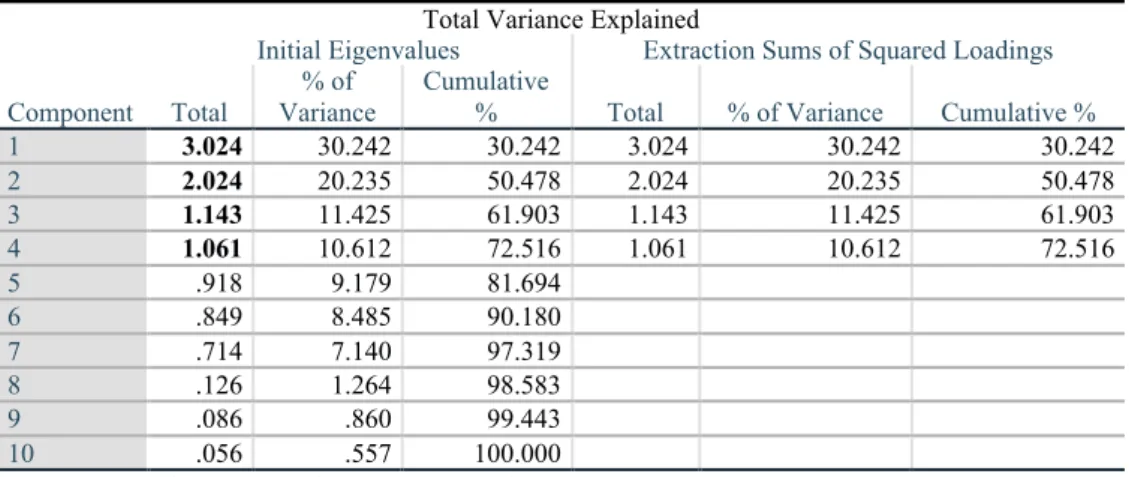
Table 9. Total Variance Explained
Total Variance Explained Component
Initial Eigenvalues Extraction Sums of Squared Loadings Total
% of Variance
Cumulative
% Total % of Variance Cumulative %
1 3.024 30.242 30.242 3.024 30.242 30.242
2 2.024 20.235 50.478 2.024 20.235 50.478
3 1.143 11.425 61.903 1.143 11.425 61.903
4 1.061 10.612 72.516 1.061 10.612 72.516
5 .918 9.179 81.694
6 .849 8.485 90.180
7 .714 7.140 97.319
8 .126 1.264 98.583
9 .086 .860 99.443
10 .056 .557 100.000
Extraction Method: Principal Component Analysis.
The Total Variance Explained table above indicates that four factors are formed from the ten variables entered. Each factor has an eigenvalue greater than 1.
Factor 1 has an eigenvalue of 3.024, explaining a variance of 30.242%. Factor 2 has an eigenvalue of 2.024, explaining a variance of 20.235%. Factor 3 has
an eigenvalue of 1.143, explaining a variance of 11.425%. Lastly, Factor 4 has an eigenvalue of 1.061, explaining a variance of 10.612%. The eigenvalues describe the relative importance of each factor in calculating the variance of the ten analyzed variables. If all the variables are summed up, the value is 10, which is equal to the number of variables.
Component 1: 3,024/10 x 100% = 30.24%
Component 2: 2,024/10 x 100% = 20.24%
Component 3: 1,143/10 x 100% = 11.43%
Component 4: 1,061/10 x 100% = 10.61%
The total variance when the ten variables are extracted into four factors is:
30.24% + 20.24% + 11.43% + 10.61% = 72.52%
The newly formed factors account for 72.52% of the variance, while the remaining 27.48% is explained by other factors that were not studied.
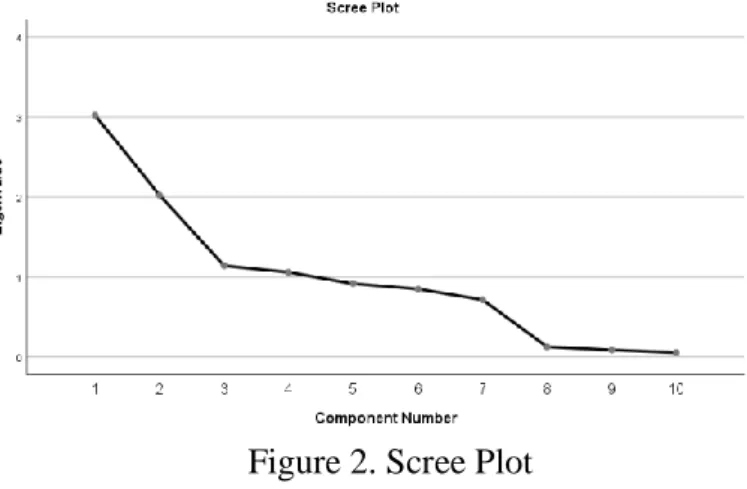
Additionally, the resulting scree plot illustrates the relationship between the factors and their eigenvalues. The scree plot can be seen as follows:
Figure 2. Scree Plot
The scree plot graphically illustrates the relationship between the number of factors formed and their eigenvalues. The factor extraction process concludes when the curve or line starts to level off. From the provided image, it is evident that the curve begins to flatten out after the formation of four components (eigenvalue > 1). This indicates that four components or factors are the optimal number of dominant factors to account for the analyzed issues.
Step III: Rotating the factors
Once the four factors have been formed, the next step is to allocate the ten variable items to the four factors based on their loading factors. The component
matrix is used for this distribution. The results of the component matrix are presented in Table 10.
Table 10. Rotated Component Matrix
Rotated Component Matrixa Component
1 2 3 4
Social status .148 .172 -.138 .708
Religious .366 .270 .168 .405
Product .193 .938 -.096 .015
Facility .945 .190 .000 .001
Satisfaction -.053 -.091 .943 .036
Perception .259 .054 .386 -.306
Promotion .224 .945 -.034 .007
Location .942 .214 .006 .004
Reputation .136 .178 -.086 -.624
Knowledge .013 -.053 .938 .042
Extraction Method: Principal Component Analysis.
Rotation Method: Varimax with Kaiser Normalization.
a. rotation converged in 5 iterations.
The rotated component matrix displays the loading factor values for each variable. The loading factor represents the magnitude of the correlation between the formed factors and these variables. Based on the table above, the following conclusions can be drawn:
1. Social status has the highest loading factor value with factor 4 (0.708), indicating that it is primarily associated with factor 4 compared to other factors.
2. Religion has the highest loading factor value with factor 4 (0.405), suggesting that it is predominantly linked to factor 4.
3. The product has the highest loading factor value with factor 2 (0.938), implying that it is primarily related to factor 2 compared to other factors.
4. The facility has the highest loading factor value with factor 1 (0.945), indicating that it is predominantly associated with factor 1 compared to other factors.
5. Satisfaction has the highest loading factor value with factor 3 (0.943), suggesting that it is primarily linked to factor 3 compared to other factors.
6. Perception has the highest loading factor value with factor 3 (0.386), indicating that it is predominantly associated with factor 3.
7. Promotion has the highest loading factor value with factor 2 (0.945), suggesting that it is primarily linked to factor 2 compared to other factors.
8. Location has the highest loading factor value with factor 1 (0.942), implying that it is predominantly associated with factor 1 compared to other factors.
9. Reputation has the highest loading factor value with factor 2 (0.178), indicating that it is primarily linked to factor 2 compared to other factors.
10. Knowledge has the highest loading factor value with factor 3 (0.938), suggesting that it is predominantly associated with factor 3.
Table 11. Component Transformation Matrix
Component Transformation Matrix
Component 1 2 3 4
1 .712 .690 -.106 .082
2 .236 -.094 .967 -.012
3 -.187 .087 .066 .976
4 -.635 .713 .221 -.200
Extraction Method: Principal Component Analysis.
Rotation Method: Varimax with Kaiser Normalization.
The Component Transformation matrix table presented below illustrates the outcomes of the varimax rotation, showcasing the distribution of variables among the four formed factors.
Step IV: Naming the factors
Following the rotation of the metrics resulting in the formation of the four factors, they are assigned names based on the characteristics of the constituent variable items. There is no standardized or universally accepted naming convention for factors. Therefore, it is essential to provide appropriate justification for the chosen factor labels based on the attributes of the included variables. Upon assessing the characteristics of the variables comprising the four factors, the researcher assigned the following names to the factors, as depicted in the table below.
Table 12. Naming Factors
No Variables that make up the Group of Factors
Name of Factors 1 Facility
Factor 1 Access Factor 2 Location
3 Product
Factor 2 Product Quality Factor 4 Promotion
5 Reputation
No Variables that make up the Group of Factors
Name of Factors 6 Satisfaction
Factor 3 Psychological Factor 7 Perception
8 Knowledge 9 Social status
Factor 4 socio-culturalFactor 10 Religious
From the table of factor formation on research findings, it is shown in a simple picture as follows:
Figure 3. Preference Factors for Non-Muslim Customers
Figure 3 illustrates that at least four factors influence the preferences of non- Muslim customers in Muslim minority areas regarding Islamic banking services. The first factor is access, encompassing attributes such as location and facilities. The availability of accessible locations and convenient facilities plays a role in the decision-making process of non-Muslim customers when choosing Islamic banks (Viranti & Ginanjar, 2015). Communities residing in easily reachable areas are more inclined to opt for saving in Islamic banks (Ma’arif, 2016). The presence of a substantial number of ATM outlets, branch offices,
Non-Muslim Customer Preference
Factors
Access Facility Factor
Product Quality Factor Psychological Factor
Socio-Cultural Factor
Product Promotion
Reputation Satisfaction Perception Knowledge
Facility Location
Social Status Religious
and well-equipped facilities significantly influences people's trust and confidence in selecting banking services (Noor & Sanrego, 2011; Larasati, 2017).
The second factor is product quality, consisting of attributes such as product features, promotions, and reputation. The findings of this study align with previous research conducted by Fathurrahman & Azizah, (2018) suggesting that superior products and effective promotions enhance customer preferences for Islamic banking services (Viranti & Ginanjar, 2015). Additionally, apart from product quality, customer psychology is considered a critical factor in shaping preferences (Howard & Sheth, 1969; Pels & Sheth, 2017).
According to the findings of this study, psychological factors encompass three attributes: satisfaction, perception, and knowledge. This discovery aligns with a study conducted by Rohmadi et al. (2016), which states that customer decisions regarding Islamic banking are influenced by their perceptions and knowledge (Saptasari & Aji, 2020). Furthermore, studies by Fathurrahman &
Azizah (2018) and Abhimantra, Maulina, & Agustianingsih (2013) assert that knowledge plays a significant role in customers' banking decisions by influencing the satisfaction they seek (Tunggal, 2005).
The final factor is the socio-cultural aspect, including attributes related to social and religious status. This finding aligns with the notion put forth by Tunggal, (2005) that customer preferences are influenced by their social status. The higher the social status, the stronger the inclination towards a particular product or service (Tunggal, 2005). Moreover, religious attributes also play a crucial role in shaping the preferences of Islamic bank customers. This is supported by studies conducted by Ma’arif (2016), Fathurrahman & Azizah (2018) and Rohmadi et al. (2016), which suggest that faith is a decisive factor for the public when choosing secure Islamic banking services. It is widely acknowledged that Islamic banks incorporate religious values into their business practices, offering clarity, protection, and comfort during banking transactions (Antonio, 2001).
This preference arises from a strong understanding of Islamic banking principles (Rassool, 2018; Mohamad & Che Majid, 2016), with customers believing that a bank guided by religious values will provide quality services and operate free from harmful elements.
The results of this comprehensive analysis clearly indicate that the preferences of non-Muslim customers in Islamic banks are influenced by access, product,
psychological, and socio-cultural factors. Therefore, the findings of this study can serve as a valuable model for increasing non-Muslim customers' engagement with Islamic banking, particularly in Muslim minority areas.
Consequently, it is crucial to pursue further actions based on the outcomes of this study to promote Islamic banking as a system that benefits not only the Muslim community but also wider society, ensuring Islamic banks fulfil their role as "rahmatan lil 'Alamin" (blessings for all creation).
CONCLUSIONS
The preferences of non-Muslim customers at Indonesian Islamic banks in Muslim minority areas are shaped by four factors. It is intriguing to observe that, in addition to access factors, product quality, and customer psychology, socio-cultural factors also play a significant role in influencing the preferences of non-Muslim customers in Indonesian Islamic banks. This finding is particularly noteworthy, as it indicates that Islamic banks, managed in accordance with Islamic principles, can garner interest and foster trust among non-Muslim customers.
These customers believe that every religion promotes goodness, including in the realm of sharia banking services, making them feel safer entrusting their finances to a sharia-compliant bank. Furthermore, their perception of Islamic banking services aligns with their current banking needs. Consequently, managers can gain valuable insights into customer preferences by identifying the factors that shape non-Muslim preferences in Islamic banks. By doing so, they can channel resources towards meeting the expectations of the community, thereby facilitating the continued growth of Islamic banking services, especially in areas with a Muslim minority population.
Exploring the non-Muslim customer preference factors in Islamic banks should be further investigated to promote the expansion of Islamic banking and its utilization by all segments of society, regardless of their social or religious background. This study has revealed that the preferences of non-Muslim customers at Indonesian Islamic banks are diverse and complex. Therefore, additional research is warranted to examine the impact of the identified variables on customer preferences using alternative analytical methods, such as linear regression analysis, discriminant analysis, or other appropriate analyses.
Additionally, it would be relevant to expand the sample population to include
areas with non-Muslim majority populations, as this would enrich and enhance our understanding of non-Muslim customer preferences in Islamic banks.
REFERENCES
Abhimantra, A., Maulina, A. R., & Agustianingsih, E. (2013). Analysis of Factors Affecting Customers (Students) in Choosing to Save at Islamic Banks. Proceeding PESAT, 5.
Aldila, N. (2021). Wapres Harap Bank Syariah Indonesia (BSI) Tak Eksklusifkan Layanan Syariah. Retrieved March 3, 2022, from bisnis.com website:
https://finansial.bisnis.com/read/20210225/231/1360775/wapres-harap- bank-syariah-indonesia-bsi-tak-eksklusifkan-layanan-syariah
Alma, B., & Priansa, D. J. (2014). Sharia business management: Instilling sharia values and practices in contemporary business. Bandung: Alfabeta.
Antonio, M. S. (2001). Islamic banking: from theory to practice. Gema Insani.
Arikunto, S. (2010). Prosedur Penelitian Suatu Pendekatan Praktik Jakarta:
Rinneka Cipta. Hal.
Aulia, R., Ibrahim, A., & Tarigan, I. R. R. (2020). Operasionalisasi Lembaga Keuangan Baru Dan Dampaknya Terhadap Pertumbuhan Usaha Mikro.
JIHBIZ: Global Journal of Islamic Banking and Finance., 2(1), 57-81.
Dimitha, D. V., Ibrahim, A., & Ahmadsyah, I. (2021). Analisis Persepsi Nasabah Terhadap Strategi Pemasaran Bank Aceh Syariah di Kota Banda Aceh. Journal of Sharia Economics, 2(1), 42-58.
Elkamiliati, & Ibrahim, A. (2014). Pengaruh Bi Rate Terhadap Persentase Bagi Hasil Pembiayaan Musyarakah Pada Bank Aceh Syariah Banda Aceh.
Share: Jurnal Ekonomi dan Keuangan Islam, 3(2).
Emin Öcal, M., Oral, E. L., Erdis, E., & Vural, G. (2007). Industry financial ratios—application of factor analysis in Turkish construction industry.
Building and Environment, 42(1), 385–392.
https://doi.org/10.1016/j.buildenv.2005.07.023
Faisal, M., Akhtar, A., & Rehman, A. (2014). Attitude of Muslims and Non- Muslims towards Islamic Banking – An Exploratory Study in India. In The
Developing Role of Islamic Banking and Finance: From Local to Global Perspectives (pp. 141–162). Emerald Group Publishing Limited.
https://doi.org/10.1108/S1569-3759(2014)0000095017
Fathurrahman, A., & Azizah, U. (2018). Analisis Faktor-Faktor Preferensi Mahasiswa terhadap Perbankan Syariah. Ihtifaz: Journal of Islamic Economics, Finance, and Banking, 1(1), 99.
https://doi.org/10.12928/ijiefb.v1i1.273
Ghozali, I. (2008). Structural equation modeling: Metode alternatif dengan partial least square (pls). Badan Penerbit Universitas Diponegoro.
Ghozali, I. (2018). Multivariate analysis application with IBM SPSS 25.
Habibah. (2022). Interview: Indonesian Sharia Bank Customers. West Papua.
Howard, J. A., & Sheth, J. N. (1969). The theory of buyer behavior. New York, 63, 145.
Ibrahim, A. (2023). Metodologi Penelitian Ekonomi dan Bisnis Islam - Edisi Revisi (Q. Aini Ed.). Jakarta: Bumi Aksara.
Ibrahim, A., & Fitria. (2012). Implikasi Penetapan Margin Keuntungan pada Pembiayaan Murabahah (Suatu Studi dari Perspektif Islam Pada Baitul Qiradh Amanah). Share: Jurnal Ekonomi dan Keuangan Islam, 1(2), 142- 162.
Ismail Suardi Wekke. (2017). Indonesian Muslim Minorities: Research Roadmap. 15th ADRI International Conference Waisai-Raja, 01, 1–7.
Raja Ampat. Retrieved from http://www.albayan.ae
Keller, K. L., & Keller, K. L. (2013). Manajemen Pemasaran, Jilid-2, Edisi-13.
Penerjemah Bob Sabran. Jakarta: Erlangga.
Kotler, P. (2003). Manajemen Pemasaran. edisi kesebelas. In Indeks kelompok Gramedia. Jakarta.
Larasati, F. (2017). The Influence of Religiosity, Bank Products, Trust, Knowledge, and Services on Savings Preferences in Islamic Banking.
STIE Perbanas Surabaya.
Ma’arif, S. (2016). Factors Affecting Customer Decisions to Transact at Islamic Banks (Case Study at Bank Syariah Mandiri Boyolali Branch).
Universitas Muhammadiyah Surakarta.
Mbawuni, J., & Nimako, S. G. (2018). Muslim and non-Muslim consumers’
perception towards introduction of Islamic banking in Ghana. Journal of Islamic Accounting and Business Research, 9(3), 353–377.
https://doi.org/10.1108/JIABR-04-2016-0050
Mohamad, J., & Che Majid, M. F. (2016). A Study on The Customer’s Acceptance Towards Islamic Banking Products Among Non-Muslim In Dual Banking System. International Journal of Management Studies (IJMS), 23(1), 1–11.
Mokoagow, S. W., & Fuady, M. (2015). Factors Affecting the Profitability of Islamic Commercial Banks in Indonesia. EBBANK, 6(1), 33–62.
Muarif, H., Ibrahim, A., & Amri, A. (2021). Likuiditas, Kecukupan Modal, Pembiayaan Bermasalah Dan Pengaruhnya Terhadap Profitabilitas Bank Umum Syariah Di Indonesia Periode 2016-2018. JIHBIZ: Global Journal of Islamic Banking and Finance., 3(1), 36-55.
Musse, A. M. (2015). Awareness of Islamic banking products and services among non-Muslim students in selected northern universities of Malaysia.
Universiti Utara Malaysia. Retrieved from http://etd.uum.edu.my/5086/
Nababan, C. N. (2022). Nasabah Non-Muslim Lengket dengan Bank Syariah, Alergi Rentenir. Retrieved April 16, 2022, from CNN Indonesia website:
https://www.cnnindonesia.com/ekonomi/20220327124954-78- 776676/nasabah-non-muslim-lengket-dengan-bank-syariah-alergi- rentenir
Nadia, S., Ibrahim, A., & Jalilah, J. (2019). Analisis Hambatan Pertumbuhan Perbankan Syariah Di Indonesia (Kajian Terhadap Perbankan Syariah Di Aceh). JIHBIZ: Global Journal of Islamic Banking and Finance., 1(2), 153-176.
Noor, F., & Sanrego, Y. D. (2011). Islamic Boarding School Community Preferences Against Islamic Banks (Case Study DKI Jakarta). Tazkia Islamic Finance and Business Review, 6(1).
Norušis, M. J. (2012). IBM SPSS statistics 19 statistical procedures companion (Vol. 496). prentice hall Upper Saddle River, NJ, USA:
Pels, J., & Sheth, J. N. (2017). Business models to serve low-income consumers in emerging markets. Marketing Theory, 17(3), 373–391.
https://doi.org/10.1177/1470593117704262
Rassool, N. H. (2018). Towards establishing an Islamic retail bank in a Muslim- minority country. ISRA International Journal of Islamic Finance, 10(1), 78–84. https://doi.org/10.1108/IJIF-11-2017-0048
Rohmadi, R., Nurbaiti, N., & Junaidi, J. (2016). Analysis of the determinants of customer decisions in choosing Islamic banking services and conventional banking in Bengkulu City. Manhaj: Jurnal Penelitian Dan
Pengabdian Masyarakat, 5(3), 283–292.
https://doi.org/http://dx.doi.org/10.1161/mhj.v4i3.192.g176
Saiti, B., Ardo, A. A., & Yumusak, I. G. (2022). Why non-Muslims subscribe to Islamic banking? Qualitative Research in Financial Markets, 14(2), 247–269. https://doi.org/10.1108/QRFM-01-2018-0005
Saptasari, K., & Aji, H. M. (2020). Factors affecting Muslim non-customers to use Islamic bank: Religiosity, knowledge, and perceived quality. Jurnal Ekonomi Dan Keuangan Islam, 6(2), 165–180.
Sharma, S. (1996). Applied Multivariate Techniques.
Simamora, H. (2013). Consumer Behavior. Jakarta: Gramedia Pustaka.
Soud, N. S., & Sayılır, Ö. (2017). Perceptions of Islamic banking among Muslim and Non-Muslim citizens in Tanzania. International Journal of Islamic Economics and Finance Studies, 3(3), 15–29.
https://doi.org/https://doi.org/10.25272/j.2149-8407.2017.3.3.02
Suci, A., & Hardi, H. (2019). Literacy experiment of Islamic financing to non- Muslim small and micro business. Journal of Islamic Marketing, 11(1), 179–191. https://doi.org/10.1108/JIMA-01-2019-0003
Supranto, J. (2004). Multivariate Analysis of Meaning and Interpretation.
Jakarta: Rineka Cipta.
Sutarso, S. dan. (2010). Marketing in Praktice (Edisi Pert). Yogyakarta:
Yogyakarta Graha Ilmu.
Thaker, H. M. T., Sakaran, K. C., Nanairan, N. M., Thaker, M. A. M. T., &
Hussain, H. I. (2020). Drivers of loyalty among non-Muslims towards Islamic banking in Malaysia: Evidence from SmartPLS. International Journal of Islamic and Middle Eastern Finance and Management, 13(2), 281–302.
Tunggal, A. W. (2005). Question Answer: Consumer Behavior and Marketing Strategy. Jakarta: Harvarindo.
Uddin, M. B., Shammo, A. M., Mahbub, M., & Ahmed, N. (2016). Non- Muslim Customers’ Attitude and Perceptions toward the Products and Services of Islamic Banks: An Exhaustive Study on Islamic Bank Bangladesh Limited. IOSR Journal of Business and Management, 18(10), 72–79. https://doi.org/10.9790/487X-1810047279
Viranti, F. A., & Ginanjar, A. (2015). Influence of Facilities, Promotion, Product and Location Islamic Banking on Decision Non-Muslim Customers Patronizing at BRIS Case Study in BRI Syariah.
Tauhidinomics: Journal of Islamic Banking and Economics, 1(1), 35–60.
https://doi.org/https://doi.org/10.15408/thd.v1i1.3323
Widiyaningsih, B., & Mustamim, M. (2021). Switching Behaviour of Non- Muslim Costumers to Indonesian Islamic Bank at The Jombang Branch.
INCOME: Innovation of Economics and Management, 1(1), 11–15.
Zainuddin, A. (2008). Sharia Banking Law. Jakarta: Sinar Grafika.