Preliminary investigations into the population genetics of the horned passalus beetle, Odontotaenius disjunctus (Coleoptera), in forests of the southeastern United States
by Rachel Yi
A thesis submitted to the faculty of The University of Mississippi in partial fulfillment of the requirements of the Sally McDonnell Barksdale Honors College.
Oxford May 2014
Approved by:
_________________________________________________
Advisor: Assistant Professor Ryan Garrick
_________________________________________________
Reader: Associate Professor Brice Noonan
________________________________________________
Reader: Associate Professor Lainy Day
1
© 2014 Rachel Yi
ALL RIGHTS RESERVED ACKNOWLEDGEMENT
2
I would like to extend my appreciation and gratitude to the following individuals. Everything would not have been possible without their support and encouragement.
First and foremost, I would like to thank Dr. Ryan Garrick who not only fulfilled his responsibilities as an advising professor but went beyond his obligations by embracing the role of a mentor, supporter, and counselor every step of the way. Any success that I may have attained owes a large debt of gratitude to his patience with my errors, diligence in understanding the state of the research, and constant willingness to point me in the right direction.
I would also like to acknowledge Dr. Beckie Symula. Though she may not have had a direct hand in this thesis, her constant encouragement and thought- provoking questions never ceased to challenge and push me in the course of my research.
Lastly, I would like to bring attention to the faculty of the Sally McDonnell Barksdale Honors College, particularly Dr. Debbie Young. Attentive and sincerely interested in what I did, she gave invaluable insight into all matters not only about the thesis and research but also about many other areas. She encouraged me not only as a student but also as a scholar in pursuit of knowledge and academic excellence.
3
ABSTRACT
RACHEL YI: Preliminary investigations into the population genetics of the horned passalus beetle, Odontotaenius disjunctus (Coleoptera), in forests of the southeastern United States
(Under the direction of Dr. Ryan Garrick)
As a major hotspot of biodiversity, the Appalachian Mountains have been a source of great interest for ecologists in many ways. The mountains’ north- south orientation, varying degrees of elevation and environmental conditions, and historical cycles of glacial encroachment have been thought to contribute to this unusual level of population variation. As such, population genetic studies of species have been a growing area of investigation. Phylogeography, the study of how historical processes could lead to current geographic distributions of individuals and populations of a species, is a particularly prominent direction.
The focus of this study examines the horned passalus and its dispersal in relation to the idea that the Southern Appalachians functioned as a refugium during the Last Glacial Maximum. Two scenarios that are being considered is whether the Southern Appalachians are comprised of one general refugium or the entire region involved several scattered refugia. This will be tested by comparing genetic diversity of different populations of the horned passalus sampled throughout the region and its association to spatial distribution within the region. Step-wise gradients in genetic diversity levels and positive correlations between spatial and genetic distances would be expected from single refugium
4
conditions. Dispersed refugia would be predicted to have scattered pockets of populations with varying levels of genetic diversity rather than a clear gradient and fluctuating genetic distances between populations. The mitochondrial CO1 gene and the nuclear H3A gene were used as markers to generate sequence data through Polymerase Chain Reaction (PCR). The results of this investigation seemed to support the first scenario of a single, large refugium. Greatest genetic diversity was found within the southern part of the Southern Appalachians, and increased spatial distance from populations within this region corresponded with increased genetic distances. However, the H3A gene yielded data that was either contradicting or difficult to interpret. Further analyses and addition of sequence data seem necessary in order to provide greater insight into the population genetics of the horned passalus.
5
TABLE OF CONTENTS LIST OF TABLES AND
FIGURES...vii LIST OF
ABBREVIATIONS...ix INTRODUCTION...
..1
MATERIALS AND
METHODS...10
RESULTS...
.18
DISCUSSION...
.25
BIBLIOGRAPHY...
30
6
LIST OF FIGURES AND TABLES
Figure 1 Map of the United States demonstrating the Southern Appalachians as hotspot for
biodiversity...2 Figure 2 Distribution of the horned passalus in the United
States...5 ..
Figure 3 Map of sample
locations...10 Figure 4 Gel image of amplified CO1
gene...16
Figure 5 Phylogenetic tree of mitochondrial DNA sequences (CO1 gene)...20
Figure 6 Phylogenetic tree of nuclear DNA sequences (H3A gene)...21
Figure 7 Phylogenetic tree of CO1 gene based on geographic landscape features that are expected to limited free movement of individual horned passalus
beetles...22 Figure 8 Phylogenetic tree of H3A gene based on geographic landscape
features that are expected to limited free movement of individual horned passalus
beetles...23
Table 1 Summary of two scenarios of the Southern Appalachian refuge and likely
predictions...9 Table 2 List of sample names arranged according to geographical locations..10
Table 3 Recipe for10 μL of PCR
mix...14
7
Table 4 Annealing Temperature Settings used for PCR...15
Table 5 Within-group genetic distances based on the CO1 gene...24
Table 6 Between-group genetic distances based on the CO1 gene...24
Table 7 Within-group genetic distances based on the H3A gene...24
Table 8 Between-group genetic distances based on the H3A gene...24
8
LIST OF ABBREVIATIONS CO1 cytochrome c oxidase subunit 1
H3A histone 3A
LGM Last Glacial Maximum
MS Mississippi
NSA Northern part of Southern Appalachians PCR Polymerase chain reaction
SSA Southern part of Southern Appalachians TNF Talladega National Forest
9
Introduction Background
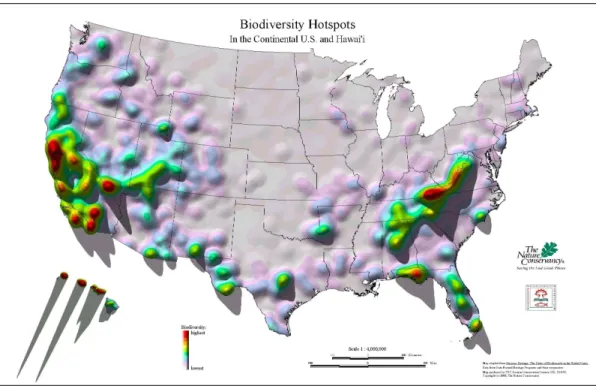
Located in the northeastern part of the United States, the Appalachian Mountains are an area characterized by an incredible amount of biodiversity (Pickering 2002). As seen in Figure 1, it is a unique place that originated as far back as 350-650 million years ago and hosts a wide range of species that are not found elsewhere (Pickering 2002). A number of factors have contributed to the region’s high level of biodiversity, most of which are due to its features as a mountain range. Variations in elevation, moisture level, and latitude have
contributed to the formation and persistence of different gradients of ecological conditions resulting in great levels of environmental heterogeneity even within small distances. In turn, the wide-range of habitats have become hosts to many distinct populations within a variety of species (Pickering 2002).
The Appalachian Mountains are also interesting in the way they run north to south. This alignment allows greater access to migration through the region as opposed to the mountain chains found in Europe that run east to west and are considered to function as geological barriers (Soltis et al. 2006). Historically, the Appalachian’s north-south orientation has been particularly important in light of the Last Glacial Maximum (LGM), which occurred approximately 20,000 years ago (Hewitt 2000). Glaciers encroaching into the northern Appalachians resulted
10
Figure 1. Map of the United States demonstrating the Southern Appalachians as hotspot for biodiversity. Warm colors such as red refer to high levels of biodiversity whereas cooler colors such as blue refer to low levels. In the eastern USA, the
Appalachian Mountains are the region with the most intense coloring, indicating its high level of biodiversity. Map produced by The Nature Conservatory.
in an inhospitable environment due to drastic changes in the climate and landscape, leading to drier, colder conditions (Hewitt 2000). However, many species were able to find refuge by migrating south and away from these glaciers, unimpeded by the orientation of the mountain chains’ ridgelines (Pickering 2002).
As a result, the Southern Appalachians are a particularly interesting section of the Appalachians, especially because the LGM ice sheets never managed to reach the Southern Appalachians (Pickering 2002). As glaciation progressively made living conditions difficult for organisms in the northern Appalachians, populations were likely forced down into this region to survive. Forests were pushed either southward or downhill into sheltered ravines and gullies (Soltis et al. 2006). As a result, forests
could aggregate in favorable conditions of greater warmth and moisture in places at lower latitudes or elevation. In addition, the varied ecological conditions resulting from elevation gradients allowed species to find acceptable habitats despite a change in latitude. In this way, the Appalachians became a refugium for forest- dwelling organisms until conditions reverted sufficiently to allow populations to expand and repopulate their original territories in the north (Soltis et al. 2006).
This combination of LGM phenomena in the northern Appalachians and possible refugium conditions of the Southern Appalachians has generated much interest in terms of the region’s high level of biodiversity. Early investigations
involved questions of where and how mountain species survived with consideration for the frequency of such glaciation (Holderegger 2008). Developments in molecular technology now allow scientists to delve into such inquiries and garner data on the biogeographical histories of these mountains (Holdregger 2008). In particular, ecologists have directed their attention to the study of phylogeography, which involves identifying the number of different genetic lineages within a species, their relations to the spatial location of different populations, and the processes that may have shaped these arrangements (Avise 2000). By comparing the physical location of individuals or populations as well as the level of similarity or difference in genetic information such as DNA sequence data, it is possible to test hypotheses about past events and understand the processes behind contemporary geographical patterns of genetic variation. For instance, a study conducted by Soltis et al. (2006) contained a meta-analysis of phylogeographic data of unglaciated eastern North America. By comparing data from numerous papers, these authors were able to find a number of
patterns and probable past histories of several species. However, the investigation is far from over. Additional studies are needed to further understand the complex relationships within this highly diverse and multifaceted region.
To contribute to phylogeographic inquiries, the focus of the present research is the population genetics and long-term history of the horned passalus beetle, Odontotaenius disjunctus (Coleoptera). This species is part of the family Passalidae and is commonly known through a variety of names including betsy beetle, bess bug, patent leather beetle, Jerusalem beetle, horn beetle, and peg beetle. The horned passalus is easily identifiable by stridulations, a shrill grating noise produced by rubbing body parts against each other, produced when they are agitated. These stridulations can be made by both adult and young horned passalus (Pearse et al.
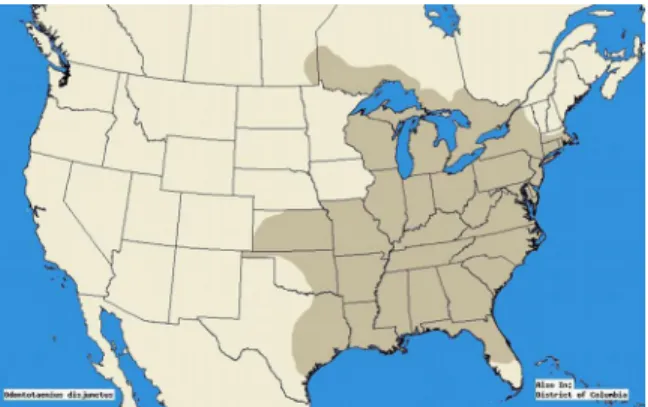
1936). Adult horned passalus are fairly dark and glossy with a large size of about 30- 40 mm and live up to about one year. As seen in Figure 2, they are known to reside mostly within North America over a wide range that encompasses areas including mid-Florida and from southern Texas to Nebraska (Bibbs 2010).
The horned passalus is a decomposer of wood. It uses its large mandibles to eat into fallen logs that it will use as its home. They tend to prefer hardwoods such as oaks or elms and are particularly sensitive to moisture levels, causing them to look for habitats that are very damp. These beetles play a key role in log
Figure 2. Distribution of the horned passalus in the United States
decomposition by ingesting wood pulp and expelling undigested remains known as frass. This frass is then targeted by fungi and bacteria, which will be consumed again and digested by the horned passalus. In this way, there is a beneficial relationship between beetles and microflora that aids in predigesting wood before it can be completely utilized by the beetles (Bibbs 2010).
Several individuals will gather in decomposing logs and compete for different spots so long as there is enough room. However, relationships within a population are surprisingly communal. A particularly interesting characteristic is that the horned passalus live in sub-social groups where family members all contribute to care for a new clutch of eggs. These eggs are large, about 3.7 by 3.2 mm, by the time they hatch. They are regularly transported throughout the wood in order to find and guard the best feeding grounds. The eggs are usually found in bunches and
surrounded by frass of the adults (Bibbs 2010). Pairs of adults will tend to the larvae once it hatches, and the larvae will feed on a mixture of frass and softened wood provided by the parents. Adult beetles are also territorial and protective of their habitats and young. However, they are also known to eat their own that are injured and immature (Bibbs 2010). A single log can accommodate multiple generations of
these beetles.
The horned passalus main mode of transportation is walking so they are slow moving organisms. As forest-dwelling invertebrates, they prefer moving through forest rather than open habitats; a study found that they were 14 times more likely to go by forests than open pastures (Jackson et al. 2009). This would suggest that for areas facing problems such as forest destruction and fragmentation, the horned passalus migration rates will decrease in response. Although these insects do posses wings, they use them very rarely. They could potentially use them for very short distances, but their wings have been mostly observed to function in nuptial flights (MacGown & MacGown 1996). Their slow movement, migration tendencies, and infrequent use of wings will have effects on the spatial locations and dispersal patterns of the horned passalus.
Hypothesis
Based on LGM climate conditions, their effect on the Appalachian mountains, and subsequent influence on the Southern Appalachians, predictions can be made concerning the spatial arrangement of horned passalus populations and levels of genetic diversity within them. Areas that retained forest habitats during the LGM would be considered locations of refuge for forest-dwelling species. Once glaciers retreated, recolonization would have taken place. Therefore, these refugia would contain older populations that have existed much longer than areas once covered by glaciers. The older populations should therefore contain a greater amount of genetic diversity due to the accumulation of DNA mutations and larger gene pool size, whereas younger populations elsewhere would be characterized by lower genetic
diversity containing subsets of the genetic diversity of older refuge populations (Provan & Bennett 2008). Following this line of thought, populations of lower genetic diversity will still bear a resemblance to older populations but may have genetic differences to other populations of similar ages due to processes such as the founder effect as a result of isolation from each other.
There are two possible patterns of genetic variation associated with two different scenarios. In the first scenario, the Southern Appalachians would have acted as a single, large, southern refuge, allowing viable populations of the horned passalus to survive. Once glaciers retreated and conditions returned to warmer climates similar to those of the present, the original population within the Southern Appalachians could repopulate the north, suggesting that older populations would be found in the south (Hewitt 1996). With consideration to the horned passalus’s incredibly slow movement, the age of populations should gradually decrease from south to north since subsets of southern populations would migrate and repopulate the Northern Appalachians very gradually. This could be verified by observing patterns in the genetic diversity within and between populations. Older populations should be characterized with greater genetic variation while differences between this diversity would incrementally increase in populations going further north. As such, increasing latitudes should correlate with decreasing diversity. However, populations would still have some degree of genetic similarities since subsets of the original population in the south would have moved northward.
A different historical scenario is also conceivable. Rather than having the oldest population taking refuge in the southernmost areas of this region, there is the
possibility that suitable habitats could be found scattered throughout the Southern Appalachians. Reasons for this line of thinking come from the fact that the
topography of northern regions become progressively more and more dissected and discontinuous. This would mean greater numbers of ravines and gullies that could provide a haven for forests, and thus the horned passalus could reside in suitable conditions despite being closer to the edge of ice sheets in the north. If this is the case, populations could be expected to contain similar levels of genetic diversity scattered throughout the region rather than concentrated only in the southernmost region. Furthermore, there would be little correlation between genetic diversity and latitude though closer populations should be more closely related compared to those further away. These two scenarios are summarized in Table 1.
The main goal of this study was to describe patterns of genetic diversity in the horned passalus beetle, and to determine which of the two alternative historical scenarios described above was most well supported. It is a preliminary investigation into the population genetics of this organism and should provide new insights into geographic and genetic patterns of an organism that is still not completely
understood. Results will point to directions needed for further investigations and assist in future research.
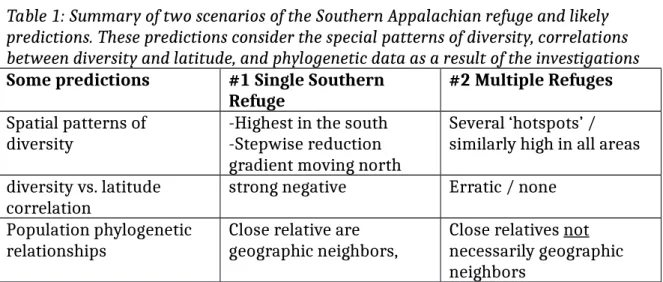
Table 1: Summary of two scenarios of the Southern Appalachian refuge and likely predictions. These predictions consider the special patterns of diversity, correlations between diversity and latitude, and phylogenetic data as a result of the investigations Some predictions #1 Single Southern
Refuge #2 Multiple Refuges
Spatial patterns of
diversity -Highest in the south
-Stepwise reduction gradient moving north
Several ‘hotspots’ / similarly high in all areas diversity vs. latitude
correlation strong negative Erratic / none
Population phylogenetic
relationships Close relative are
geographic neighbors, Close relatives not necessarily geographic neighbors
Methods and Materials Sample Information
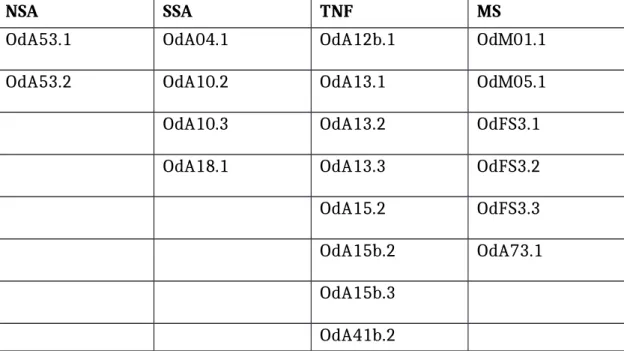
Table 2: List of sample names arranged according to geographical locations. NA refers to the northern part of the Southern Appalachians, SA refers to the southern part of the Southern Appalachians, TNF refers to Talladega National Forest, and MS refers to Mississippi.
NSA SSA TNF MS
OdA53.1 OdA04.1 OdA12b.1 OdM01.1
OdA53.2 OdA10.2 OdA13.1 OdM05.1
OdA10.3 OdA13.2 OdFS3.1
OdA18.1 OdA13.3 OdFS3.2
OdA15.2 OdFS3.3
OdA15b.2 OdA73.1
OdA15b.3 OdA41b.2
Table 2 gives a list of all individuals used in this research. A total of 13 logs and 20 individuals were sampled. Samples came from the following states:
Mississippi, Tennessee, Georgia, Alabama, and Virginia. They were collected by hand and stored in 95% ethanol. Each sample was given a name that contained
information of its location and relation to other individuals. Taking OdA04.1 as an example, Od stands for its scientific name Odontotaenius disjunctus; A stands for Appalachians; 04 refers to its log number; and 1 names it as the first individual
collected from this particular log. To further illustrate, OdA10.1 and OdA10.2 were two individuals from the same log, but OdA10.1 was found and collected first.
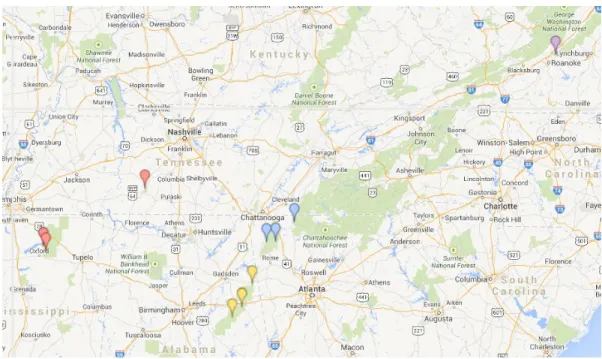
Individuals were arranged into four major groups based on their spatial location as illustrated in Figure 3. They include the northern part of the Southern Appalachians (NSA); the southern part of the Southern Appalachians (SSA);
Talladega National Forest, AL (TNF), and the University Mississippi field station and other areas in Oxford (MS). These groups were divided based on landscape features such as mountain chains or long distances that were thought to limit the movement of the horned passalus. Populations that were in closer proximity to each other were clustered together. A word of caution should be mentioned with regards to samples for the NSA group; genetic data were obtained only from two individuals from the same log. Given this very small sample size, conservative interpretation of results that relate to the NSA group is needed.
DNA Extraction
One leg from each beetle was used as a tissue sample in order to extract DNA. Extractions were carried out using the Qiagen DNeasy Blood & Tissue kit by implementing the protocols provided by the kit with a few minor adjustments, which were as follows. Before starting, the tissue sample was air-dried for approximately 45 minutes to make sure the ethanol, which preserved each organism, had completely evaporated. Each tissue sample was then manually crushed with a pestle. Step 2 of the protocol required the addition of 20 μL of proteinase K, mixing by vortex, and incubation at 56°C. This incubation was always
done overnight. In addition, the optional step in Step 2 of adding 4 μL of RNAse was
Figure 3. Map of sample locations. Sample groups were based on geographic landscape features that are expected to limited free movement of individual horned passalus beetles. Different colored icons refer to samples from specific regions and correlate with groupings from Table 1. Purple represents NSA, blue represents SSA, yellow represents TNF, and red refers to MS.
always completed before proceeding to step 3. In step 3, 200 μL of Buffer AL and 200 μL of ethanol were to be added to the sample. Since it was important that Buffer AL and ethanol be mixed immediately in order to yield a homogenous solution, the protocol recommended that Buffer AL and ethanol be premixed before adding them to the sample. This was not done, and to avoid delays smaller batches of samples were used. For step 6, the collection tube was always emptied and reused for
another centrifuge for one minute at 20,000 x g (14,000rpm) even if no carry-over of ethanol occurred. Steps 7 and 8 required an elution of either 200 μL or 100 μL of Buffer AE onto the DNeasy membrane, depending on whether higher concentration of DNA or greater yield of DNA was desired. This step was altered so that two
elutions of 65 μL of Buffer (a total of 130 μL) were done. Afterwards, samples were refrigerated and stored for future use.
Polymerase Chain Reaction (PCR)
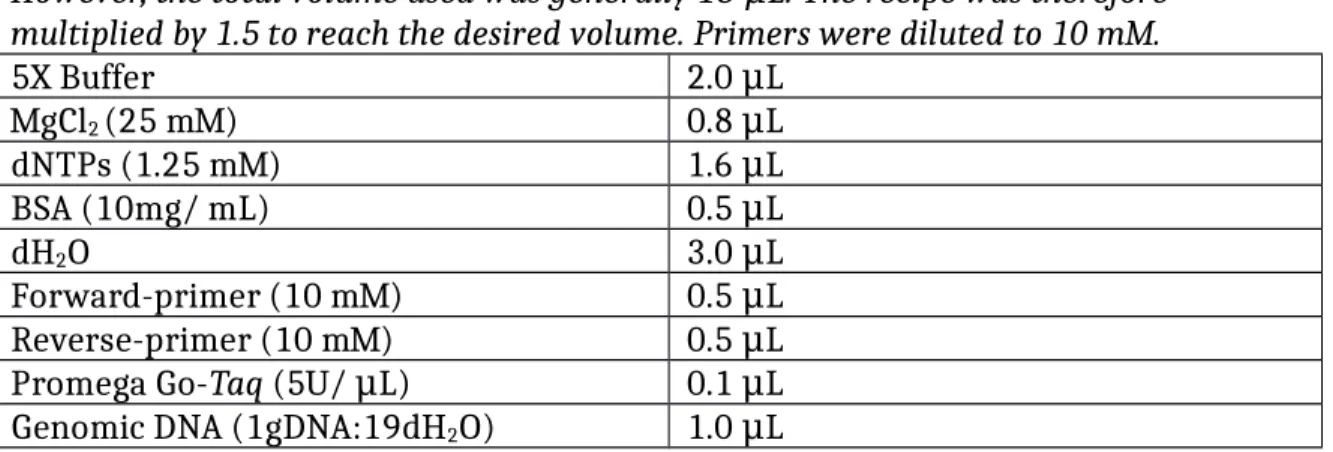
Once DNA was extracted from the sample, a Polymerase Chain Reaction (PCR) was run in order to amplify the targeted mitochondrial cytochrome oxidase I (COI) gene. First, the original genomic DNA from the DNA extraction was diluted at 1 DNA: 19 dH2O. This was done by adding 57 μL of dH2O to 3 μL of genomic DNA in a separate tube and mixing by vortex. Then a PCR master mix was made in one tube, which would later be added to each DNA sample. The recipe that was used produced a total volume of 10 μL and shown in Table 3. To achieve a total volume of 15 μL, each ingredient was multiplied by 1.5.
For mitochondrial DNA, the forward-primer was LCO (Folmer et al. 1994), and the reverse-primer was mdt11 (Simon et al. 1994). For the histone protein DNA, the forward-primer was H3A-F (5’-AGAAAATCCACCGGAGGG -3’; Garrick unpubl.), and the reverse-primer was H3A-R (5’-TATGGCGCACAAGTTCG -3’; Garrick unpubl.).
Primers were diluted to 10 mM. This mixture underwent PCR to amplify the desired genes. In some cases, PCR products were used instead of genomic DNA even after PCR was already accomplished. This is because occasionally the original genomic DNA was amplified too weakly so another round of PCR was done to increase these smaller yields. In addition, every PCR included a negative control, which had no DNA to ensure the absence of contamination.
A BioRad T100 Thermal Cycler was used as the PCR machine. Described in
Table 3. Recipe for10 μL of PCR mix. This recipe produced a total volume of 10 μL.
However, the total volume used was generally 15 μL. The recipe was therefore multiplied by 1.5 to reach the desired volume. Primers were diluted to 10 mM.
5X Buffer 2.0 μL
MgCl2 (25 mM) 0.8 μL
dNTPs (1.25 mM) 1.6 μL
BSA (10mg/ mL) 0.5 μL
dH2O 3.0 μL
Forward-primer (10 mM) 0.5 μL
Reverse-primer (10 mM) 0.5 μL
Promega Go-Taq (5U/ μL) 0.1 μL
Genomic DNA (1gDNA:19dH2O) 1.0 μL
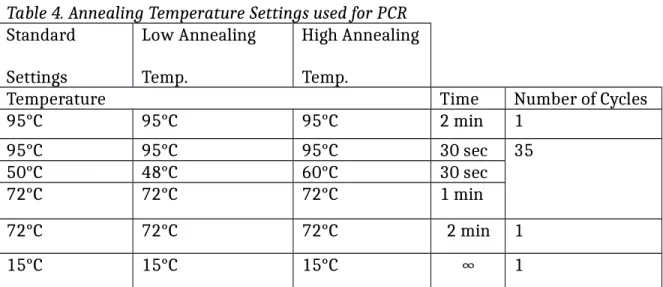
Table 4, three different settings were used for PCR: standard, low annealing
temperature, and high annealing temperature. The standard setting was used as the default. When genomic DNA showed little or no yield, a low annealing temperature was attempted to allow greater amplification despite the possible reduction of the fidelity of the copies. Usually, this resulted in enough yield to be sent for DNA sequencing. However, if there continued to be little yield, the PCR mixture
underwent PCR again but with a higher annealing temperature than before in an attempt to increase amplification of the desired gene.
Agarose gel electrophoresis
In order to confirm the amplification of the target genes, each PCR sample underwent agarose gel electrophoresis. To do so, 1.5% agarose gel was used with 2 μL of gel red stain. As a control for comparison, 5 μL of 100bp ladder was placed in
Table 4. Annealing Temperature Settings used for PCR Standard
Settings
Low Annealing Temp.
High Annealing Temp.
Temperature Time Number of Cycles
95°C 95°C 95°C 2 min 1
95°C 95°C 95°C 30 sec 35
50°C 48°C 60°C 30 sec
72°C 72°C 72°C 1 min
72°C 72°C 72°C 2 min 1
15°C 15°C 15°C ∞ 1
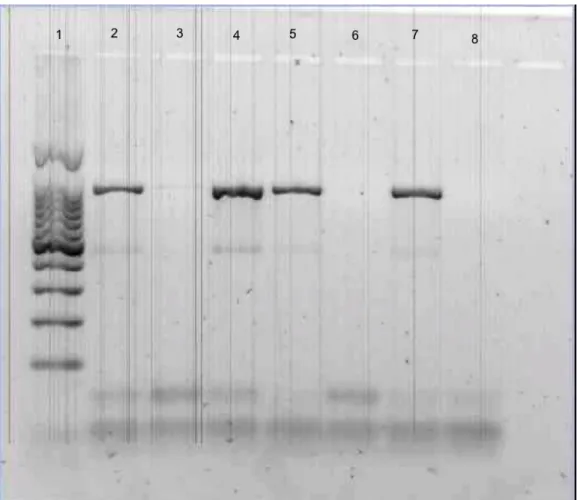
the leftmost lane. For each sample, 2.5 μL of loading dye mixed with 4 μL of PCR product were placed in the subsequent wells. The electrophoresis tank was plugged into the power pack, set at 100 volts, and run for approximately 45 minutes. An example of a gel image is provided in Figure 4.
DNA Sequencing and Editing
Once the image of the agarose gel confirmed the presence of amplified DNA, it was sent to Yale University for DNA sequencing. The equipment used to sequence DNA included Applied Biosystems 3730x/DNA Genetic Analyzer with 96-capillaries.
When results were returned to the lab, each chromatogram with the DNA sequences was checked by eye to ensure the accuracy of the sequences and to determine any readings using MEGA 4 software (Tamura et al. 2007). Some chromatograms had poor quality data and were therefore omitted from analyses.
For each DNA nucleotide position on a chromatogram, one of the following actions
Figure 4. Gel image of amplified CO1 gene. Column 1 was the DNA ladder. The dark bands around 900-bp in columns 2, 4, 5, and 7 confirmed the presence of PCR product.
Column 8 served as a control and exhibited no bands, indicating no signs of contamination. The last lane, which is not numbered, had no PCR product.
could be used: agree with the base call, replace a base, delete a base, insert a base, or mark as ambiguous. Ambiguities were marked with the letter n. Any base changes were indicated with the corresponding lower case letter in order to distinguish original sequencing from any alterations. The files were saved as .scf files. After examining each chromatogram, the sequences were added to the Alignment
Explorer window. After aligning the sequences, discrepancies and strange base calls could be rechecked and confirmed by comparing with other sequences.
Analysis of Genetic Data
The data was analyzed using MEGA 4 (Tamura et al. 2007), and DnaSP 5.10
(Librado & Rozas 2009), and Google Maps. In addition to editing chromatograms of the DNA sequences, MEGA 4 helped categorize genetically similar organisms sampled from different populations into distinct groups. The Alignment Explorer window with all of the sequences that was used previously was opened. The ends of the sequences were then cut off so that all sequences had the same number of base pairs. Any sequences that seemed odd or missing large chunks of nucleotide bases were deleted entirely from the database. These were exported into a MEGA format for further analysis.
A variety of analyses were done on this alignment file. First, a phylogenetic tree was constructed by using the Neighbor Joining function. The genetic distance measure was set at p-distance, and a bootstrap procedure with 500 replicates was used to assess support for inferred relationships on the tree. This allowed natural groupings of sample sequences with a bootstrap value of 70% set as a general standard for confidence in resulting groups. With this, the sequences from each beetle could be placed into groups by creating individual folders for each group using the Setup function in the Data window. These groupings were used to compute the genetic distances between individuals and within groups by computing pairwise distances in MEGA. Similar to previous analyses, the genetic distance was set to p- distance.
Comparisons related to spatial distribution of the sampled horned passalus beetles were achieved through Google Maps. Combining information from genetic analyses, samples were categorized into specific groups on the map and analyzed with data generated through the course of the research.
Results
Phylogenetic Trees
Phylogenetic trees were generated using DNA sequence data from the
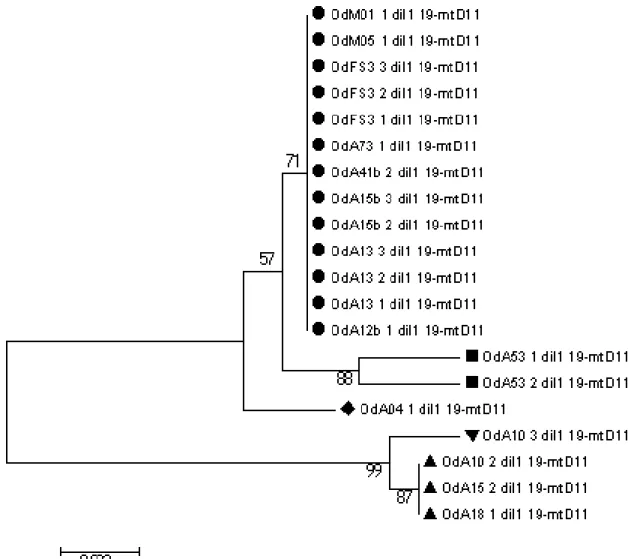
mitochondrial CO1 and nuclear H3A genes. Figure 3 shows the phylogenetic tree for the CO1 gene. All bootstrap values were above the chosen threshold value of 70%, with the exception of one value of 57%, which was cautiously accepted. Individuals were separated into five distinct genetic groups based on these results. Figure 5 shows the phylogenetic tree for the H3A gene. For this tree, bootstrap values were generally quite low, and only one branch had a value above the standard 70%.
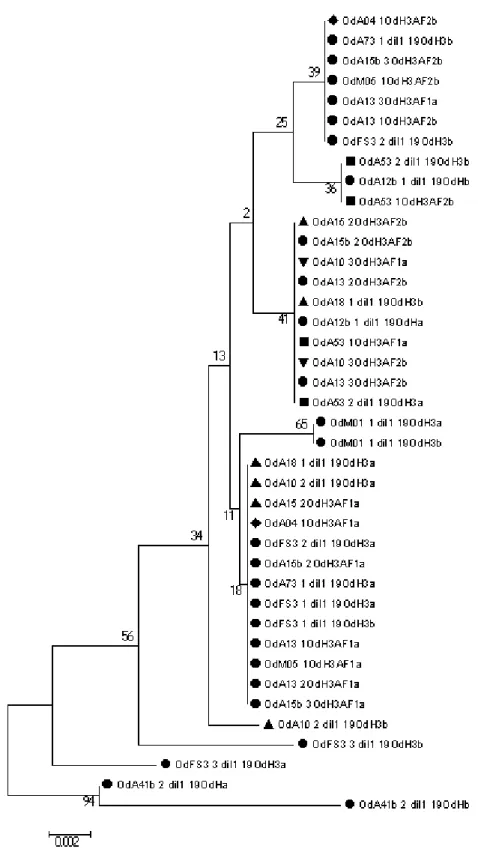
Genetic groupings from Figure 5 were applied to Figure 6 as symbols which appeared next to the names of the samples to enable direct comparison.
Phylogenetic trees were also interpreted in light of the geographic locations of each individual to see whether spatial location had any effect on genetic groups.
Figure 7 and Figure 8 shows a phylogenetic tree for the CO1 and H3A gene,
respectively, with additional symbols indicating each sample’s collection site based on the organization presented in Table 1. The CO1 phylogenetic tree showed that genetic similarity had a strong correlation with proximity of sampled populations.
For instance, the NSA group, which had only two individuals, formed its own separate branch. Individuals from regions closer together were more likely to be found in similar groups. As an example, the branch marked with (*) had individuals
from TNF and MS, which were fairly close to each other, and the branch marked with (+) had a mix of samples from SSA and TNF, which were also near.
Mean Genetic Distances
Tables 5-8 show the results of distance data of genetic information.
Populations were once again organized based on geographic groupings based on Table 2. Greater values indicate greater genetic distances or genetic diversity. Table 5 and Table 6 examine the mitochondrial CO1 gene. Table 5 contains calculations of the genetic distances within each group. The data showed SSA having the greatest genetic diversity within its populations, and MS had the least. Table 6 shows the genetic distances between different groups. The greatest genetic distance was seen between SSA and MS, and the least distance was exhibited between TNF and MS.
Table 7 and Table 8 were based on the nuclear H3A gene. Similar to Table 5 and Table 6, Table 7 shows genetic distances within each group while Table 8 shows distances between them. Results from these calculations were different from the ones generated by the CO1 gene. NSA and SSA were shown to have little to no genetic diversity within their populations, while MS had the greatest. In addition, genetic distances were greatest between NSA to SSA, NSA to TNF, and TNF to MS.
Lowest distances were observed between SSA and TNF and NSA and MS.
19
Figure 5. Phylogenetic tree of mitochondrial DNA sequences (CO1 gene). Each symbol designates a genetic group. Circles are Group 1, squares are Group 2, Diamonds are Group 3, inverted triangles are Group 4, and triangles are Group 5.
Figure 6. Phylogenetic tree of nuclear DNA sequences (H3A gene). Symbols correlate with designated genetic groups based on Figure 5. Circles are Group 1, squares are Group 2, Diamonds are Group 3, inverted triangles are Group 4, and triangles are Group 5.
Figure 7. Phylogenetic tree of CO1 gene based on geographic landscape features that are expected to limited free movement of individual horned passalus beetles.
Figure 8. Phylogenetic of H3A gene with based on geographic landscape features that are expected to limited free movement of individual horned passalus beetles.
Table 5. Within-group genetic distances based on the CO1 gene.
NSA 0.005
SSA 0.011
TNF 0.005
MS 0
Table 6. Between-group distances based on the CO1 gene
NSA SSA TNF MS
NSA
SSA 0.008
TNF 0.007 0.014
MS 0.005 0.015 0.002
Table 7. Within-group distances based on the H3A gene.
NSA 0
SSA 0
TNF 0.004
MS 0.003
Table 8. Between-group distances based on the H3A gene.
NSA SSA TNF MS
NSA
SSA 0.004
TNF 0.004 0.002
MS 0.002 0.003 0.004
Discussion
Confirmation of genetic transmission differences
Phylogenetic trees generated with DNA sequence data produced mixed results. The phylogenetic tree for CO1 resulted in clear, distinct genetic groupings with fairly high bootstrap values and its pattern is consistent with a pattern noted by Soltis et al. (2006) termed the Appalachian Mountain discontinuity in which there is a phylgeographical break between organisms within the Southern Appalachians and ones found further west. This is quite similar to results found for a variety of other species including, the spotted salamander, Ambystoma maculatum, and the Atlantic white cedar, Chamaecyparis thyoides (Soltis et al. 2006). On the other hand, the phylogenetic tree for H3A gave uncertain groupings, as reflected by very low bootstrap values. The numerous divisions and inconsistent groupings could be an indication of a high level of variation between the samples. Considering both the biparental mode of inheritance for nuclear genes as well as the expected high level of diversity resulting from refugia hypothesized to exist in SSA, this explanation would fit with data accrued from H3A.
Comparisons between Figure 5 and Figure 6 yield similar interpretations. The phylogenetic tree in Figure 5 was used to generate five distinct genetic groups. Each group was designated a specific shape and applied to Figure 6 in an attempt to organize information and reveal patterns. However, no clear trend could be
recognized. There was not a clear grouping of specific shapes within a certain branch of the phylogenetic tree in Figure 6; instead, groups encompassed a variety of shapes. While these comparisons do not seem to allow much meaningful
interpretation in connecting mitochondrial and nuclear genetic data, it does offer confirmation of certain aspects of the transmission patterns that would be expected in mitochondrial versus nuclear genes. The clear and distinct groupings of the mitochondrial CO1 gene from Figure 5 are characteristic of maternal inheritance patterns while the genetic dissimilarity and chaotic arrangements of the nuclear H3A gene from Figure 6 may reflect genetic contributions of both parents.
Genetic distances reveal level of diversity and population age
The within- and between-group distance calculations with the CO1 gene reported in Table 3 and Table 4 reflected trends that supported the idea that the Southern Appalachians functioned as a major refugium. SSA was shown to have the greatest distances within populations, suggesting that it may be the oldest
population. This is because populations remaining stable for long periods of time would exhibit genetic variety if allowed to persist at a certain mutation rate.
Populations founded as a result of migration to new locations would have had less time to exist and develop mutations, or carry only within them a subset of the genes from the original refugium population. Therefore, younger populations would exhibit smaller genetic distances within their population. This is clearly seen since SSA provides the greatest distance and therefore the oldest age.
In addition, its function as a refugium was further supported by the step-wise gradient of increasing genetic distances corresponding to greater distances.
Populations that were further away from SSA showed greater genetic differences.
The between-group distance between SSA and TNF was 0.015, which was less than the distance between SSA and MS, which was 0.017. This would be within the expectations of the research since populations that are further away would be predicted to be further removed from the genetic makeup of original populations from which newer populations had originated. It is curious to see NSA having closer genetic distances to TNF (0.007) and MS (0.004) than with SSA (0.008), but
interpretations may be skewed due to the extremely small sample size of NSA.
Interpretation of data based on nuclear H3A gene
The phylogenetic tree of the H3A gene seemed to suggest a high level of variability within genetic sequence data. As such, it would be expected that genetic distances within groups would be quite high or useful for observations of genetic diversity levels between groups. However, genetic distances for the H3A gene shown in Table 5 and Table 6 did not follow these predictions nor completely support the same findings as CO1. Instead of SSA, TNF was found to have the greatest within- group distance of 0.004 while SSA and NSA had a value of 0. On the other hand, genetic distances between groups continued to increase for SSA with greater
geographical distances. The genetic distance between SSA and TNF was 0.002 while the distance between SSA and MS was 0.003. However, greater distances from MS showed the opposite trend so that, as before, genetic distances to TNF (0.004) and to SSA (0.003) were greater than to NSA (0.002), which was furthest away.
The inconsistency of within-group genetic distances between SSA from CO1 and H3A sequence data as well as the opposing trend of the gradient of genetic
differences from MS to NSA seem to indicate limitations of using the H3A gene as a genetic marker to measure population genetic diversity. The conflicting data may be the result of high selective pressure on the functionally important histone gene. In general, it is usually best to choose markers of either little importance or with non- coding regions that do not normally undergo such selective pressure. However, because this is only a preliminary investigation into the horned passalus, it is notable that the H3A gene marker had been used on a number of invertebrates successfully before the course of this research (Lo et al. 2000). As such, the gene seemed like a good candidate as a marker for nuclear gene. It must be mentioned that it is too early to discard this marker. A number of other analyses are available for this sequence data, and it would be worthwhile to see if this data generates any new insights.
Future direction of research
These preliminary investigations have yielded a number of important findings. Interpretations of data generated by the CO1 gene have supported the general idea that the Southern Appalachians served as a refugium for the horned passalus in LGM conditions. In addition, the step-wise gradient of genetic distances between groups seemed to support the idea that SSA provided a large refugium from which populations arose through migration from SSA as opposed to having pockets of refugia scattered throughout the region.
However, the investigation still has a great deal of potential. As a study on the habitat-specific movement of the horned passalus points out, information on
saproxylic insects is quite limited (Jackson et al. 2013). It is clear that a greater
number of samples must be sequenced, especially from the NSA region. Bolstering the findings of this research with a greater wealth of data could prove useful in either further support or a modified understanding of the function of the Southern Appalachians as a refugium. Different analyses could be conducted to gain further information from genetic sequence data. In addition, the phylogenetic tree can be used to compare with others generated from a variety of different sources. Some possibilities of this include using a different nuclear marker considered to have less selection pressure or even the genetic information of a number of different
organisms residing within or in close proximity to the horned passalus. These include the yeast found within the gut of these insects that aid in the digestion of wood and frass (Sung-Oui et al. 2003) as well as the mites found on the surface of the horned passalus. Comparisons using the existing phylogenetic trees with data generated from a new marker or organism could yield further information about the population genetics of the horned passalus.
Bibliography
Avise JC (2000) Phylogeography: The History and Formation of Species. Cambridge University Press, USA.
Bibbs C, Hodges A, Baldwin R (2010) Horned Passalus, Odontotaenius
disjunctus (Illiger) (Insecta: Coleoptera: Passiladae: Passalinae). University of Florida publication number EENY-487.
Folmer, O, Black M, Hoeh W, Lutz R, Vrijenhoek R (1994) DNA primers for
amplification of mitochondrial cytochrome c oxidase subunit I from diverse metazoan invertebrates. Molecular Marine Biology and Biotechnology, 3, 294- 299.
Hewitt GM (1996). Some genetic consequences of ice ages, and their role in
divergence and speciation. Biological Journal of the Linnean Society, 58, 247- 276.
Holderegger R, Thiel-Egenter C (2009). A Discussion Of Different Types Of Glacial Refugia Used In Mountain Biogeography And Phylogeography. Journal of Biogeography, 36, 476-480.
Jackson, H. B., Zeccarias, A., & Cronin, J. T. (2013). Mechanisms driving the density–
area relationship in a saproxylic beetle. Oecologia, 173(4), 1237-1247.
Librado, P. and Rozas, J. (2009). DnaSP v5: A software for comprehensive analysis of DNA polymorphism data. Bioinformatics 25: 1451-1452.
Lo N, Tokuda G, Watanabe H, Rose H, Slaytor M, Maekawa K, Bandi C, Noda H (2000) Evidence from multiple gene sequences indicates that termites evolved from wood-feeding cockroaches. Current Biology, 10, 801-804.
MacGown J, MacGown M. (1996) Observation of Nuptial Flight of the Horned Passalus Beetle, Odontaenius disjunctis (Illeger) (Coleoptera: Passalidae. The Coleopterists Bulletin, 50, 201-203.
Pickering J, Kays R, Meier A, Andrew S, Yaskievych K (2002) The Appalachians. In:
Wilderness – Earth’s Last Wild Places. pp 458-467. Conservation International (ISBN-13: 978-9686397697).
Tamura K, Dudley J, Nei M, Kumar S (2007) MEGA4: Molecular Evolutionary Genetics Analysis (MEGA) software version 4.0. Molecular Biology and Evolution, 24:1596-1599.
Simon C, Frati F, Beckenbach A, Crespi B, Liu H, Flook P (1994) Evolution, weighting, and phylogenetic utility of mitochondrial gene sequences and a compilation of conserved polymerase chain reaction primers. Annals of the Entomological Society of America, 87, 651-701.
Soltis D, Morris A, McLachlan J, Manos P, Soltis P (2006) Comparative
phylogeography of unglaciated eastern North America. Molecular Ecology, 15, 4261-4293.
Sung-Oui, S., Marshall, C. J., McHugh, J. V., & Blackwell, M. (2003). Wood ingestion by passalid beetles in the presence of xylose-fermenting gut yeasts. Molecular Ecology, 12, 3137.