Product Specification:
Distributed Trust Model System
Development of an Energy Services Interface for the EGoT
WORK PERFORMED UNDER AGREEMENT DE-OE0000922
Portland State University 1900 SW 4th Ave Portland, OR 97201
Period of Performance: 7/13/2020 to 9/30/2023
Submitted: January 4, 2024 Revision: 1.0
PRINCIPAL INVESTIGATOR Robert Bass, Ph.D.
503-725-3806 [email protected]
BUSINESS CONTACT Patti Fylling 503-725-6584 [email protected]
SUBMITTED TO U. S. Department of Energy National Energy Technology Laboratory
DOE Project Officer: Mario Sciulli
This report does not contain any proprietary, business sensitive, or other information not subject to public release.
Product Specification:
Distributed Trust Model System
This material is based upon work supported by the Department of Energy under Award Number DE-OE0000922.
Disclaimer:This report was prepared as an account of work sponsored by an agency of the United States Government. Neither the United States Government nor any agency thereof, nor any of their employees, makes any warranty, express or implied, or assumes any legal liability or responsibility for the accuracy, completeness, or usefulness of any information, apparatus, product, or process disclosed, or represents that its use would not infringe privately owned rights. Reference herein to any specific commercial product, process, or service by trade name, trademark, manufacturer, or otherwise does not necessarily constitute or imply its endorsement,
recommendation, or favoring by the United States Government or any agency thereof. The views and opinions of authors expressed herein do not necessarily state or reflect those of the United States Government or any agency
Revision History
Date Version Description Author
6/1/21 1.0 Document creation R. Bass
6/4/21 1.1 Added DTM System actor definition and functionality
A. Barghouti, J.M. Acken
6/21/21 1.2 Removed irrelevant items. J.M. Acken
6/23/21 1.3 Added bullets for Product requirements J.M. Acken 6/24/21 1.4 Inserted some clarification questions, fixed
some DTM -> DTM System
A. Barghouti, S. Fernando, J.M.
Acken 7/9/21 1.5 Added CDTA Operation and DTM Client
sections under the Implementation section
A. Barghouti 7/16/21 1.6 Fixed/deleted some Acronyms, reread
whole document, fixed small things
J. M. Acken 7/23/21 1.7 Fixed DTM->DTMC, some other fixes,
added table labels. Review and edits.
A. Barghouti, S. Fernando, J.M.
Acken, M. Alsaid, G. Spitzer, R.Bass
7/26/21 1.8 Updated the hypothesis testing section.
Added Appendix A and B.
S. Fernando 8/9/21 1.9 Added product requirements. Updated
sections 2.3.1 and 3. Diagrams added.
Draft sent to project partners.
A. Barghouti, S. Fernando, J.M.
Acken
9/2/21 2.0 Revisions from project partner reviews A. Barghouti, S. Fernando, M.
Alsaid, J.M. Acken
9/14/21 2.1 Revision review R. Bass, A. Barghouti, S.
Fernando 9/15/21 2.2 Product requirements revised after test
plan development.
A. Barghouti, S. Fernando, M.
Alsaid, J.M. Acken. G. Spitzer
9/15/21 2.3 Final Version R. Bass, A. Barghouti
5/17/22 3.0 Minor revisions A. Barghouti, M. Alsaid
5/29/22 3.1 Minor revision M. Alsaid, A. Barghouti
6/9/22 3.2 Revision review R. Bass
6/23/22 3.3 Updated definitions, move Acronym section R. Bass 7/8/22 3.4 Move Sect 4 to App C. Update Fig 1.1.
Added sequence diagram to Sect 3.2
R. Bass
8/8/22 3.5 Depreciated CDTA01 R. Bass
5/3/23 3.6 Added k-Anonymity content. Added DTM-System Message flow diagram and description
R. Bass, S. Fernando
9/25/23 3.7 Grid-DER Services terminology: Energy and Blackstart services, related reference.
R. Bass 10/18/23 3.8 Added figures: dashboard data, hypothesis
tool statistics, DTM sequence diagram
S. Fernando
12/15/23 4.0 Final Review R. Bass, S. Fernando
Product Specification:
Distributed Trust Model System
Acronyms 4
1 Introduction 5
1.1 Participants & Definitions 6
1.1.1 Functionalities and Responsibilities 7
1.1.2 Definitions 9
2 DTM System Architecture 10
2.1 DTMC at SPC 11
2.2 CDTA 11
2.2.1 Dashboard 11
2.2.2 Threshold Setting for Sending Alerts 12
2.2.3 Hypothesis Testing 13
2.2.4 Tool for Threshold Setting and Equation Analysis 14
2.3 Prototype Architecture Components 16
2.3.1 Trust Model Data Generator 16
2.3.2 Trust Model Simulator 16
2.4 DTM System Message Flow 16
3 Implementation Summary 19
3.1 CDTA Operation 20
3.2 DTM Client 20
3.3 Anonymizing DER Topological Locations 23
3.4 Scalability Testing 25
Appendix A MVoT Variables and Equations 27
Appendix B Hypothesis Testing Keywords 31
Appendix C Product Requirements 32
C.1 DTM System Product Requirements 32
C.2 DTMC Product Requirements 32
C.3 CDTA Product Requirements 33
C.4 DCM Product Requirements 33
Acronyms
CDTA Central Distributed Trust Aggregator
CSV Comma Separated Value
DCM Distributed Control Module DER Distributed Energy Resource DERMS DER Management System DTM Distributed Trust Model DTMC Distributed Trust Model Client
EER Equal Error Rate
EGoT Energy Grid of Things ESI Energy Services Interface
FN False Negative
FNR False Negative Rate
FP False Positive
FPR False Positive Rate
GO Grid Operator
GSP Grid Service Provider
HTTPS Hypertext Transfer Protocol Secure
IEEE Institute of Electrical and Electronics Engineers MVoT Metric Vector of Trust
SPC Service-Provisioning Customer TLS Transport Layer Security
TM Trust Monitor
TN True Negative
TP True Positive
UCM Universal Communication Module XML Extensible Markup Language
1 Introduction
Information exchange between actors in an EGoT (Energy Grid of Things) System is governed by a set of policies at a virtual point in the system known as the Energy Services Interface (ESI). The ESI ensures secure, trustworthy information exchange between Grid Service Providers (GSPs) and Service Provisioning Customers (SPCs) in order to promote dispatch of grid services to a Grid Operator (GO) through large-scale aggregation of Distributed Energy Resources (DER). The ESI does so by providing a set of rules that define bi-directional, service-oriented, logical interfaces with expectations for privacy, security, and trust.
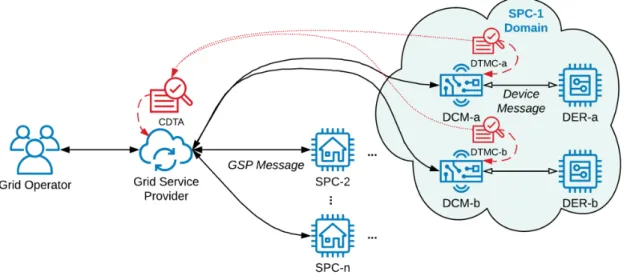
The Distributed Trust Model (DTM) System is a supervisory component within the EGoT system. The DTM System components are shown as red elements within Figure 1, while EGoT System actors are shown as blue elements. The role of the DTM System is to implement the trust aspects of the ESI. The DTM System augments existing security measures by monitoring the communication between the various EGoT System actors and quantifying metrics of trust of each actor. The system consists of two types of actors: a Central Distributed Trust Aggregator (CDTA), located at the GSP, and numerous DTM Clients (DTMC), located along with the Distributed Control Modules (DCM) at each of the Service Provision Customers (SPC).
Figure 1.1The DTM System (red elements) monitors information exchange between actors of the EGoT System (blue elements) in order to make probabilistic determinations about the trustworthiness of the system actors.
This document depends upon concepts described in the EGoT Implementation Profile ,1 aspects of which may or may not be duplicated here. For example, not discussed is the EGoT information exchange architecture of a GSP communicating with multiple SPCs, each of which owning one or more DER. Rather, this document serves as a product specification for the DTM System, and describes how the DTM System would be implemented with an EGoT System in order to provide trustworthiness to that EGoT System, supplemental to the security measures required by the IEEE 2030.5 protocol.
1.1 Participants & Definitions
Tables 1.2 through 1.4 present the main participants that will interact through information exchange to enable the dispatch of DER in order to provide grid services. The number of participants will vary depending on the Use Case.
Participants are classified asActors, which are persons or other external systems;
Collaborative Objects, which include interacting components other than Actors; and Products, which are the Collaborative Objects to be developed for this project.
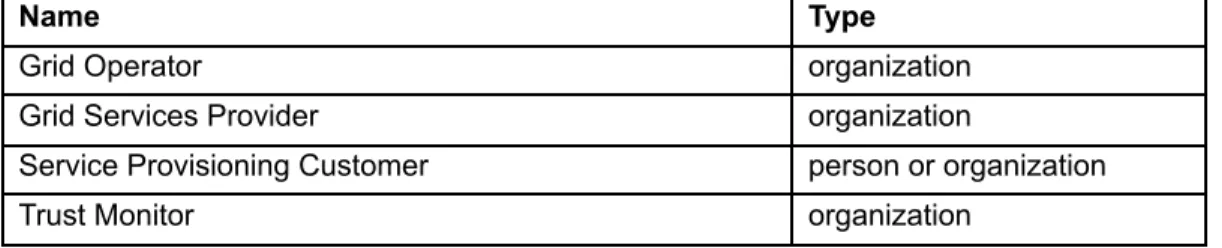
Table 1.2Actors relevant to the DTM System.
Name Type
Grid Operator organization
Grid Services Provider organization
Service Provisioning Customer person or organization
Trust Monitor organization
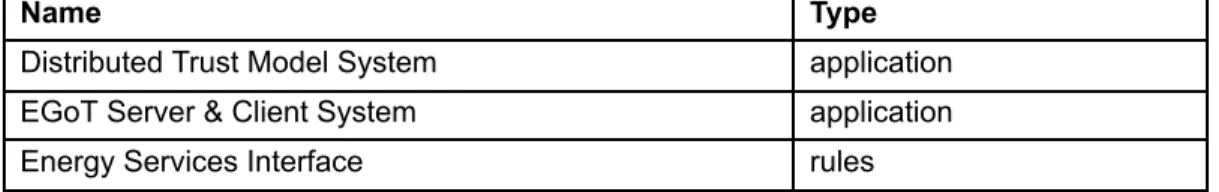
Table 1.3Products relevant to the DTM System.
Name Type
Distributed Trust Model System application
EGoT Server & Client System application
Energy Services Interface rules
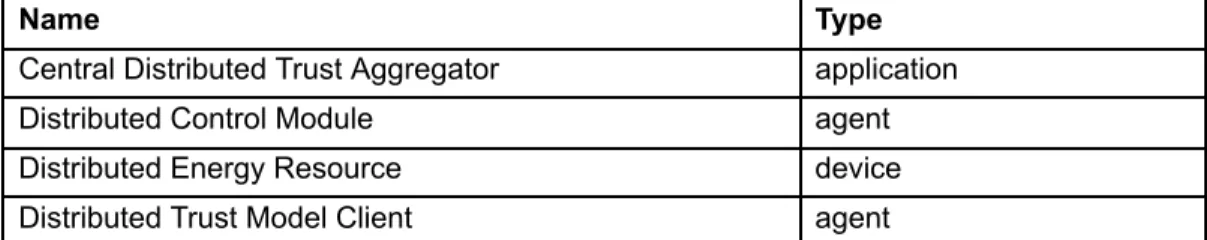
Table 1.4Collaborative objects relevant to the DTM System.
Name Type
Central Distributed Trust Aggregator application
Distributed Control Module agent
Distributed Energy Resource device
Distributed Trust Model Client agent
1Implementation Profile: EGoT DERMS Server/Client System, Portland State University, PSU-ECE DOE-01, 2023
1.1.1 Functionalities and Responsibilities
This subsection presents the functionalities and responsibilities of the system actors and products that pertain to the DTM System as well as the EGoT System to which it is applied.
Actors
Table 1.5Grid Operator (GO)
Functionality A GO seeks grid services from GSPs in order to achieve
operational objectives, which are 1) maintaining operations within the physical constraints that must be honored in order to prevent damage to grid components and equipment, or 2) operational goals associated with stable, reliable, economical delivery of power at nominal conditions.
Responsibilities ● Engage with GSPs to acquire grid services to achieve operational objectives.
● Design and fund incentive programs to attract GSP and/or SPC participation to implement operational objectives.
● Provide DER topological assignment information during the DER registration process
Table 1.6Grid Service Provider (GSP)
Functionality A GSP provides grid services to a GO through the dispatch of DER that have subscribed to a GO program. Aggregation and dispatch are achieved using a DERMS. Grid services are the means by which a GO achieves operational objectives.
Responsibilities ● Provide grid services to GOs.
● Evaluate its aggregation of DER assets to determine a menu of grid services to offer to GOs, prioritized based on the priority operational objectives of GOs.
● Entice SPCs to subscribe to DER aggregation programs
● Exchange information according to the EGoT Server/client Implementation Profile.
Table 1.7Service Provisioning Customer
Functionality An SPC is a electric utility customer who owns one or more devices that can serve as a DER, and who is interested in providing those DER to a GSP through an aggregation program.
Responsibilities ● Subscribe to GO or GSP programs so that their DERs can be managed in order to provide value to the grid.
● Ensure their DERs are available to request services from GPSs
● Communicate prioritized operational objectives with the GO.
Products
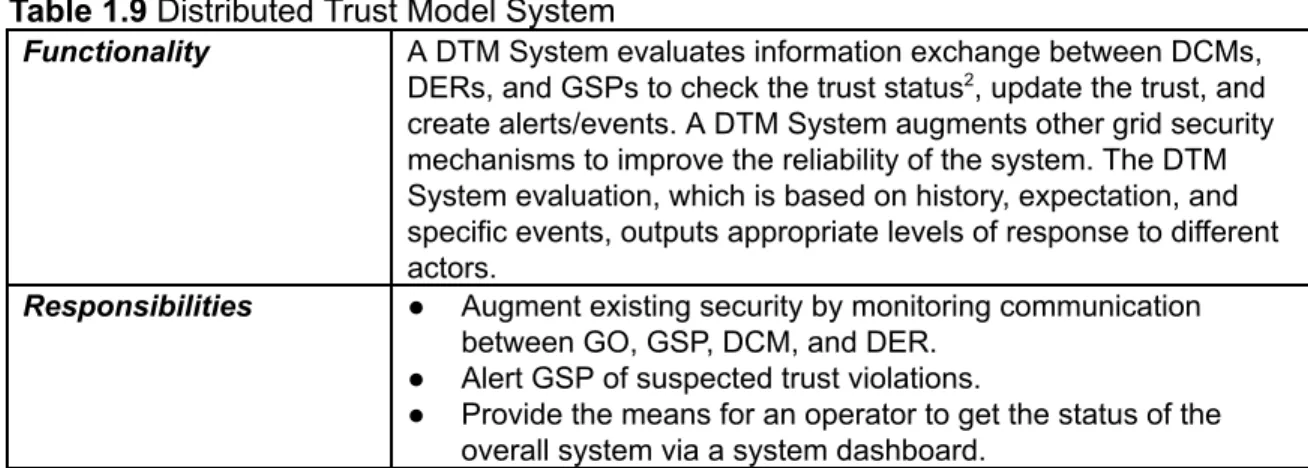
Table 1.9Distributed Trust Model System
Functionality A DTM System evaluates information exchange between DCMs, DERs, and GSPs to check the trust status , update the trust, and2 create alerts/events. A DTM System augments other grid security mechanisms to improve the reliability of the system. The DTM System evaluation, which is based on history, expectation, and specific events, outputs appropriate levels of response to different actors.
Responsibilities ● Augment existing security by monitoring communication between GO, GSP, DCM, and DER.
● Alert GSP of suspected trust violations.
● Provide the means for an operator to get the status of the overall system via a system dashboard.
Table 1.10EGoT Server/Client System
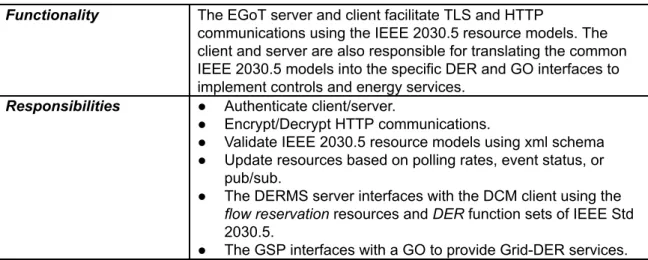
Functionality The EGoT server and client facilitate TLS and HTTP
communications using the IEEE 2030.5 resource models. The client and server are also responsible for translating the common IEEE 2030.5 models into the specific DER and GO interfaces to implement controls and energy services.
Responsibilities ● Authenticate client/server.
● Encrypt/Decrypt HTTP communications.
● Validate IEEE 2030.5 resource models using xml schema
● Update resources based on polling rates, event status, or pub/sub.
● The DERMS server interfaces with the DCM client using the flow reservationresources andDERfunction sets of IEEE Std 2030.5.
● The GSP interfaces with a GO to provide Grid-DER services.
2“Trust” is a defined output of the model. It is explained in Section 2
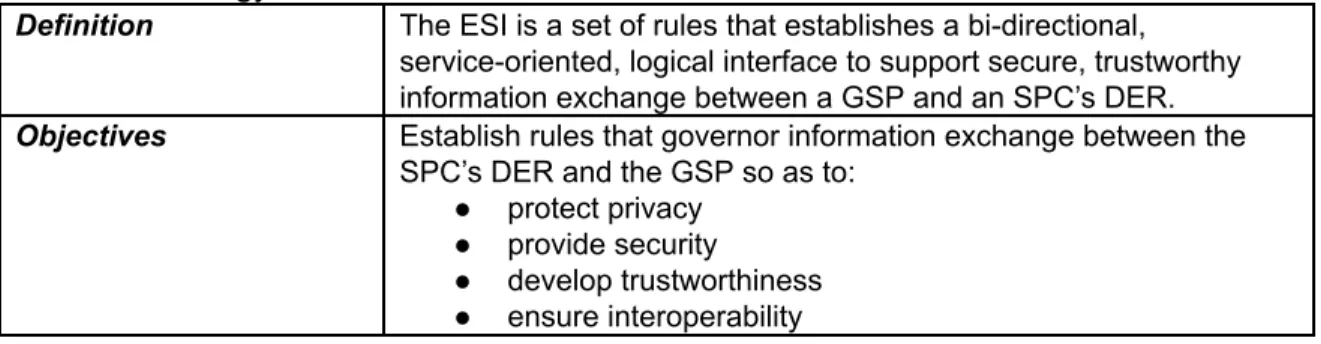
Table 1.11Energy Services Interface3
Definition The ESI is a set of rules that establishes a bi-directional, service-oriented, logical interface to support secure, trustworthy information exchange between a GSP and an SPC’s DER.
Objectives Establish rules that governor information exchange between the SPC’s DER and the GSP so as to:
● protect privacy
● provide security
● develop trustworthiness
● ensure interoperability
1.1.2 Definitions
Below are definitions of several collaborative objects that are required to properly interpret this document.
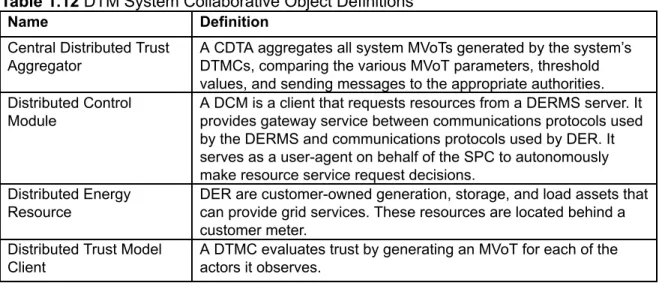
Table 1.12DTM System Collaborative Object Definitions
Name Definition
Central Distributed Trust Aggregator
A CDTA aggregates all system MVoTs generated by the system’s DTMCs, comparing the various MVoT parameters, threshold values, and sending messages to the appropriate authorities.
Distributed Control Module
A DCM is a client that requests resources from a DERMS server. It provides gateway service between communications protocols used by the DERMS and communications protocols used by DER. It serves as a user-agent on behalf of the SPC to autonomously make resource service request decisions.
Distributed Energy Resource
DER are customer-owned generation, storage, and load assets that can provide grid services. These resources are located behind a customer meter.
Distributed Trust Model Client
A DTMC evaluates trust by generating an MVoT for each of the actors it observes.
3Much of the wording for our ESI definition derives from the Grid Modernization Laboratory Consortium (GMLC) work on defining an ESI.
2 DTM System Architecture
The Distributed Trust Model (DTM) System is a supervisory component within the EGoT system. The DTM System augments existing security measures by monitoring the
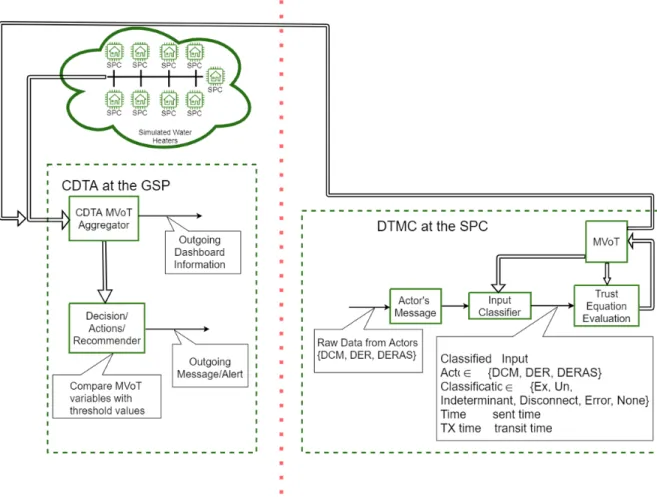
communication between various energy grid actors and quantifying metrics of trust of each actor. The system consists of two types of actors: a Central Distributed Trust Aggregator (CDTA), located at the GSP, and numerous DTM Clients (DTMC), located along with the Distributed Control Modules (DCM) at each of the Service Provision Customers (SPC), as4 depicted in Figure 2.1. The CDTA is depicted on the left side of the red line in Figure 2.1, and a DTMC is depicted on the right.
Figure 2.1The components of the DTM System include the CDTA (right side), located at the GSP, and the DTM Clients located at each SPC (left side).
The DTM System represents the evaluation of messages using a Metric Vector of Trust (MVoT). Each actor within the DTM System maintains an MVoT for each of the EGoT actors that communicate with its host. Consider the DTMC on the right side of Figure 2.1;
this DTMC is paired with a DCM, which communicates with its DER and the GSP. So, this
4SeeProduct Specification: Distributed Control Module, Portland State University, PSU-ECE DOE-04, 2023
DTMC will maintain three MVoTs, one for each of these actors: the DCM, its DER, and the GSP.
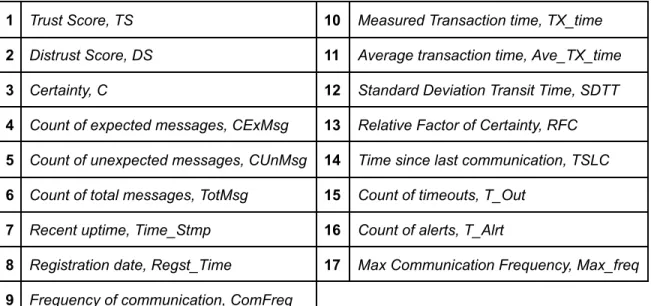
The DTM System evaluates the participating actors and quantifies 17 parameters such as trust, distrust, and certainty using the MVoT. The Metric Vector of Trust (MVoT) parameters are presented in Table 2.1. Definitions and equations for each of these are provided in Appendix A.
Table 2.1The parameters within the Metric Vector of Trust
1 Trust Score, TS 10 Measured Transaction time, TX_time 2 Distrust Score, DS 11 Average transaction time, Ave_TX_time
3 Certainty, C 12 Standard Deviation Transit Time, SDTT
4 Count of expected messages, CExMsg 13 Relative Factor of Certainty, RFC 5 Count of unexpected messages, CUnMsg 14 Time since last communication, TSLC 6 Count of total messages, TotMsg 15 Count of timeouts, T_Out
7 Recent uptime, Time_Stmp 16 Count of alerts, T_Alrt
8 Registration date, Regst_Time 17 Max Communication Frequency, Max_freq 9 Frequency of communication, ComFreq
2.1 DTMC at SPC
For the current prototype iteration of the EGoT System, each SPC has one DER, and each DER is controlled by a DCM. This DCM is monitored by a DTMC. Hardware versions of this DTMC will be collocated with the DCM within a common package, called the Universal Communication Module (UCM). The UCM physically attaches to the DER.
The DTMC at the SPC is responsible for classifying, evaluating, and populating the MVoT parameters based on information exchange between the DCM, its DER, and the GSP.
Each DTMC at the SPC monitors the data streams between these three actors. As such, the DTMC maintains an MVoT for each of these actors.
2.2 CDTA
The CDTA is responsible for aggregating all system MVoTs, comparing the various MVoT parameters with threshold values, and sending messages/alerts to the appropriate authorities.
2.2.1 Dashboard
The CDTA includes a dashboard that presents data plots to allow an operator to get system status at a glance. The dashboard allows the operator to better conceptualize the behavior of all actors within the DTM System.
The dashboard, as shown in Figure 2.2, supports the following plots:
● Raw Trust Score Vs. Time
● Raw Trust Score Cumulative Distribution Function for a specific hour
● Raw Distrust Score Vs. Time
● Raw Distrust Score Cumulative Distribution Function for a specific hour
● Time Since Last Communication values Vs. Time
● Time Since Last Communication values Cumulative Distribution Function for a specific hour
Figure 2.2The DTM Dashboard consists of CDF charts for TS, DS, and TSLC data for each hour (located in the top row) and time-based plots (located in the bottom row).
2.2.2 Threshold Setting for Sending Alerts
To ensure accurate notifications of system abnormalities, the CDTA incorporates a list of thresholds that must be met before raising an alert. The following list provides example messages that the CDTA may provide to its GSP if thresholds are exceeded:
● “Excessive time since last communication from GSP for N SPCs”
● “Excessive time since last communication from DER for N SPCs”
● “Trust is low for GSP from N SPCs”
● “Trust is low for DCM for N SPCs”
● “Trust is low for DER for N SPCs”
● “Trust is low for DTMC, self assessment for N SPCs”
● “Communication rate is low from GSP for N SPCs”
● “Communication rate is low from DER for N SPCs”
● “Communication rate is low for DCM for N SPCs”
● “Communication rate is excessive from GSP for N SPCs, possible DoS”
● “Communication rate is excessive from DER for N SPCs, possible DoS”
● “Communication rate is excessive for DCM for N SPCs, possible DoS”
● “Slow transit time for messages from GSP for N SPCs”
● “Message count discrepancy for each MVoT value except: expected message count, message time Stamp, registration date, time out count, count of alert)”
2.2.3 Hypothesis Testing
The purpose of applying statistical hypothesis testing is to set the count and value
thresholds for the 17 parameters of the MVoT. Hypothesis testing also provides means for assessing performance of the CDTA, and for adjusting count and value thresholds to improve CDTA performance on its ability to alert the GSP.
Statistical methods provide a means for evaluating alert messaging performance of the CDTA, specifically the ability of the CDTA to decide between two hypotheses. The two hypotheses are thenull hypothesisand thealternative hypothesis. For example:
Positive: the CDTA sends an alert to the GSP
Negative: the CDTA does not send an alert to the GSP.
The four possible outcomes are:
● True Positive (TP) —the CDTA sends an alert to the GSP for an event where an alert rightfully should be sent out.
● True Negative (TN) —the CDTA did not send an alert to the GSP for an event where an alert rightfully should not be sent out.
● False Positive (FP) —the CDTA sends an alert to the GSP for an event where an alert rightfully should not be sent out since there are no attacks.
● False Negative (FN) —the CDTA did not send an alert to the GSP for an event where it should not have due to the absence of attacks.
The Statistical methods for evaluation that use the above outcomes include:
● Equal Error Rate (EER): EER derives from the FPR (False Positive Rate), False Negative Rate (FNR). EER is the error rate when the FPR equals the FNR.
○ FPR represents the CDTA's failure to send an alert to the GSP in case of an attack.
𝐹𝑃𝑅 =
𝐹𝑃 + 𝑇𝑁𝐹𝑃○ FNR represents the CDTA alerting the GSP when there is no attack.
𝐹𝑁𝑅 =
𝐹𝑁 + 𝑇𝑃𝐹𝑁● Sensitivity is the ratio of the total count of alerts sent out by the CDTA versus all the alerts that the CDTA should send.
𝑆𝑒𝑛𝑠𝑖𝑡𝑖𝑣𝑖𝑡𝑦 =
𝑇𝑃 + 𝐹𝑁𝑇𝑃● F-1 score presents the likelihood that the CDTA accurately sends an alert to the GSP out of all the messages sent to the GSP vs. all the alerts sent compared to the alerts that should be sent to the GSP.
𝐹1 𝑠𝑐𝑜𝑟𝑒 = 2 ×
𝑇𝑃 +0.5×(𝐹𝑃+𝐹𝑁)𝐹𝑃2.2.4 Tool for Threshold Setting and Equation Analysis
Different applications and environments will have different thresholds used to determine when alerts are to be sent. A tool for analyzing MVoT equations and their thresholds uses the aforementioned hypothesis testing. This tool uses data from the CDTA MVoT
Aggregator of the EGoT for the evaluation. We first implemented the tool within a Microsoft Excel spreadsheet. The tool generates plots based on the statistical analysis to show the effects of the thresholds and equations for sending alerts based upon CDTA MVoT
Aggregator. Next, we transformed the hypothesis tool to a python script and generated an html page that displays the statistical analysis plots. These plots consist of FNR and FPR curves to show EER, F1 score, sensitivity, accuracy, specificity, precision and false
discovery. These plots can be generated for a range of value threshold and count threshold. Plots generated by hypothesis testing tool with FNR and FPR, F1 score and sensitivity are shown in Figures 2.3 to 2.5.
Figure 2.3 The result generated by the hypothesis testing tool, EER, shows the relationship between the FNR and FPR of the trust score for a threshold value of 59.85 while the count threshold increases from zero to 30.
Figure 2.4 The output of hypothesis testing tool showing the sensitivity rate of TS with a value threshold of 59.85 as the count threshold increases from 0 to 30.
Figure 2.5 The output of the hypothesis testing tool showing the F-1 score of TS with a value threshold of 59.85 as the count threshold increases from 0 to 30.
2.3 Prototype Architecture Components
Since the DTM System is currently in a prototype phase, the DTM system architecture also includes components that facilitate test data creation and simulation. These are the Trust Model Data Generator and the Trust Model Simulator, discussed below.
2.3.1 Trust Model Data Generator
The trust model data generator is a Python script for generating test data. This was needed due to limited data availability and the need for readily-available data sets. This Trust Model Data Generator supports multiple profiles as well as user-specified number of data points and time increments. The output is a CSV file, which includes an actor’s name, message evaluation category, transit time, and the current time.
Developed profiles include:
● All expected: This profile generates only expected data
● All unexpected: This profile generates only unexpected data
● Almost_good: This profile generates expected messages until a user-specified threshold is reached, in which case it switches to unexpected messages.
● Almost_bad: This profile generates unexpected messages until a user-specified threshold is reached, in which case it switches to expected messages.
● Random: This profile assigns a random message evaluation category to a random actor.
● Mixed: This profile allows the user to specify two or more of the supported profiles.
● User_specified: This profile allows the user to set the message evaluation category for an actor manually.
A list of hypothesis testing terms and their definitions is provided in Appendix C.
2.3.2 Trust Model Simulator
Using the CSV file from the Trust Model Data Generator as an input, the Trust Model Simulator provides a method for testing and verifying MVoT calculations, initial values, and various thresholds. It also showcases the trust relationship between the EGoT actors over time while also providing accuracy and performance metrics to better understand the trust algorithm.
2.4 DTM System Message Flow
Figure 2.3The message flow diagram of the DTM system with the initial encapsulated XML message from DCM is processed at the DTMC to classify and calculate trust and sent to the CDTA to aggregate trust data and detect abnormalities in the EGoT
communication network.
As illustrated in Figure 2.3, the DCM sends encapsulated messages to the DTMC via HTTPS. These messages are in the form of XML format. This encapsulated message contains the information exchange between the DCM, DER, and GSP. The DTMC server receives this information and then forwards it to the classifier script. The classifier script parses these messages and classifies them as expected, unexpected, indeterminant, error, or none. The classifier script outputs the classification as a CSV file for the Trust Evaluator script to process. The trust evaluator extracts the classified CSV file and identifies the sender to pull the corresponding MVoT data. Then, the trust evaluator emanates MVoT values by combining existing MVoT values with the classified message data. Next, the trust evaluator updates existing MVoT values with the results as a CSV file. In addition, the DTMC’s client periodically checks and sends recent trust evaluations to the CDTA over HTTPS as XML files.
The five main scripts at the CDTA are NGINX Proxy, CDTA Server, Merger Script, PerTPlot, and Dashboard. NGINX proxy at the CDTA receives the XML messages from the DTMC client. NGINX proxy forwards these XML messages to the CDTA to convert to trust evaluation CSV files. Then, the Merger Script periodically checks for recent trust evaluation CSV files and aggregates them into the merger.csv file. Next, PerTPlot regularly checks for updates in the Merger script and separates each MVoT value into CSV files. Finally, the Dashboard script takes these MVoT data and creates a monitoring tool that displays a graphical representation of the MVoT variable data. The dashboard is
in the form of an HTTPS HTML website. Customers of the DTM-System such as the GSP can access the CDTA dashboard with CDTA’s certificate and login information.
3 Implementation Summary
The DTM System has six major components: the Input Data Classifier, the MVoT
calculator, Client MVoT, the CDTA MVoT Aggregator, the recommendation block, and the central status dashboard. The Input Data classifier is part of the DTMC at the SPC and classifies the messages between the actors. The MVoT calculator calculates a metric vector of trust variables (Client MVoT) based upon the current message classification and past MVoT values. The Client MVoT stores the calculated values. The CDTA receives MVoT values from the DTMCs and calculates periodic normalized values. The
recommendation block sends alerts to the GSP based upon the aggregated MVoT values relative to various thresholds. The central status dashboard presents the aggregated MVoT data to the GSP. Figure 3.1 shows these blocks.
Figure 3.1: A block diagram representation of the DTM System.
3.1 CDTA Operation
The CDTA receives MVoT values from each DTMC at routine intervals. After the CDTA receives a message from a DTMC, it processes the message, then makes a
recommendation based on the MVoT values and any thresholds in place. Actions and recommendations take the form of alerts, which notify personnel that have cyber security responsibilities of any abnormal activities that the CDTA observes.
The following is a list of example alerts:
● “Excessive time since last communication from GSP”
● “Excessive time since last communication from DER”
● “Trust is low for GSP/DCM/DER”
● “Communication rate is low from GSP/DCM/DER”
● “Communication rate is excessive from GSP/DCM/DER, possible DoS”
● “Trust is low for GSP/DCM/DER from n SPCs”
3.2 DTM Client
A DTMC is located along with a DCM at each of the SPC’s DERs. The DCM sends an encapsulation of each incoming and outgoing message to the DTMC. The DTMC then classifies each message. These encapsulations are in XML-formatted HTTPS POST requests.
The classification process depends on multiple factors, including who the sending and receiving parties are, the stage of communication for the actors, and the type of fields being requested. An MVoT entry is either initialized or updated for each participating actor.
The MVoT values for the actor are updated based on the message classification. As each incoming message is classified, the MVoT for that actor is updated and propagated down to the CDTA.
The state of the input classifier is based upon the last message received. One part of the state is which actor sent a message to which recipient. This can be represented as a five-state variable. The five states are: DCM→GSP, GSP→DCM, DCM→DER,
DER→DCM, and Other. An example of Other is DCM→DCM, which indicates something is wrong. Figure 3.2 shows the five states for this example message sequence. The white path in the figure shows the state transition path for the input sequence of:msg
1(DCM→GSP), msg2(GSP→DCM), msg3(DCM→DER), msg4(DER→DCM), and msg5(DER→DCM), with the classifier starting in the initial state of other. This state diagram is used to classify the input stream based upon the order of messages received.
The order of messages is only part of the classifier tasks. Values, times, and various dependencies of types of messages are also used to classify the messages.
Figure 3.2DTM Classifier state diagram with the state transitions for 5 example messages highlighted.
Regarding messages exchanged between the DCM and the GSP, the raw data (in the form of XML) received by the DTMC can be sent via either POST or GET requests.
Exchanges are initiated when the client sends the server a POST request (such as an IEEE 2030.5FlowReservationRequest). The server then responds with a “201 Created”
message. From there a GET request is sent to the server, which responds by sending a response list. After the first sequence of POST and GET requests, GET requests are then used periodically thereafter. Requests initiated by a GET to the server start at the root /dcap. The server then responds with the available hrefs. From there on, GET requests targeting the available hrefs are used to navigate the resource tree.
For messages exchanged between the DCM and the DER, the raw XML data may be categorized as being one of seven possible commands formulated by the DCM in order to implement grid services, responses to those commands, or automated messages required by the DERs communication protocol, such as CTA-2045 or SunSpec Modbus.
Message exchange between the DCM and the DTM is demonstrated in the sequence diagram of Figure 3.3 for the case of a Voltage Management Service. All information exchanges between the DCM and the GSP or the DCM and the DER initiate a request/response exchange between the DCM and the DTM.
Figure 3.3Sequence diagram for grid-DER Voltage Management Service provided by a Photovoltaic-inverter system (PVInv) with the DTM system integrated. Service is provided by automatic response according to V-VAr and V-W curves loaded into the PVInv.
Figure 3.4DTM testing and simulating workflow.
The trust model data generator and simulator are used to test the various MVoT calculations, initial values, and thresholds. The thresholds are set and evaluated using hypothesis testing, as described in Section 2.2.3. As shown in Figure 3.4, the output of the trust model data generator is the classified input into the trust model simulator. The trust model simulator generates an output CSV file containing the populated MVoT for each of the actors the DTM observed.
To model and test the workflow of the CDTA, multiple files can be generated and
simulated, then passed through the merger script to produce a single CSV file with all the messages ordered based on the time the CDTA received the message. The output CSV from the merger script can be used as the input to either the plotPerT script or to create CDTA dashboard plots. The plotPerT script allows for the latest MVoT values for the specified time increment to be displayed, while the CDTA dashboard provides plotting data depending on the user-specified MVoT parameter.
3.3 Anonymizing DER Topological Locations
The EGoT System provides Grid-DER services at multiple topological levels within a power system. However, the ESI rules emphasize customer privacy: personal information about customers, including their topological location within a power system, should not be exchanged between system actors unless it is required to implement the grid service. In order to prevent specific topological addresses from being included within DTM
information transactions, we developed a method for anonymizing DER topological addresses using k-anonymity .5
5M. Alsaid, M. Adham, R. Bass, and N. Bulusu, “Distributed energy resource management systems: Preserving customer privacy through K-anonymity,” in IEEE Power & Energy Society General Meeting, 2023
We have adopted the CSIP scheme for partitioning a power system into a hierarchical6 topology based on the electrical architecture of the system. This scheme assigns a unique topological address to every DER in the system, corresponding to its location within the topology of the system. This topology scheme is illustrated in Figure 3.5.
Figure 3.5CSIP topology grouping scheme. A DER resides at a service point at the bottom of the hierarchy. Its topological address contains information about all of the topological levels above the service point.
The CSIP topological addressing scheme allows delivery of grid-DER services to particular topology levels. Table 3.1 lists the six Grid-DER service categories and indicates the7 topological level(s) to which they apply. Grid-DER services are never narrowly targeted to a specific service point of the topological hierarchy. Rather, the Grid-DER recourse list published by the DERMS would be made available to specific groups of DER, specified by their topological addresses.
Grid-DER Service Categories Location Extent
Energy System , Subtransmission, Substation, or Feeder8 Reserve System, Subtransmission, Substation, or Feeder
Regulation System
8Topological level “System” is equivalent to “Balancing area.”
7J. T. Kolln, J. Liu, S. E. Widergren, R. Brown, “Common Grid Services: Terms and Definitions Report,” Pacific Northwest National Laboratory, PNNL-34483, July 2023.
6Common Smart Inverter 7 Profile: IEEE 2030.5 Implementation Guide for Smart Inverters, Version 2.1, Common Smart Inverter Profile Working Group, March 2018
Blackstart Substation, Feeder, or Segment Voltage Service Feeder, Segment, or Transformer Frequency Response System
Table 3.1Grid-DER services target specific levels within the CSIP addressing topology. Note that none of the Grid-DER services target the Service Point topology level.
Considering DTM information exchange, when MVoT information is passed from DTMCs to the CDTA, the CDTA must have some understanding of where issues may be arising.
The DER topological addresses provide this information. However, the k-anonymity method truncates topological addresses to preserve customer privacy while preserving enough topological information to enable the CDTA to identify a topological region that is producing abnormal MVoTs. The truncation process reduces the topological address minimally such that the addresses contain enough detail to highlight an affected region while concurrently maintaining DER anonymity. The CDTA can inform the GSP of a particular problematic topological area, but not of any one particular DER, thereby preserving customer anonymity. The extent of this address truncation depends on DER penetration density within the electrical system.
3.4 Scalability Testing
The DTM-System went through Scalability testing for a better understanding of the robustness of our design. The scalability testing ranged from 1 DTMC to 10,000 DTMCs.
Figure 3.6 shows the scalability test result of the generated file size for MVoT data files totaling 17.5 MB, 6.68 MB for evaluated file size, and 3.117 MB for merged files. Figure 3.7 shows there was a significant process time increase when scaling from 7,000 DTMCs sending data to 10,000 DTMCs sending data to the CDTA. The processing time increased from 17.13 seconds to 43.18 seconds for the merge script, and for the aggregated MVoT per time data, processing time increased from 46.61 seconds to 552.03 seconds. Further investigation will be beneficial to enhance system efficiency.
Figure 3.6The impact on the file size at the CDTA as the number of DTMCs increased from 1 to 10,000.
Figure 3.7The file processing time at the CDTA as the number of DTMCs increased from 1 to 10,000.
Appendix A MVoT Variables and Equations
A.1 MVoT Variables
Table A1Table providing a list of Metric Vector of Trust (MVoT) variables and their corresponding definitions.
Variable Variable Name Definition
1 𝑇𝑆 Trust Score Overall trust score for each actor.
2
𝐷𝑆 Distrust Score Distrust score for each actor to have a
clear awareness of how untrustworthy an actor is.
3 𝐶 Certainty Represents how certain the DTMC is
of each evaluation.
4 𝐶𝐸𝑥𝑀𝑠𝑔 Count of expected Messages Total count of expected messages for each actor.
5 𝐶𝑈𝑛𝑀𝑠𝑔 Count of unexpected Messages Total count of unexpected messages for each actor.
6 𝑇𝑜𝑡𝑀𝑠𝑔 Count of total Messages Count of total messages for each actor.
7 𝑇𝑖𝑚𝑒_𝑆𝑡𝑚𝑝 Recent uptime The time stamp of the most recent message received from the actor.
8 𝑅𝑒𝑔𝑠𝑡𝑟 𝑇𝑖𝑚𝑒_ Registration date The first time a message is received from an actor.
9 𝐶𝑜𝑚𝐹𝑟𝑒𝑞 Freq. of communication from DCM perspective
How often an actor communicates with the DCM.
10 𝑇𝑋 𝑇𝑖𝑚𝑒_ Measured transaction time The time difference for a message to travel from the source to destination.
Table A1Continued.
Variable Variable Name Definition
11
_ _
𝐴𝑣𝑔 𝑇𝑋 𝑇𝑖𝑚𝑒 Average transaction time The mean value of message transaction time.
𝐼𝑛𝑐_𝐴𝑣𝑔_𝑇𝑋_𝑇𝑖𝑚𝑒 Incremental average transaction time
The mean value of message
transaction time applied to the current time.
12 𝑇𝑆𝐿𝐶 Time since last communication The time delta of the last message received from an actor.
13
𝑆𝐷𝑇𝑇 Standard Deviation Transit Time The extent of deviation for Transit time as a whole.
𝐼𝑛𝑐_𝑆𝐷𝑇𝑇 Incremental Standard Deviation Transit Time
Standard Deviation Transit Time applied to the current time.
14
𝑅𝐹𝐶 Relative Factor of Certainty A supporting equation. The certainty that an indicator leans toward or against trust score or distrust score.
15 𝑇 𝑂𝑢𝑡_ Count of timeouts Total count of timeouts for each actor.
16 𝐶 𝐴𝑙𝑟𝑡_ Count of alerts Count of alerts sent out to each actor.
17 𝑀𝑎𝑥_𝐶𝑜𝑚𝐹𝑟𝑒𝑞 Max communication frequency The maximum rate an actor communicates with the DCM
A.2 MVoT Equations
Trust Score
𝑇𝑆(𝑖 + 1) = [𝐶𝐸𝑥𝑀𝑆𝐺(𝑖 + 1) − (α × 𝐶𝑈𝑛𝑀𝑆𝐺(𝑖 + 1))] × 𝐶(𝑖 + 1)
whereαis a weight value that determines the influence of unexpected messages, andiis the ithmessage. For a higher α, the trust score is less lenient about the impact of adverse events.
Distrust Score
𝐷𝑆(𝑖 + 1) = 𝐶𝑈𝑛𝑀𝑆𝐺(𝑖 + 1) × 𝐶(𝑖 + 1) Certainty
𝐶(𝑖) = 𝑅𝐹𝐶 × 1 − 𝑒(−γ×𝑇𝑜𝑡𝑀𝑠𝑔)
( )
× 𝑚𝑎𝑥_𝐶𝑜𝑚𝐹𝑟𝑒𝑞𝐶𝑜𝑚𝐹𝑟𝑒𝑞( )
( )
× 𝑚𝑖𝑛_𝑇𝑆𝐿𝐶𝑇𝑆𝐿𝐶where is a weight value that determines how fast the added messages influenceγ certainty. The equation1 − 𝑒(−γ×𝑇𝑜𝑡𝑀𝑠𝑔)is set up for the increase in total messages to have an increased influence on the certainty.
Count of Expected Messages
𝐶𝐸𝑥𝑀𝑠𝑔(𝑖 + 1) = 𝐶𝐸𝑥𝑀𝑠𝑔(𝑖) + 1. Count of Unexpected Messages
𝐶𝑈𝑛𝑀𝑠𝑔(𝑖 + 1) = 𝐶𝑈𝑛𝑀𝑠𝑔(𝑖) + 1 Count of Total Messages
𝑇𝑜𝑡𝑀𝑠𝑔(𝑖 + 1) = 𝑇𝑜𝑡𝑀𝑠𝑔(𝑖) + 1 Recent uptime
𝑇𝑖𝑚𝑒_𝑆𝑡𝑚𝑝(𝑖 + 1) = 𝐶𝑢𝑟𝑟𝑒𝑛𝑡𝑇𝑖𝑚𝑒 Device Registration Time
𝑅𝑒𝑔𝑠𝑡𝑟_𝑇𝑖𝑚𝑒 = 𝑇𝑖𝑚𝑒_𝑆𝑡𝑚𝑝(𝑖) Communication Frequency
𝐶𝑜𝑚𝐹𝑟𝑒𝑞 = 𝐶𝑢𝑟𝑟𝑒𝑛𝑡𝑇𝑖𝑚𝑒 − 𝑅𝑒𝑔𝑠𝑡_𝑇𝑖𝑚𝑒𝑇𝑜𝑡𝑀𝑠𝑔
Average Transaction Time
𝐴𝑣𝑔_𝑇𝑋_𝑇𝑖𝑚𝑒 = µ
𝑛= 1𝑛
𝑖=1 𝑛
∑ (𝑥𝑖)
wherenis the number of messages transactions.
Incremental Average Transaction Time
𝐼𝑛𝑐_𝐴𝑣𝑔_𝑇𝑋_𝑇𝑖𝑚𝑒 = µ
𝑛+1= 𝑛×µ𝑛+1𝑛+𝑥𝑛+1
wheren+1is the increment of transactions that occur for each new transaction.
Relative Factor of Certainty
𝑅𝐹𝐶 =|𝐶𝐸𝑥𝑀𝑠𝑔 + 𝐶𝑈𝑛𝑀𝑠𝑔𝐶𝐸𝑥𝑀𝑠𝑔 − 0. 5
| |
| × β
where sets the maximum value of what RFC can be. For example ifβ β = 2. 0 and then, the maximum RFC value will be 1.0.
𝐶𝑈𝑛𝑀𝑠𝑔 = 0
Standard Deviation Time Transit
𝑆𝐷𝑇𝑇 = σ
𝑛= 𝑛1
𝑖=1 𝑛
∑ 𝑋𝑖− µ
(
𝑛)
2
Standard Deviation of Transaction Time, applied to the current time
𝐼𝑛𝑐_𝑆𝐷𝑇𝑇 = σ𝑛+1= 𝑛 × (σ𝑛)
2 + (𝑥𝑖+1−µ𝑛) (𝑋𝑖+1− µ𝑛+1) 𝑛 + 1
Time Since Last Communication
𝑇𝑆𝐿𝐶 = 𝑇𝑖𝑚𝑒 𝑑𝑒𝑙𝑡𝑎 𝑜𝑓 𝑡ℎ𝑒 𝑙𝑎𝑠𝑡 𝑚𝑒𝑠𝑠𝑎𝑔𝑒 𝑟𝑒𝑐𝑒𝑖𝑣𝑒𝑑 Time Out Count
𝑇_𝑂𝑢𝑡 (𝑖 + 1) = 𝑇_𝑂𝑢𝑡(𝑖) + 1 Count of Alerts
𝐶_𝐴𝑙𝑟𝑡(𝑖 + 1) = 𝐶𝐴𝑙𝑟𝑡(𝑖) + 1 Max Communication Frequency
𝑀𝑎𝑥_𝐶𝑜𝑚𝐹𝑟𝑒𝑞(𝑖) = 𝐶𝑜𝑚𝐹𝑟𝑒𝑞(𝑖) Only updated if𝐶𝑜𝑚𝐹𝑟𝑒𝑞(𝑖)>𝑀𝑎𝑥_𝐶𝑜𝑚𝐹𝑟𝑒𝑞(i)
Appendix B Hypothesis Testing Keywords
Table B1List of keywords used in hypothesis testing.
Term Definition
Confusion Matrix A method of evaluating the performance of a classification model.
Confusion Metric Multiple metrics derived from the confusion matrix to evaluate the performance of the system such as CDTA.
Binary Classification A binary classifier makes a decision between two hypotheses.
Such as null hypothesis and alternative hypothesis.
Positive When the CDTA sends an alert to the GSP.
Negative When the CDTA does not send an alert to the GSP.
True Positive (TP) The DTM sends an alert to the CDTA at an event where an alert rightfully should be sent out.
True Negative (TN) The DTM did not send an alert to the CDTA at an event where an alert rightfully should not be sent out.
False Positive (TN) The DTM sends an alert to the CDTA at an event where an alert rightfully should not be sent out since there are no attacks.
False Negative (FN) The DTM did not send an alert to the CDTA at an event where it should not have due to the absence of attacks.
Null Hypothesis When the CDTA sends an alert to the GSP.
Alternative Hypothesis When the CDTA does not send an alert to the GSP.
Count Threshold The threshold set for the count of actors exceeding a specific MVoT variable value.
Value Threshold The threshold selected to check if the reported MVoT value of an actor is greater than the specified value threshold.
Appendix C Product Requirements
Product Requirement Keywords Description
SHALL
Indicates the development of this specification for this prototype is expected, without exception.
SHOULD
Indicates the development of this specification for this prototype is expected, but may not be completed.
MAY
Indicates the development of this specification for this prototype is not expected, but should be considered.
C.1 DTM System Product Requirements
PR Description
DTM01 The DTM System SHALL establish an initial metric vector of trust for each actor or object it is observing when that actor or object joins the system.
DTM02 The DTM System SHALL not maintain SPC identification data.
DTM03 The DTM System SHALL compare MVoT values relative to various thresholds.
DTM04 The DTM System block SHALL send alerts to the GSP based upon the aggregated MVoT values.
DTM05 The DTM System SHALL not interfere with the DCM performance.
DTM06 The DTM System MAY store a limited number of past trust vector parameters.
C.2 DTMC Product Requirements
PR Description
DTMC01The DTMC SHALL receive an encapsulated message of each incoming and outgoing message to the DCM.
DTMC02The DTMC SHALL classify all received encapsulated messages.
DTMC03The DTMC SHALL calculate an MVoT
DTMC04A DTMC SHOULD be physically located at every DCM.
DTMC06The DTMC MAY passively monitor (“sniff”) DCM/DER serial communication.
C.3 CDTA Product Requirements
PR Description
CDTA01A CDTA SHALL be located at the GSP.9
CDTA02The CDTA SHALL receive MVoT values from all DTMC.
CDTA03The CDTA SHALL aggregate MVoT values from all DTMC.
CDTA04The CDTA SHALL calculate normalized MVoT values.
CDTA05The CDTA SHALL generate alerts based on MVoT values.
CDTA06The CDTA SHALL send alerts to appropriate authorities.
CDTA07The CDTA SHOULD have a central status dashboard.
CDTA08The CDTA SHOULD provide the GSP with dashboard information.
CDTA09The CDTA MAY categorize alerts for severity.
C.4 DCM Product Requirements
PR Description10
DCM04 The DCM SHALL encapsulate each incoming and outgoing message.
DCM05 The DCM SHALL send an encapsulation of each incoming and outgoing message to the DTMC.
10DCM04, DCM05 product requirements included in this implementation profile because of their relevance to the DTM System. Other DCM requirements are included in the EGoT System Implementation Profile.
9CDTA01 was depreciated, August 8, 2022