For permission to photocopy or use material electronically from this work, please visit www.copy-right.com (http://www.copyright.com/) or contact the Copyright Clearance Center, Inc. . Visit the Taylor & Francis website at http://www.taylorandfrancis.com and the CRC Press website at http://www.crcpress.com.
THE PURPOSE OF THIS TEXTBOOK
Wikipedia, which calls the field HF&E, defines human factors and ergonomics as "an interdisciplinary field that includes contributions from psychology, engineering, biomechanics, mechanobiology, industrial design, graphic design, statistics, operations research, and anthropometry." It is important to emphasize that only the P/OM is comfortable in many of these areas, leading to potential benefits and subsequent collaboration. It is a P/OM responsibility and is deep in content, broad in application, and powerful in determining organizational success.
TO WHOM IS THIS TEXT DIRECTED?
A field of study that deals with managing inputs and outputs – and does it well – is P/OM.
WHY THE SYSTEMS APPROACH IS ESSENTIAL
This is because P/OM often involves big data because the solution to the problem requires its use. They change all the time, which requires big data methods to track the changes – and regularly alter inventory policies accordingly.
INTERDISCIPLINARY COORDINATION
Gupta is one of the founding members of the Production and Operations Management Society (POMS) and played a key role in its initiation, development and growth. He is the co-editor of the Special Issue on Humanitarian Operations and Crisis Management, POM, 2014.
Introduction to Production and
Operations Management
The Systems Viewpoint
Goods are tangible items that can be produced before their actual use and they can be inventoried. Also, OM can be used instead of P/OM; however, PM is not a good substitute for P/OM unless clearly only manufacturing is involved.
Strategic Thinking
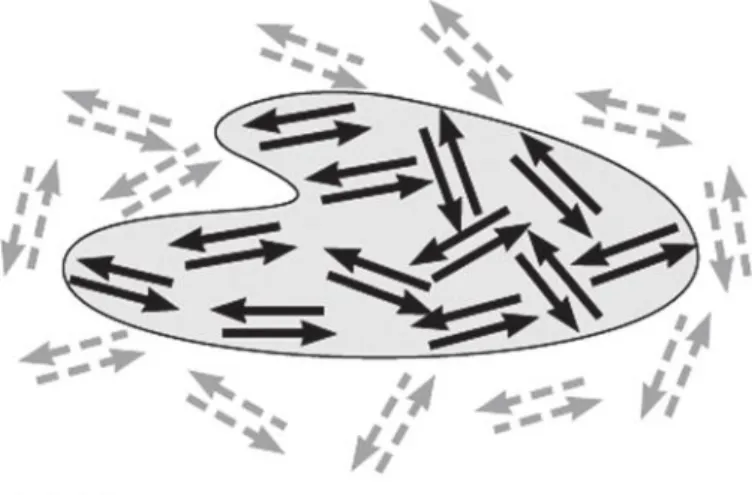
The coach knows that to win the team requires coordinating the contributions of individual players. The systems view means that everything relevant to the achievement of the goal is included in the analysis.
Explaining P/OM
If the part that operations managers play is to be effective, it must be systems-based. Operations managers learn how to study a process by observing it and charting its flow; from that platform, its performance can be improved.
Use of Models by P/OM
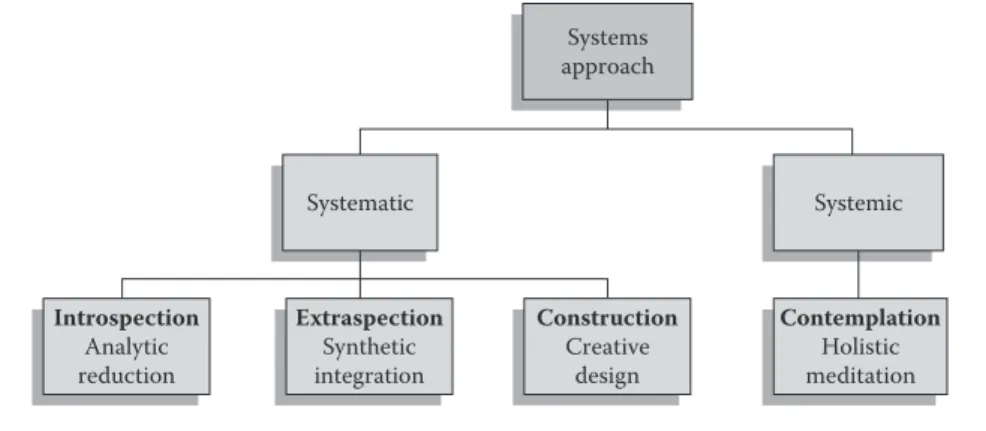
The Systems Approach
- Using the Systematic–Constructive Approach
- Why Is the Systems Approach Required?
- Defining the System
- Structure of the Systems Approach
- Examples of the Systems Approach
- Designing the Product Line Using the Systems ApproachSystems Approach
The systems approach called introspection is based on the analytical reduction of systems into their parts, which is characteristic of the sciences. The equation shown here can be read as "The measures yi are a function of all relevant factors xj.
Information Systems for Manufacturing and Servicesand Services
It is a fair bet that the twenty-first century taxonomy will categorize manufacturing as a subcategory under operations, and that services will be an integral part of manufacturing. When a discussion applies equally to both manufacturing and services, it is often referred to as P/OM.
Defining Operations
- Manufacturing Operations
- Service Operations
- Similarities and Differences between Services and Manufacturingand Manufacturing
With the increase in the frequency of disasters – both natural and man-made – the importance of crisis management has increased. The same can be said for blood testing, x-rays and other repetitive aspects of the healthcare business.
Working Definitions of Production and Operations
Logical reasoning by computers for service requests is likely to be much better than that which can be provided by external call center workers whose native language and cultural background are different from that of the caller. This advantage of voice recognition of computers using the Internet will change the outsourcing of call center functions for banks, electronic stores, etc.
Contrasting Production Management and Operations ManagementOperations Management
In 2013, Lenovo became the "largest PC vendor in the world." It is according to IDC and Gartner that track PC sales. This is an interesting business case where Lenovo exhibits the excellent characteristics of a Stage IV company (see section 1.15).
P/OM—The Hub of the Business Model
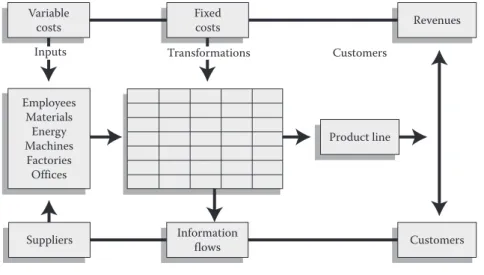
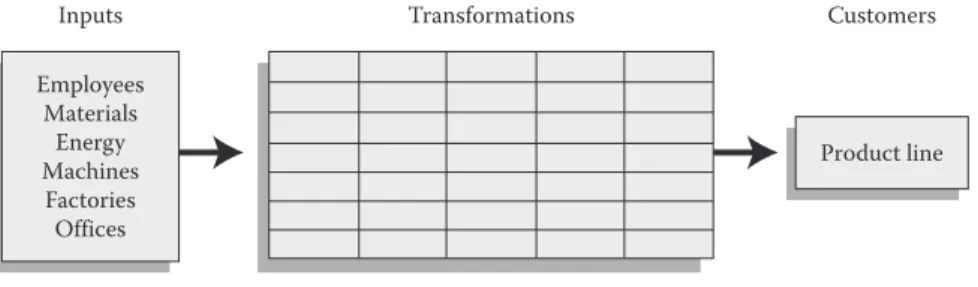
Transformation Process
- Inputs Associated with Variable (or Direct) Costs
- Transformations Associated with Fixed (or Indirect) Costs
- Outputs Associated with Revenues and Profits
The number of passengers (units) carried (handled) by the airline is the output (also called throughput to emphasize output rate) of the system. The manufacturer can measure output in terms of the number of units of each kind of product it produces.
P/OM Input–Output Profit Model
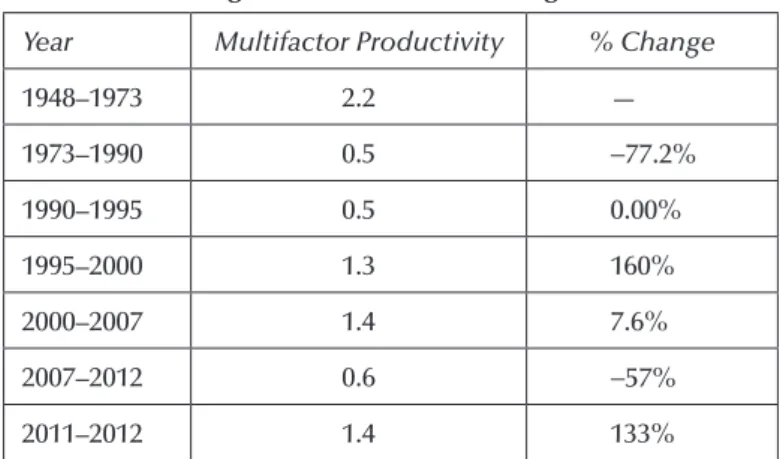
1.5) Nothing in the structure of the profit model has changed over time; the equations are the same. The performance of the input-output transformation system has been changed, resulting in a higher productivity of the system.
Productivity—A Major P/OM Issue
The architecture of the operating system has been changing for years, but recently at an accelerated pace. The detailed discussion of the concept of productivity and its measurement are discussed in Chapter 2.
The Stages of P/OM Development
C&H describes this as "special service competence". A Stage III company makes efforts to imitate the special capabilities of the best companies. Thomas Edison, the inventor of the incandescent light bulb, said that "Genius is 1 percent inspiration, 99 percent perspiration." Stage IV companies don't shy away from hard work.
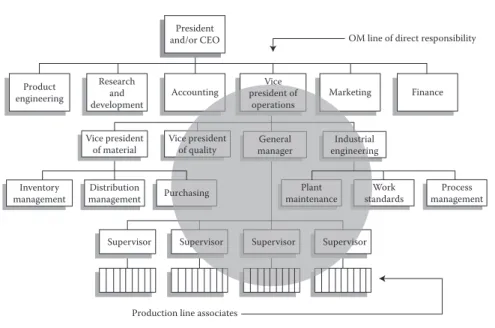
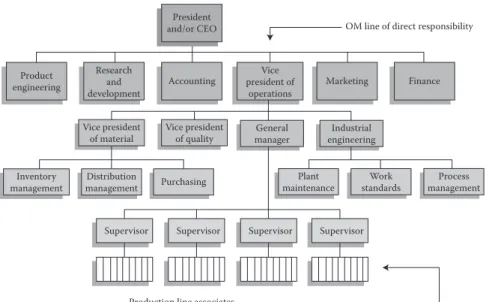
Organizational Positions and Career Opportunities in P/OMOpportunities in P/OM
- Career Success and Types of Processes
- Operations Management Career Paths
- Global Aspects of Career Paths
- Manager of Production or Operations
- Inventory Manager, Materials Manager, or Purchasing Agent (and Supply Chain Manager)Agent (and Supply Chain Manager)
- Director of Quality
- Project Manager/Consultant (Internal or External)
The pace of batch production is related to the variation of the product line and thus the number of set-ups, clean-ups and changeovers. Personnel positions are by definition not on the production line, but support the line.
Summary
These may include the development of new products and services as well as the processes to manufacture and deliver them. This leads to consideration of the kinds of P/OM positions that other functional managers in the organization may encounter, as well as the type of careers that P/OM offers.
Review Questions
Stages of P/OM development are introduced with attention to particular capabilities (strategic and tactical) derived from P/OM that enable a firm to reach highly competitive stages of development.
Problems
This service organization tries to keep up with its competitors by copying everything they do as soon as possible. This service organization strives for global leadership based on the best operations in the world.
P/OM History Archive
This manufacturer is constantly working to be as good as the best of the competition. The service is constantly improved, giving the organization a proactive leadership role in its industry.
Readings and References
Lawrence, Competing on Capabilities: The New Rules of Corporate Strategy, Harvard Business Review, Mars–Prill 1992, f.
Source of Video Clips on Manufacturing
Strategy, Productivity, and History
The Systems Viewpoint
According to the author, the only options for the companies are "to attack, coexist uncomfortably, or become low-cost players themselves." It is clear that low cost is king when there is no sense of economic well-being.
Strategic Thinking
In his article, Strategies to Fight Low-Cost Rivals, Kumar (2006) foresees the continued growth of low-cost players and suggests strategies for the survival of mainstream value-added firms. Additionally, some companies were really good at making vinyl records (collectibles now), but that didn't help them survive rapid change as the music industry moved from 8-track tape to 8mm audio cassettes to CDs and now to DVDs and Blue Rays and finally "the cloud". In terms of videotape formats, the Betamax system from Sony was the first successful commercial product.
Measurement of Productivity
- Labor Productivity
- Capital Productivity
- Multifactor Productivity
- Operational Measures of the Organization’s Productivity
The definition of productivity from the APICS dictionary can be converted into the terms of this text if we recognize that productivity is a measure of the ratio of output to input as given by. According to Drucker (1999), improving knowledge and worker productivity is one of the greatest challenges of the twenty-first century.
System-Wide Issues Impacting Productivity
- Global Issues
- Bureaucracy, Flexibility, and Productivity
- Size of Firms and Flexibility
- Price–Demand Elasticity and Productivity
- Elasticity of Quality and Productivity
- Economies of Scale and the Division of Labor
A major contributor to low productivity is bureaucracy – a major inhibitor of flexibility. Adam Smith said: "The division of labor depends on the extent of the market." With a large enough scale, it would be possible to segment activities and develop serialized process flows.
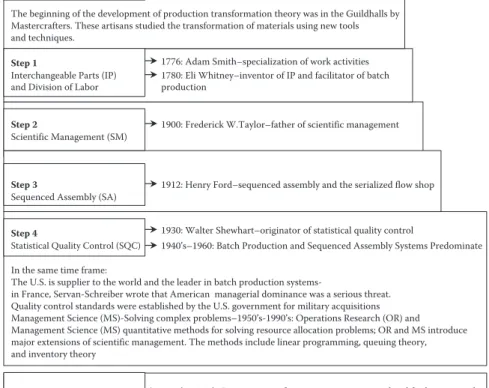
History of Improvements of P/OM Transformations
- Artisans, Apprentices, and Trainees—The Beginning
- Interchangeable Parts (IP)—P/OM’s First Step
- Scientific Management (SM)—P/OM’s Second Step
- Sequenced Assembly (SA)—P/OM’s Third Step
- Statistical Quality Control—P/OM’s Fourth Step
- Lean Production Systems—P/OM’s Fifth Step
The process of transformation of production was revolutionized - combining the specialization of workers with interchangeable parts changed all standards of productivity. For the first time, it was possible to stabilize and control the output of the transformation process.
Workload Assessment (Forecasting)
Introduction
The Rivet and Nail plant must forecast product sales to develop departmental schedules for the upcoming production period. It is important to note that equations do not make predictions "true". Also, a lot of good forecasting can be done without math.
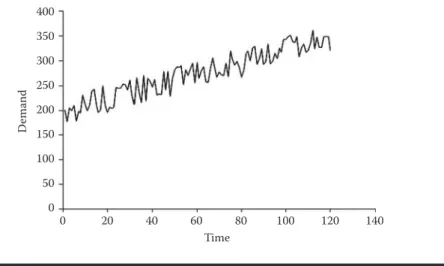
Time Series and Extrapolation
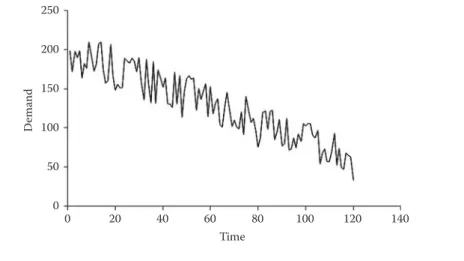
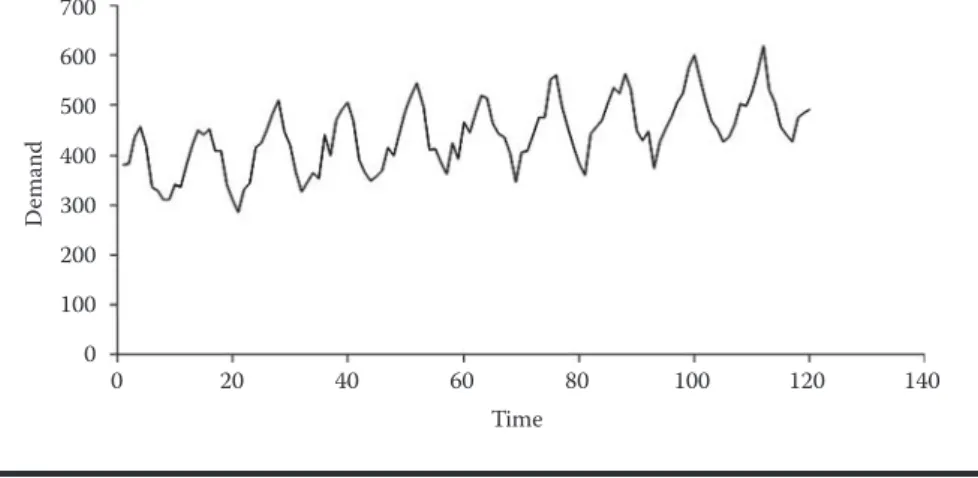
The answer will depend on the stability of the pattern of the time series for the events being studied. If the time series shows an increasing linear trend, as in Figure 3.3, there is a constant rate of change (increasing) with increasing time.
Forecasting Methods for Time-Series Analysis
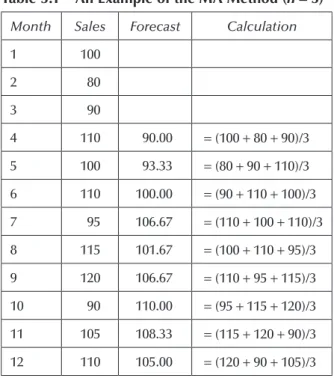
- Moving Average
- Weighted Moving Average
- Exponential Smoothing
- Forecasting with a Seasonal Cycle
- Trend Analysis
With a large value of α, the bona fide changes will be reflected immediately in the new average. In the trend line equation, a is the intercept on the Y-axis, which is the value of demand (variable Y) when X = 0.
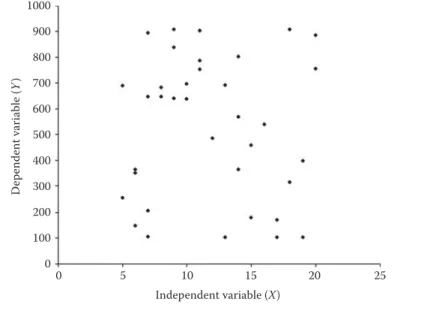
Regression Analysis
As in trend analysis, a is the intercept of the Y axis, which is the value of demand (variable Y) when X = 0. The slope of the line is represented by b, which gives the change in the value of demand (variable) Y) for a unit change in the value of X.
Coefficients of Correlation and Determination
The coefficient of determination (r2) is a measure of the variability accounted for by the regression line for the dependent variable. If the coefficient of determination is low, multiple regression analysis may be able to account for all variables that affect the independent variable Y (not covered in this chapter).
Forecasting Errors
The Delphi Method
Pooling Information and Multiple Forecasts
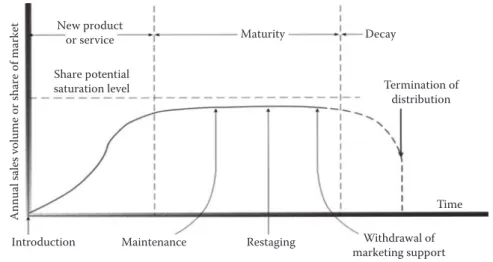
Product Life-Cycle Stages and Forecasting
- Introduction and Growth of the New Product (Goods and Services)(Goods and Services)
- Maturation and Decline of the New Product (Goods and Services)(Goods and Services)
- Demand Prediction in Life-Cycle Stages
- Protection of Established (Mature) Products (Goods and Services)(Goods and Services)
It is a replacement for another product and is assigned the performance of the product it replaced. Sanders, N.R., and Ritzman, L.P., The need for contextual and technical knowledge in judgmental forecasting, Journal of Behavioral Decision Making, p.
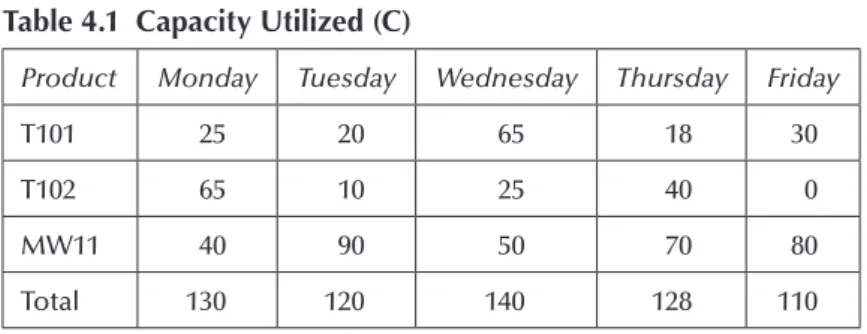
Capacity Management
Definitions of Capacity
Cyclical supply chain demand systems can be expected to cycle between utilization factors in the 70% range and then up to more than 100% capacity. For an example of a manufacturing supply chain, compare the maximum number of hot dogs that Oscar Meyer (OM) can produce and ship per hour with the maximum number of hot dogs that Jewess can produce and ship per hour National (HN).
Introduction to Aggregate Production Planning
Production schedules determine the schedule of work, that is, the number of units to be produced or services to be performed in a given period. The planning period, the “time frame”, is usually one month, but any time frame can be used.
Example 1: Aggregate Production Planning
- Production Plans
It is material flows from the factory to the warehouses with trucks and other transport systems that must be coordinated. While solving the AP problems, we make an implicit assumption that actual demand is equal to expected demand.
Production Plans
- Production Capacity
- Example 2: Aggregate Manufacturer’s Production PlanningProduction Planning
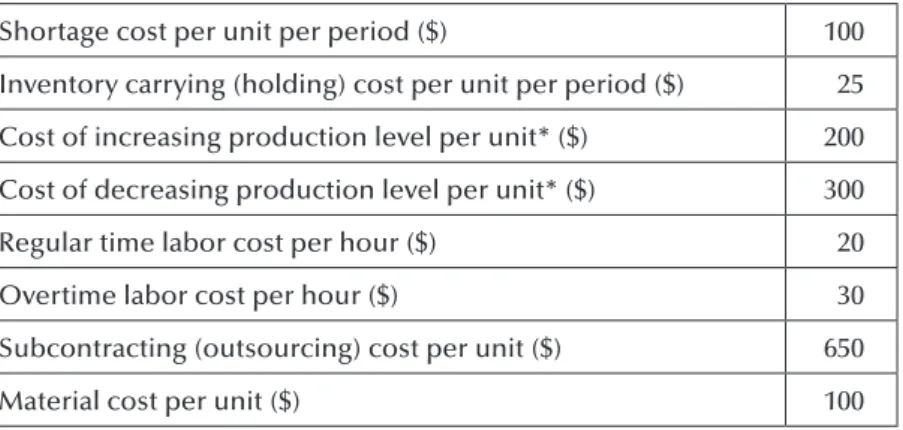
- Costs in AP
Demand per day: Unit demand per day in a given month is a function of demand in that month and the number of working days in that month. Suppose in a given month, e.g. March that the demand is 600 units and the number of working days is 22.
Costs in Aggregate Planning
- Production Capacity
- Production Plans
- Selection of a Production Plan
- Beginning Conditions
- Example 3: Aggregate Production Planning in a Service IndustryService Industry
- Costs in AP for the Blood-Testing Laboratory
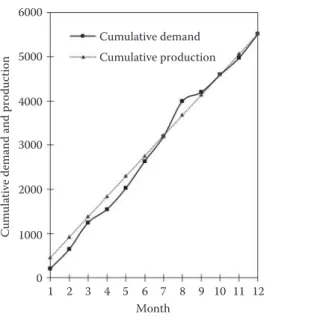
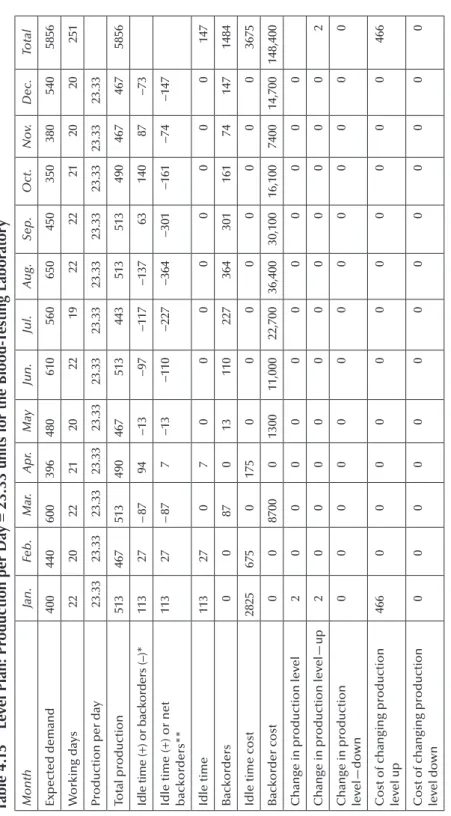
Calculations for the level of production per day and the number of workers required to meet that level are given in Inset 4. Monthly level of production per day: The level of production per day in a given month is a function of production in that month and the number of working days in that month.
Costs in Aggregate Planning
- Production Capacity
- Production Plans
Number of workers = (production × production time per unit)/hours worked In March, assume that each worker works 8 hours per day and the production time is 4 hours per test kit (unit). Note that the total of the backorders is 1484 (row 9), which is multiplied by $100 - the backorder cost per unit.
Inventory Management
Introduction
Organizations that are in the process of providing raw materials at the very beginning of the procurement process are themselves dependent on procurement. Second, components and subassemblies are purchased materials that have greater added value than the raw materials.