A graph of the expected MOR versus the number of errors within a fixed volume between . four-point bending test simulation. A plot of flexural strength versus filler particle size showing possible discontinuous .. behavior of strength versus particle size.
Introduction
Fracture Mechanics
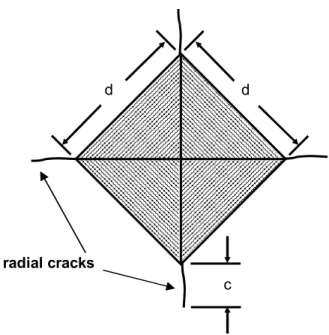
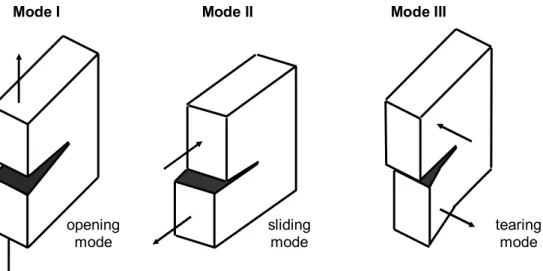
The crack surface displacements are in the crack plane and parallel to the crack front edge. If the average distance between the particles is greater than the crack size, the strength of the glass is a function of the particle volume fraction.
MPa)
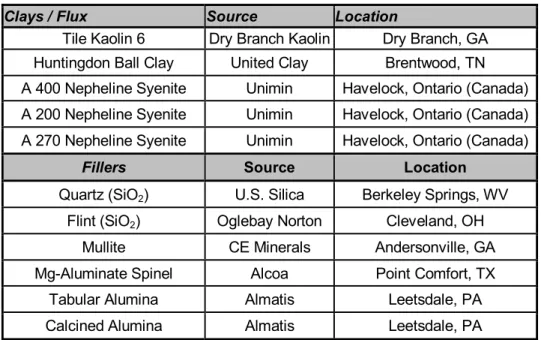
Porcelain bodies used in this investigation were those experimentally designed specifically for this investigation and also plastic bodies obtained from different industrial locations. During the course of this investigation, the different filler materials used in porcelain A were quartz, alumina, spinel and mullite. This composition was developed through an experimental design that optimized compaction in an industrial furnace, while at the same time containing sufficient filler material so that the effect of variations in this filler could be easily observed.111 It was wet processed, filter pressed and vacuum extruded in small batches of 50 kg (40-L suspensions).
Some of the groups requiring less material, in the order of 5 kg (mullite A, spinel A), were dewatered with a baroid filtration system. Apart from the different filler materials, both these compositions contain the same raw materials. In this investigation, different filling materials of different particle sizes were systematically analyzed to gain an appreciation of their contributions (or lack thereof) to the strength of a porcelain body.
An alumina-rich compound was selected for this study (AR-70, Alcoa, Inc., Point Comfort, TX).
First, separate suspensions of non-plastic materials (fillers, melts) were made, suspending the non-plastic materials in water, and then adding 15% (by weight) of clay. The entire cell is under air pressure at the top, which forces water out of the bottom of the cell, creating a hardened layer of plastic body material. Three-point bending specimens were marked exactly in the middle of the specimen, at the exact location where the load point is.
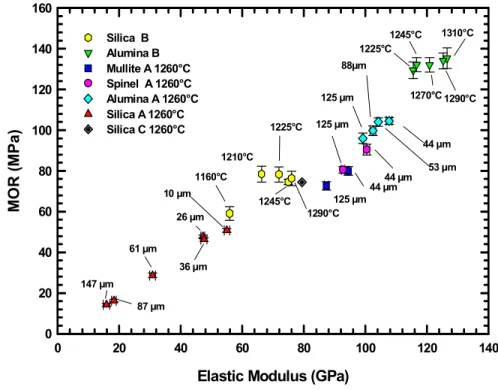
Each specimen was marked where these stress points were in contact with the specimen, indicating the area between the stress points where failure of the specimen was expected to occur. These values for Poisson's ratio together with the sample bulk density (ρ) (Table XIV) were used to calculate the modulus of elasticity (E) of the material. Four-point values of MOR and modulus of elasticity for all tested compositions, including the ratio of the two properties.
The ratio of elastic modulus to failure stress is also listed, to give some indication of the relative magnitudes of the values.
Determining Critical Flaw Size via the Griffith Equation
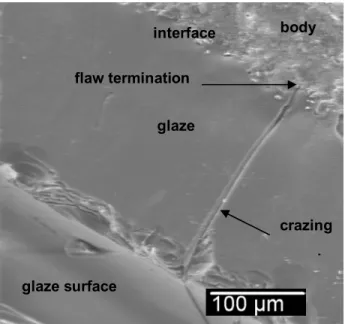
The length of the pre-crack is not precisely controlled, but can be accurately measured on the fracture surface after testing. By measuring the thickness of the enamel layer at the fracture site, the critical fracture size becomes known. This phenomenon was observed in all samples, proving that the surface defects generated are equal to the thickness of the enamel.
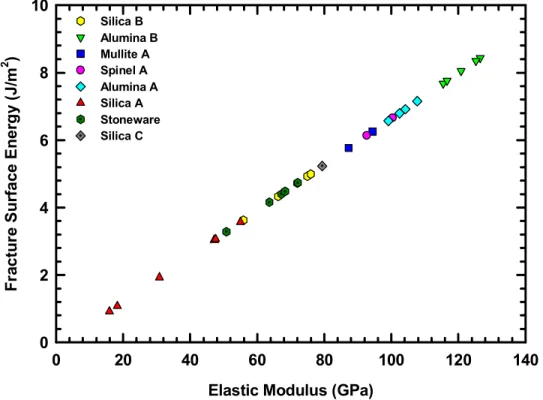
The relationship established between measured elastic modulus and fracture surface energy for porcelain bodies allows the prediction of fracture surface energies for each of the porcelain bodies used in this investigation. What is important to note about Figure 28 is the relative values for surface energy of the different compositions. Alumina porcelain occupies the higher end of the plot with surface energy values between 7 and 9 J/m2.
In the unglazed sample, the critical error size is assumed to be smaller, since the measured strength of the body is much higher.
Evaluation of Fired Microstructure and Strength
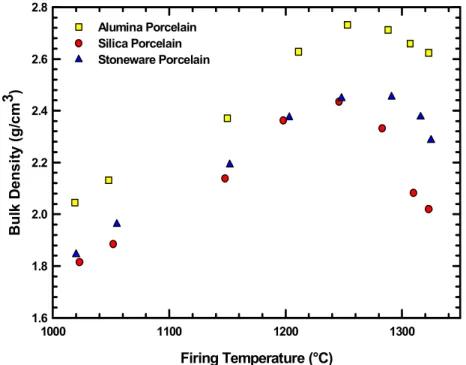
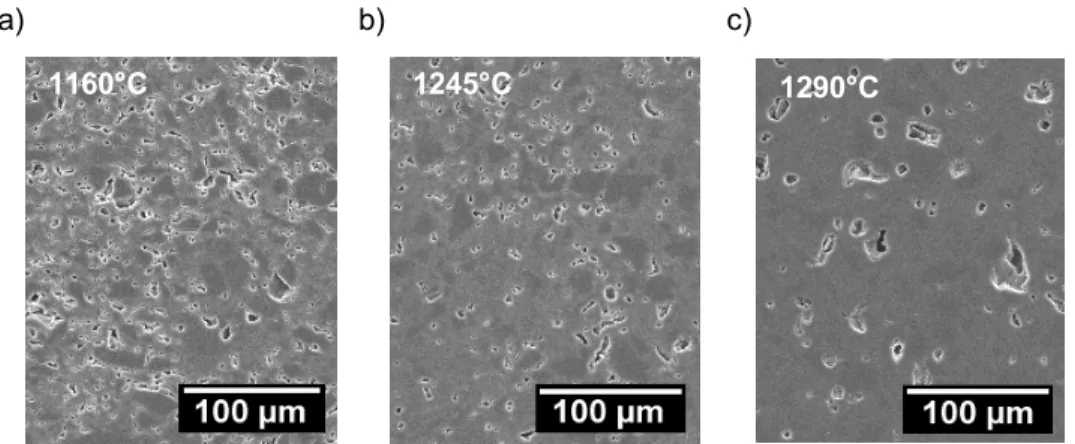
This expansion occurs as a result of the pressure in the bubble exceeding the viscosity of the glass phase. The temperature corresponding to the maximum was considered to be in the center of the fire path. Two other temperatures, considered to be within the firing range of the porcelain (one above and one below this maximum) were also selected.
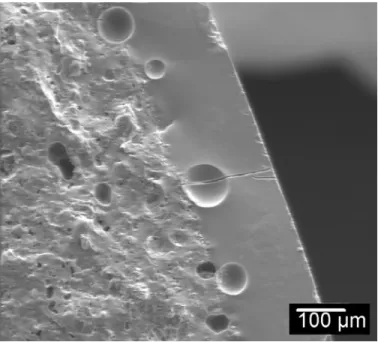
It is also one of the more uncontrolled variables (there are always minor temperature fluctuations depending on the location of the sample). Figures 35–49 show well the extent of porosity in the samples and it can be seen that there is no evidence that individual pores approach the calculated critical flaw size. Instead, it is suggested that the critical crack is caused by a collection of filler particles that contain voids between them in the order of the calculated critical crack size.
The lack of a ratio indicates that the critical error size is independent of the density of these bodies.
Evaluation of Filler Particle Contributions to Strength
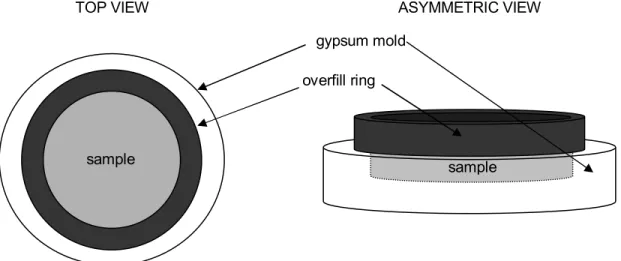
To measure the residual stress in the filler grains, disks were made using the four porcelain A compositions and the slip-casting technique described in section 3.1.1, each using different size fractions of the appropriate filler material. This is confirmed by the fact that the d-spacing of the spinel (400) X-ray peak increases with increasing particle size, indicating that the strain increases in the positive direction. Although no spontaneous cracking of quartz occurs below 87 µm, there is some degree of pre-existing residual stress in the system before the start of the flexural test.
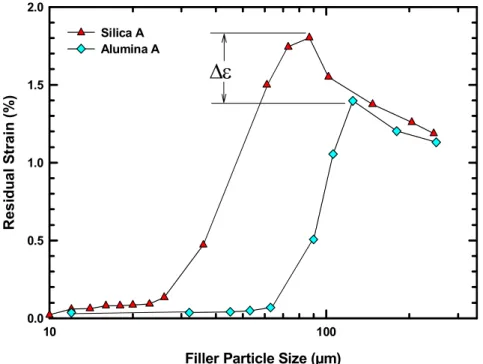
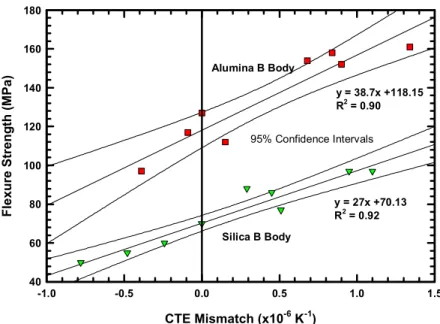
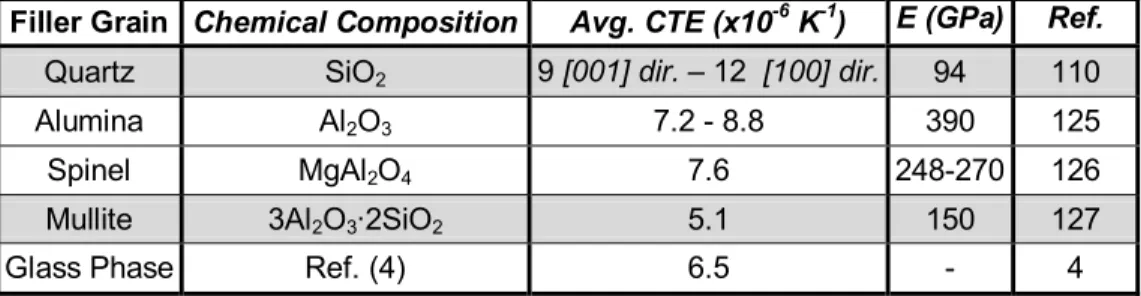
Although it appears that residual stresses are purely detrimental to the strength of the body, i.e. at the onset of substantial residual stress (stress) the strength decreases rapidly. Above this magnitude, stress fields can overlap, causing increased compression; however, the amount of total stress in the system is such that the deleterious effects of residual stress exceed the beneficial effects of the prestressed system. Therefore, it is recommended to choose filler materials with a CTE greater than that of the glass phase.
As the particle size increases further, the residual strain exceeds the strain limit of the filler, even in the presence of no applied strain.
Therefore, each volume element of the specimen experiences exactly the same strain while under constant tensile strain. Inside the sample there is a stress gradient that varies with the relative distance from the surface to the neutral axis. The tensile specimen fails at the point of maximum failure, independent of its position in the specimen.
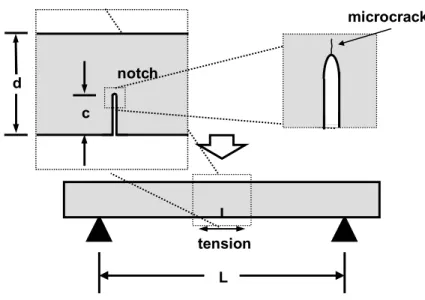
Changing location in the (x,y) plane does not change the state of stress, provided it is confined within the internal span of the specimen. A theoretical model of the interaction volume during a four-point bending test was created using a mathematical model. Schematic 4-point bending apparatus with exploded view of tensile strength profile as a function of the internal span below the neutral axis.
Each plane was assigned a z value increasing from 0 to 100, such that the plane z=0 represents the traction surface of a rectangular bar, and z=100 represents the plane at the neutral axis of the bar.
Tensile surface
A fault anywhere in this plane experiences the highest stress; and, assuming uniform error magnitude, it will fail first; therefore, the error in the plane closest to the tensile surface limits the strength. Schematic side view of four-point bending specimen showing specific fault location and stress levels. For each series of 20 specimens, the mean and standard deviation of simulated strength were recorded, in the same manner as a real four-point bending test.
Since the tensile surface of a four-point bending specimen is under the highest stress, it is assigned a stress value of x units. Planes located away from the traction surface, in a fixed load condition, will experience less stress. If the model parameters require a defect to experience a stress of x before propagating, then a defect located at position A would cause the specimen to fail at the lowest strength (60 MPa in the case of this model).
If the cracks occupied all locations (A – E), the expected strength would still be 60 MPa due to the presence of the crack at the location.
Stress Position
Conclusions
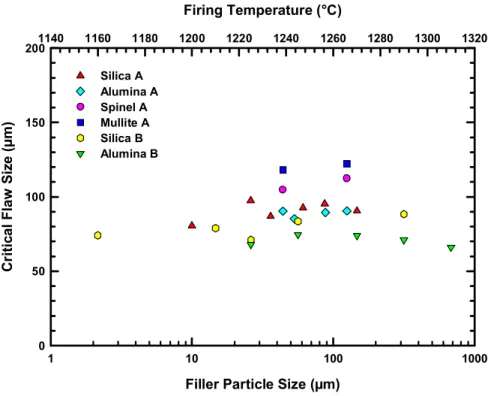
However, results indicated that measured critical error magnitude was essentially unaffected by changes in firing temperature. The data indicate no strong correlation between critical flaw size and filler particle size or species, maintaining a relatively constant value for each composition over the entire size range tested. Individually, each composition maintained a critical error size that was essentially constant, with standard deviations of ± 4 µm or less.
In fact, data from this investigation show no correlation between critical flaw size and primary filler particle size. Data indicate no strong correlation of critical flaw size with firing temperature, bulk density, filler particle size or type. What has been observed is that critical error size for a given composition is virtually identical regardless of treatment.
Among the samples produced using the same process or at the same location, the critical flaw size was virtually identical.
Suggestions for Future Work
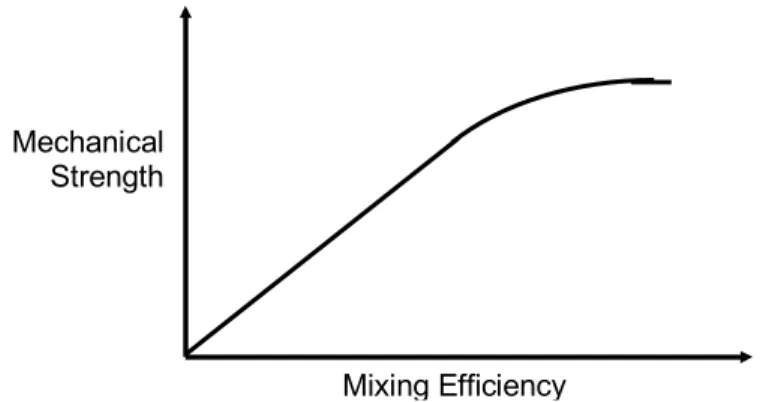
It is suggested that as the mixing efficiency increases, the strength of the material will increase and approach the maximum value (Figure 81). Due to the large number of cracks on the surface of the test subject, the question arises whether the amount of cracks on the surface of the body affects the mechanical properties of the material, more precisely the breaking surface energy. This investigation made several claims regarding the identity of critical flaws in porcelain.
Two of the transducers are placed at either end of the specimen, and one is placed on the surface under compression. This allows the calculation of the distance from the transducer to the critical fault in terms of the geometric location of points in the form of a sphere with radius r. Coble, "A Review of the Effect of Microstructure on the Mechanical Behavior of Polycrystalline Ceramics," NBS Monogr.
Ishida, “Al2O3-strengthened feldspathic porcelain bodies: Effects of amount and size of aluminum particles,” Ceram.