Prototyping Diverse Synthetic Biological Circuits in a Cell-Free Transcription-Translation System
Thesis by Shaobin Guo
In Partial Fulfillment of the Requirements for the degree of
Doctor of Philosophy
CALIFORNIA INSTITUTE OF TECHNOLOGY Pasadena, California
2017
(Defended May 10, 2017)
ã 2017 Shaobin Guo
ORCID: 0000-0001-9736-4078 All Rights Reserved
ACKNOWLEDGEMENTS
It has been a great experience to study here at California Institute of Technology for the past 6 years (2011-2017). I cannot be more grateful for the opportunity to come from Xiamen University, China to the United States to pursue my doctorate degree.
Not only do I expand my knowledge in biological sciences, but I also learn to live in a foreign country, speak a different language, appreciate the similarities and differences between China and US.
First, I would like to thank my PhD advisor Prof. Richard Murray for his tremendous support and mentorship for the past 5 years. It has been a great pleasure to work with him and learn from him. He left me room to work and think independently but was always there when I needed help and guidance. During some of the most difficult times here at Caltech, it was his encouragement and comfort that carried me through the challenges.
I would also like to extend my acknowledgements to my thesis committee members, Prof. Michael Elowitz, Lea Goentoro, and Paul Sternberg for their invaluable support and advice, and all the other professors, who encouraged and helped me during my PhD time here, Prof. Doug Rees, Bil Clemons, Shu-ou Shan, and Jackie Barton.
Being part of the Murray lab is a wonderful experience, because of the people here. I would like to thank my previous and current colleagues for being so helpful and understandable. It was always a mixed feeling when fellow Murray lab members graduated and left us for good, and sadly it is now my turn to say goodbye to the lab, to the lab mates, and to the friends.
Lastly, I would like to thank my family for their unconditional love. To my parents: Thank you for bringing me to this world and raising me up to be the person I am today. Thank you for the daily video chats that accompany me when I miss home. I am so fortunate to have you in my life and there is no word that can fully express my gratitude to both of you. I love you. 致我的父母亲:感谢您们带我来 到这个世界并将我抚养长大。感谢您们每天跨洋视频的陪伴,抚慰我的思乡 之情。能有您们在我的生命中,我感到无比幸福,千言万语尽在不言中。我 爱您们。
To my wife, Cecilia: I did not believe in fate and destiny until I met you. Although we both came from Fuzhou, China, we did not know each other until we met here in Los Angeles. I am so lucky to fall in love with you and get married to you. Thank you for bringing our daughter to the world. Because of you, I have had so much more fun in life than ever before. I am looking forward to all the new adventures that we are going to experience together. Like the saying goes: life is great now, but the best is yet to come. I love you.
To my daughter, Rory: My little girl, you are the greatest gift ever in my life. It is you who reminds me that life can be full of surprise and happiness. It is always a dilemma: I cannot wait for you to grow up and be able to read this (and my research) but I am afraid that I am going to miss the little chubby baby that you are now. I love you.
ABSTRACT
Synthetic biological circuits are the foundation for the ultimate goals of controlling cells and building artificial cells from the ground up. To get closer to these goals in a more efficient way, we utilize a cell-free transcription-translation system to help perfect biological circuits for the simplicity, freedom, and convenience that the system offers. In this thesis, we demonstrate three distinct aspects of biological circuits in a cell-free transcription-translation system: circuit dynamics, phosphorylation, and membrane proteins. We start with a simple feedforward circuit, which shows dynamic responses to the input. We first prototype the feedforward circuit in the cell-free system with the aid of mathematical modeling. Then, based on the knowledge learned from prototyping, we successfully implement the circuit in cells. Not only do we show that a circuit with dynamics can be prototyped in the cell- free system, but we also test a more complicated circuit involving a phosphorylation cycle. The phosphorylation-based insulator circuit is prototyped and then a model created for the circuit is shown to be identifiable in the cell-free system. To further expand the capability of the cell-free system, we demonstrate that biologically active membrane proteins can be generated in the cell-free system with engineering, suggesting that even biological circuits requiring membrane proteins can be prototyped in the system. These results help advance our knowledge of both biological circuits and the cell-free transcription-translation system, and bring us one step closer to our ultimate goals of implementing control theory in synthetic biology.
PUBLISHED CONTENT AND CONTRIBUTIONS
[1] Guo, S. and R.M. Murray, Prototyping And Implementation Of A Novel Feedforward Loop In A Cell-Free Transcription-Translation System And Cells.
bioRxiv, 2017. DOI: https://doi.org/10.1101/123190.
S.G. and R.M.M. conceived the idea. S.G. designed the experiments, performed the experiments and subsequent data analysis, and wrote the manuscript. R.M.M provided comments on the manuscript.
[2] Guo, S., E. Yeung, and R.M. Murray, Implementation and System Identification of a Phosphorylation-Based Insulator in a Cell-Free Transcription-Translation System. bioRxiv, 2017. DOI: https://doi.org/10.1101/122606. (Submitted)
S.G. and E.Y. contributed equally to this work. S.G., E.Y. and R.M.M. conceived the idea. S.G. and E.Y. designed the experiments, performed the experiments and subsequent data analysis and wrote the manuscript. R.M.M. provided comments and revised the manuscript.
[3] Guo, S., A. Vaish, Q. Chen, and R.M. Murray, Expressing Biologically Active Membrane Proteins in a Cell-Free Transcription-Translation Platform. bioRxiv, 2017. DOI: https://doi.org/10.1101/104455. (Undergoing internal review)
S.G., A.M., Q.C. and R.M.M. conceived the idea. S.G. designed the experiments, performed the experiments and subsequent data analysis and wrote the manuscript.
A.M. participated in the design and execution experiments. A.M., Q.C. and R.M.M.
provided comments and revised the manuscript.
TABLE OF CONTENTS
Acknowledgements………...iii
Abstract ………iv
Published Content and Contributions………...v
Table of Contents………. vi
List of Illustrations and/or Tables………vii
Introduction ... 1
Chapter 1: Prototyping and implementation of a novel feedforward loop in a cell-free transcription-translation system and cells ... 3
1.1 Introduction ... 4
1.2 Circuit design and simulations ... 6
1.3 Linear DNAs and plasmids construction and prototyping in TX-TL .... 9
1.4 Implementation of the biocircuit in cells ... 11
1.5 Discussion ... 12
Materials and Methods ... 15
Supplementary Materials Implementation of the feedforward loop composed of LasR and pLas ... 18
Chapter 2: Implementation and system identification of a phosphorylation based insulator in a cell-free transcription-translation system ... 23
2.1 Introduction ... 25
2.2 Demonstration of Retroactivity in TX-TL ... 28
2.3 Demonstration of the Insulation Capability of the PBI Circuit ... 30
2.4 Estimation of Constitutively Expressed Protein Concentrations ... 34
2.5 Derivation of A Simplified Model for the PBI ... 45
2.6 System Identification of the Simplified PBI Model ... 51
2.7 Simulations ... 60
2.8 Conclusion ... 62
Materials and Methods ... 64
Supplementary Materials Supplementary Figures ... 66
Brief introduction on retroactivity and how to attenuate it ... 69
Chapter 3: Expressing biologically active membrane proteins in a cell-free transcription-translation platform ... 74
3.1 Introduction ... 76
3.2 Results and Discussion ... 78
3.3 Conclusions ... 87
Materials and Methods ... 89
Supplementary Materials Supplementary Figures ... 92
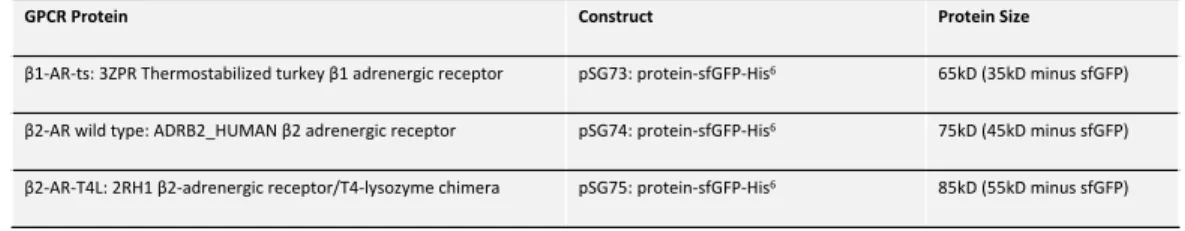
SM1 The trials and errors of the expressions of β1AR/ β2AR proteins in TX-TL ... 94
SM2 Expressing a chimera potassium channel membrane protein KcsA-Kv1.3 in TX-TL ... 108 Appendix I: Quantification of Terminator Strengths Using Linear DNAs in TX-TL ... 115 Conclusion and Future Directions ... 120 Bibliography ... 122
LIST OF ILLUSTRATIONS AND/OR TABLES
Page Chapter 1 ...
Figure 1: Diagrams of feedforward loops ... 5
Figure 2: Simulations of the FFL ... 8
Figure 3: Experimental results of the FFL ... 10
Figure S1: Illustration diagram of the FFL composed of LasR ... 18
Figure S2: Time course data from the in vivo experiment of the LasR FFL ... 19
Figure S3: Time course of the selected pLas promoter ... 20
Figure S4: Time course data from the experiment of the optimized LasR FFL ... 21
Figure S5: Microscope movie snapshots of the optimized LasR FFL ... 22
Chapter 2 ... Figure 1: Demonstration of the retroactivity in the TX-TL system ... 29
Figure 2: Implementation of the PBI circuit in the TX-TL system ... 31
Figure 3: Data featuring mSpinach expression on linear DNA ... 40
Figure 4: Fitting plots of 𝑑𝐺𝐹𝑃/𝑑𝑡 against pGlnA and 𝑃h/𝐾 ... 59
Figure 5: Simulation results of the PBI circuit based on system identification ... 61
Figure S1: Demonstration of the phosphorylation cycle in TX-TL ... 66
Figure S2: Test the temperature sensitivity of the PBI circuit ... 67
Figure S3: Linear regression to estimate the GFP production rate ... 68
Figure S4: A schematic illustrating the structure and function of the PBI ... 70
Chapter 3 ... Table 1: Information of GPCR constructs used in experiments ... 78
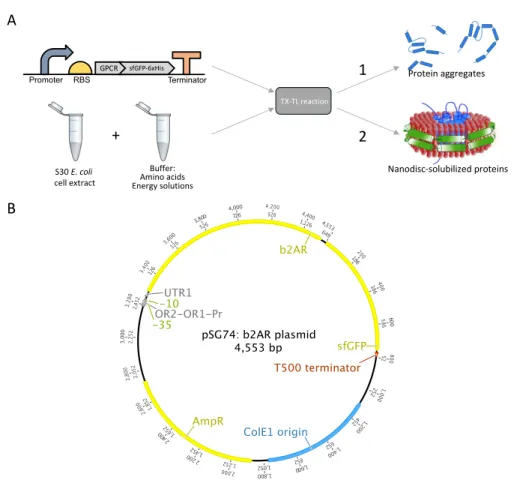
Figure 1: Illustration of the TX-TL experimental setup ... 79
Figure 2: Expression of pSG73-75 constructs in TX-TL ... 81
Figure 3: Western blots of TX-TL reactions ... 83
Figure 4: Binding assays of TX-TL made β1 and β2 adrenergic receptor ... 86
Figure S1: Bar chart showing the impact of various detergents on TX-TL ... 92
Figure S2: Bar chart of carazolol fluorescence fold change ... 93
Figure S3: Illustration diagram of linear DNAs used for expression in TX-TL ... 95
Figure S4: Bar chart of the expression from constructs of interest ... 96
Figure S5: Gel results of the first test ... 97
Figure S6: Bar chart of the expression from constructs of interest in 2nd test ... 98
Figure S7: Gel results of the 2nd test ... 100
Figure S8: Bar chart of the expression from constructs of interest in 3rd test ... 102
Figure S9: Gel results of the 3rd test ... 105
Figure S10: Western blot results of fusion proteins with reducing agents ... 107
Figure S11: Gel results from Kv1.3 expression ... 109
Figure S12: Western blot results of pSG66 and pSG69 expressed in TX-TL ... 111
Figure S13: Western blot results of refolded Kv1.3 ... 113
Figure S14: Kv1.3 binding assay ... 114
Appendix I ... Figure 1: Illustration diagrams of constructs used for terminator strength assay ... 116
Figure 2: The terminator strength assay data ... 119
INTRODUCTION
The relatively recent rise of synthetic biology mainly begins with the publications of a synthetic repressilator [4] and a genetic toggle switch [5]. As more efficient biotechnology tools are being developed [6-10], the young field has advanced significantly [11, 12]. In this thesis, we focus on one important aspect of the synthetic biology – synthetic biological circuits. Biological circuits, the basis of synthetic biology, can be used to program cells to perform distinct functions, such as biosensors [13, 14], metabolites synthesis [15-17], and so on. However, the lack of modularity and robustness of some biological circuits often limits their applications [18, 19]. In order to deepen our understanding of biological circuits in a more efficient fashion, we utilize a cell-free transcriptional-translation system (TX- TL) to prototype, characterize, and implement the biocircuits [20, 21].
In Chapter 1, we demonstrate that a simple novel synthetic biological circuit, exhibiting dynamic response, can be prototyped in the TX-TL system with the aid of mathematical modeling. We further show that the characterized feedforward loop circuit can be implemented in cells with minimum optimizations. This chapter, together with previous studies [22-24], suggests that the TX-TL system is an easy- to-use, convenient, and efficient approach to prototype biocircuits.
In Chapter 2, built on our understanding from chapter 1, we prototype and characterize a more complicated biocircuit – a phosphorylation-based insulator – in the TX-TL system. We demonstrate that non-transcriptional regulations, such as a phosphorylation cycle, can be prototyped in the TX-TL system as well. Not without
its limitations, but TX-TL, as shown in this chapter, provides a useful system for not only circuit prototyping but also system identification. With the additional degrees of freedom provided by the TX-TL system (comparing to cell-based systems), we can identify the parameters of our mathematical model for this biocircuit using actual experimental data.
Finally, in Chapter 3, we discuss the possibility of expanding the capabilities of the TX-TL system. We demonstrate that biologically active membrane proteins can be expressed in the membrane-less TX-TL system with further engineering.
Membrane proteins, which consist of many important receptors and enzymes, will be valuable additions to the current biocircuit component library. The ability to prototype biocircuits involving membrane proteins in the TX-TL system will also be very beneficial to the field.
Supplementary materials included in this thesis also provide helpful insights into our progress of prototyping biocircuits in TX-TL. Specifically: we successfully prototype additional feedforward loop circuit in the TX-TL; we characterize the strengths of a group of genetic terminators on linear DNAs in the TX-TL; and we show that TX-TL made membrane proteins can be refolded into correct conformations.
C h a p t e r 1
PROTOTYPING AND IMPLEMENTATION OF A NOVEL FEEDFORWARD LOOP IN A CELL-FREE TRANSCRIPTION-TRANSLATION SYSTEM AND
CELLS Abstract
Building novel synthetic biological devices is a time-consuming task because of lengthy cell-based testing and optimization processes. Recent progress made in the cell-free field suggests that the utilization of mathematical models and cell-free transcription-translation testing platforms to systematically design and test novel synthetic biocircuits may help streamline some of the processes. Here we present a study of building a novel functional biological network motif from scratch with the aid of the mathematical modeling and the cell-free prototyping. In this work, we demonstrate that we were able to make a 3-promoter feedforward circuit from a concept to a working biocircuit in cells within a month. We started with performing simulations with a cell-free transcription-translation simulation toolbox. After verifying the feasibility of the circuit design, we used a fast assembling method to build the constructs and used the linear DNAs directly in the cell-free system for prototyping. After additional tests and assemblies, we implemented the circuit in plasmid forms in cells and showed that the in vivo results were consistent with the simulations and the outcomes in the cell-free platform. This study showed the usefulness of modeling and prototyping in building synthetic biocircuits and that we can use these tools to help streamline the process of circuit optimizations in future studies.
1.1 Introduction
Traditional methods for building synthetic biological circuits are labor-intensive and time-consuming [25]. Recent research progress on a cell-free bimolecular breadboard platform provides us with a potential tool to perform fast circuit prototyping in vitro [22-24]. The Escherichia coli-based cell-free transcription-translation system (TX-TL) is a “biomolecular breadboard” that allows us to quickly design, build, test, and debug novel synthetic biocircuits in vitro [20, 21]. Like a wind tunnel is to airplanes or a breadboard is to electronic circuits, TX-TL allows a biological engineer to quickly test, debug, and retest their biological circuits in vitro, bypassing the time-consuming steps of cloning, transformation, and cell growth, which are required for in vivo testing.
TX-TL is a cell-free system based on S30 cell extracts. The extracts have been optimized for in vitro biocircuits testing, which means it mimics the E. coli in vivo characteristics while preserving transcription, protein production capability, and regulatory mechanisms [20, 21]. Previous work has shown that, besides plasmids, linear DNAs can also be used in TX-TL for fast circuit prototyping with the protection from the RecBCD inhibitor bacteriophage gamS protein [22, 26].
Combine this with the mathematical modeling, and it is possible to rapidly design and characterize functional synthetic biocircuit modules, such as the gene regulation network motifs, in TX-TL.
Gene regulation networks are composed of a small set of recurring interaction
patterns called network motifs [27, 28]. Among all the common gene regulation network motifs, the incoherent type-1 feedforward loop (FFL) is one of the widely used and interesting ones [29]. This specific FFL is composed of two input transcription factors, one (𝑥) of which activates the other (𝑦), and both jointly regulate (activate or repress) a target gene (𝑧) (Figure 1A). Because there is a time delay between the activation of 𝑧 by 𝑥 and the repression of 𝑧 by 𝑦, it has been shown that this type of FFL can generate a temporal pulse of 𝑧 response.
Using this FFL as an example, here we demonstrate the process of using a mathematical model and the TX-TL prototyping platform to build novel synthetic biocircuits and characterize their behaviors. First, we verified our circuit design by
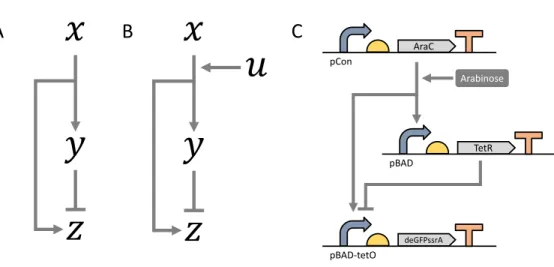
Figure 1: Diagrams of feedforward loops. A: The original feedforward loop illustration, composing of three components 𝑥, 𝑦 and 𝑧. Arrows mean activation and bars mean repression. B: The adapted feedforward loop illustration, with additional input 𝑢 to control the start of the activation. C: The actual biocircuit design for the feedforward loop. The activator AraC is at the 3’ of a constitutive promoter pCon.
Arabinose is the inducer input. The repressor is controlled by the promoter pBAD, which is regulated by AraC/arabinose. The reporter deGFPssrA is at the 3’ of a combinatorial promoter pBAD-tetO, which can be activated by AraC/arabinose but can also be repressed by TetR.
!
"
#
!
"
#
A B $ C
AraC pCon
TetR pBAD
deGFPssrA pBAD-tetO
Arabinose
performing simulations in a cell-free transcription-translation toolbox (TX-TL toolbox) [30]. Next, we built the constructs based on the verified design using a fast assembly method [31] and then we used the linear DNAs of these constructs directly for test in the TX-TL [21, 22]. After additional tests and assemblies, we implemented the FFL circuit in vivo and saw consistent results as in silico and in vitro. This study brought attention to utilizing mathematical models and the TX-TL prototyping platform when designing novel synthetic biocircuits. Instead of building and testing circuits directly in cells, we can save significant amounts of man-hours and streamline some of the prototyping steps involved in building new network motifs by properly employing this TX-TL system.
1.2 Circuit design and simulations
To make things simpler in both TX-TL and subsequent cell-based tests, we first optimized the circuit design. Instead of having 𝑥 directly turning on 𝑦 and 𝑧, we added another component (𝑢) to the circuit for better control (Figure 1B). For TX-TL and especially cell-based tests, we will put all three components of the circuit (𝑥, 𝑦, and 𝑧) into the testing platforms in the beginning. In order to control when the circuit should start the dynamics, an extra input is required. Without the presence of the input 𝑢, 𝑥 cannot activate any of the downstream components. But as soon as 𝑢 is added, the complex [𝑥: 𝑢] will activate both 𝑦 and 𝑧 and initiate the dynamics. In this case, the activation of 𝑦 and 𝑧 is positively correlated with 𝑢, and 𝑢 can be seen as an inducer that is required for 𝑥 to activate the downstream parts.
Having the basic design in mind, we looked for biological parts that would fit the requirements stated above. We decided to use the AraC-arabinose activation system as 𝑥: 𝑢 [32], a transcription factor TetR as the repressor 𝑦 [33] and deGFP fluorescent protein with the corresponding combinatorial promoter as output 𝑧 [34]
(Figure 1C). The transcription factor AraC binds to the promoter pBAD and activates the transcription of downstream genes (TetR and deGFP) only in the presence of the inducer arabinose. On the other hand, the transcription factor TetR binds to operator site tet and represses the transcription of deGFP. A small molecule anhydrotetracycline (aTc) can be used to sequester TetR proteins away from the operator and resume the transcription. Because of the time delay between the activation by AraC-arabinose and the repression by TetR, the deGFP gene will first be transcribed, and only after TetR proteins accumulate to certain threshold level (aTc can be used to extend the delay), the transcription of deGFP ceases. At the same time, the degradation ssrA tag on the deGFP protein leads to degradation of the protein [35]. As a result, the green fluorescence signal, which can be measured, will first increase and then decrease, generating a pulse-like behavior (Figure 2A).
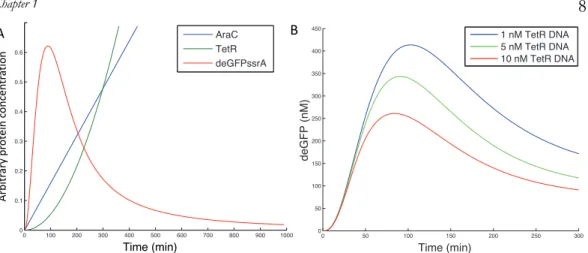
Simulations were performed using the TX-TL toolbox [30]. By tuning the parameters in the toolbox model, we verified the feasibility of our design through simulations. In Figure 2A, we can see that the model captures the pulse-like behavior of deGFP protein concentration, along with the increasing activator AraC
Chapter 1 8
concentration and repressor TetR concentration. The delay in the increase of TetR concentration and the degradation of deGFP proteins result in the pulse-like behavior in deGFP concentration.
In both the mathematical model and the TX-TL platform, we have fully control over the initial DNA concentrations for all the components. That gives us the freedom to change the circuit dynamics by simply changing the inputs – DNA concentrations.
In Figure 2B, we tested how the varied concentrations of the repressor TetR DNA can affect the deGFP dynamics with all the other components as constants. As the simulation result shows here, increasing TetR DNA concentrations not only brings down the peak deGFP concentrations, but also shifts the peak to the left, suggesting
Figure 2: Simulation results of the FFL using the TX-TL simulation toolbox. A:
Simulation of the time course of the arbitrary protein concentrations for all three circuit components. Initial AraC, TetR and deGFP DNA concentrations are set to be the same at 1. Arabinose concentration is also set to 1. AraC, which is controlled by a constitutive promoter, is assumed to be produced in a linear fashion. The pBAD promoter controlling deGFP is set to be stronger than the pBAD promoter controlling TetR, in order to extend the delay and produce significant amount of deGFP proteins.
B: Simulation of the time course of the deGFP protein concentrations with varied initial TetR DNA concentrations from 1 nM to 10 nM. Initial conditions for AraC and deGFP were 10 nM and the arabinose concentration was set to be 0.2%.
A
0 100 200 300 400 500 600 700 800 900 1000
0 0.1 0.2 0.3 0.4 0.5 0.6
Arbitray protein concentration
Time (min)
AraC TetR deGFPssrA
0 50 100 150 200 250 300
100 150 200 250 300 350 400
Time (min)
GFP (NFU)
1nM TetR DNA 5nM TetR DNA 10nM TetR DNA
pBAD-TetR
pBAD-tetO-deGFPssrA pLac-AraC
arabinose
0 50 100 150 200 250 300
100 150 200 250 300 350 400 450
Time (min)
deGFP (nM)
1nM TetR DNA 5nM TetR DNA 10nM TetR DNA
0 50 100 150 200 250 300 350 400 450
0 200 400 600 800 1000 1200 1400 1600 1800 2000
Time (min)
deGFP/OD
0.2% arabinose no arabinose
deGFP-no tag
0 50 100 150 200 250 300 350 400 450
0 100 200 300 400 500 600 700 800 900 1000 1100
Time (min)
deGFP/OD
0.2% arabinose no arabinose
deGFP-ssrA
A B C
D E
0 50 100 150 200 250 300
0 50 100 150 200 250 300 350 400 450
Time (min)
deGFP (nM)
1 nM TetR DNA 5 nM TetR DNA 10 nM TetR DNA
B
Arbitrary protein concentration
0 100 200 300 400 500 600 700 800 900 1000
0 0.1 0.2 0.3 0.4 0.5 0.6
Arbitray protein concentration
Time (min)
AraC TetR deGFPssrA
pBAD-TetR
pBAD-tetO-deGFPssrA pLac-AraC
arabinose
0 50 100 150 200 250 300
100 150 200 250 300 350 400 450
Time (min)
deGFP (nM)
1nM TetR DNA 5nM TetR DNA 10nM TetR DNA
0 50 100 150 200 250 300 350 400 450
0 200 400 600 800 1000 1200 1400 1600 1800 2000
Time (min)
deGFP/OD
0.2% arabinose no arabinose
deGFP-no tag
0 50 100 150 200 250 300 350 400 450
0 100 200 300 400 500 600 700 800 900 1000 1100
Time (min)
deGFP/OD
0.2% arabinose no arabinose
deGFP-ssrA
A B C
D E
0 50 100 150 200 250 300
0 50 100 150 200 250 300 350 400 450
Time (min)
deGFP (nM)
1 nM TetR DNA 5 nM TetR DNA 10 nM TetR DNA
that it takes less time for TetR protein to accumulate to the threshold level when there is more initial TetR DNA.
1.3 Linear DNAs and plasmids construction and prototyping in TX-TL
After verifying the circuit design using simulations, we decided to build the incoherent type-1 FFL shown in Figure 1C. We first designed and ordered primers (a day before) to amplify the coding sequences for AraC, TetR, and deGFPssrA. Then we used the GoldenBraid assembly method to stitch specific promoters, ribosome binding sites (RBSs), coding sequences (CDSs) and terminators together with plasmid vectors [31]. After 1 hour incubation, we amplified the linear DNAs containing Promoter-RBS-CDS-Terminator-Vector via PCR reactions. Then we used these linear DNAs to run experiments in TX-TL directly with the presence of gamS. From start to finish, one experiment cycle can be less than a day.
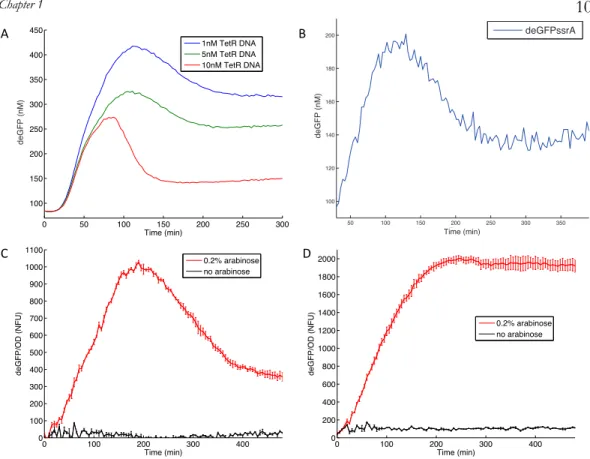
TX-TL experiments were run by simply mixing the extract and buffer with the inputs – DNAs (AraC, TetR and deGFP) and the inducer arabinose [21]. After mixing all together, GFP fluorescence was measured using a plate reader. Figure 3A showed the experimental results from TX-TL experiments. All the curves were consistent with the simulation: GFP signal first increased as a result of AraC-arabinose activation; then after TetR proteins accumulated to the threshold amount, they repressed the transcription of deGFPssrA and at the same time, ClpX protein, which is an ATPase, unfolded the tagged deGFP proteins and caused the reduction of GFP signal [36]. As we can also see in the figure, the more the TetR DNAs were added,
Chapter 1 10
the lower the GFP signal was and the faster the signal reached peak; this is also consistent with our simulations. However, it is easy to notice that the steady state GFP protein concentrations for different initial TetR DNA concentrations were different. This is because TX-TL reactions have limited resources, including RNA polymerases, NTPs, ribosomes, and amino acids [37]. The energy required for ClpX
Figure 3: Experimental results of the FFL in TX-TL and cells. A: The time course result of the FFL experiment in TX-TL with linear DNA: 10 nM AraC linear DNA, 10 nM deGFP linear DNA, 10 nM ClpX linear DNA, 0.2% arabinose, 0.1 µg/mL aTc and varied TetR linear DNA concentrations. Experiments were run at 29°C. B: The time course result of the FFL experiment in TX-TL with plasmid DNA: 2 nM AraC- TetR-deGFPssrA plasmid, 1 unit of purified ClpX protein, 0.2% arabinose and 0.01 µg/mL aTc. Experiments were run at 29°C. C, D: The time course results of the FFL experiments in cells. C: deGFP protein is tagged with ssrA degradation tag. D:
deGFP does not have a degradation tag. GFP signals, which were average from three independent repeated wells, were measured using a plate reader and then data were normalized using OD600 readings to get the fluorescence reading for each cell. The concentration of the inducer arabinose is 0 or 0.2%. Experiments were run at 37°C.
0 100 200 300 400
0 100 200 300 400 500 600 700 800 900 1000 1100
Time (min)
deGFP/OD (NFU)
0.2% arabinose no arabinose
0 100 200 300 400
0 200 400 600 800 1000 1200 1400 1600 1800 2000
Time (min)
deGFP/OD (NFU)
0.2% arabinose no arabinose
0 50 100 150 200 250 300
100 150 200 250 300 350 400 450
Time (min)
GFP (NFU)
1nM TetR DNA 5nM TetR DNA 10nM TetR DNA
A
C D
50 100 150 200 250 300 350
100 120 140 160 180 200
Time (min)
deGFP (nM)
deGFPssrA
B
50 100 150 200 250 300 350
100 120 140 160 180 200
Time (min)
deGFP (nM)
deGFPssrA
50 100 150 200 250 300 350
100 120 140 160 180 200
Time (min)
deGFP (nM)
deGFPssrA
50 100 150 200 250 300 350
100 120 140 160 180
Time (min)
deGFP (nM)
50 100 150 200 250 300 350
100 120 140 160 180 200
Time (min)
deGFP (nM)
deGFPssrA
to unfold tagged deGFP proteins will run out gradually, and the resources will get used up faster when more DNAs are in the reaction. As a consequence, the GFP concentrations showed different steady state levels.
After we tested the linear DNA version of the FFL in TX-TL and found a working design, we assembled these linear DNAs into one plasmid using GoldenBraid assembly method in order to implement the circuit in cells. Before testing the plasmid version of FFL in vivo, we first evaluated the construct in TX-TL, as it is fast and convenient to set up TX-TL experiments and there is no need for the time-consuming step of growing cells. Figure 3B showed the results of the plasmid version of the FFL in TX-TL. The dynamics of the circuit were again consistent with those from both simulations and linear DNA circuit, suggesting that this specific circuit design had a good chance to work in cells.
1.4 Implementation of the biocircuit in cells
Following the test of expressing plasmid version of the FFL in TX-TL, we transformed that plasmid into E. coli cells. In addition, to make sure the decrease of GFP signal in vivo is specific to the GFP degradation by ClpX instead of the dilution introduced by cell division, we had a control circuit, in which the deGFP was not tagged with ssrA degradation tag. Figure 3 showed the experimental results from in vivo experiments of the FFL circuit (Figure 3C) and the control circuit (Figure 3D).
The dynamics shown in Figure 3C were clearly consistent with those shown in TX-TL experiments, meaning the FFL prototyped in TX-TL indeed showed the same
behavior in vivo. In contrast, the control circuit in Figure 3D did not exhibit a pulse- like behavior, suggesting that the pulse we saw in Figure 3C was not a result of dilution but was caused by the degradation of the GFP proteins.
1.5 Discussion
The idea of the cell-free TX-TL platform is not new, as there have been many studies on the original S30 cell extract since it first came out in the 1960s [38, 39]. However, most of the cell-free extracts were focusing on protein expression as an alternative option to making proteins in cells [40]. This specific TX-TL platform was developed with the goal of prototyping synthetic biocircuits in mind. TX-TL, along with the mathematical toolbox developed for it, can be the prototyping breadboard for synthetic biology. This work, together with other publications [20, 22-24, 37], serves as a testimony for that ambition. Expressing transcription factors and have them turning certain components on or off has been demonstrated before; but prototyping a synthetic biocircuit with spontaneous dynamics built in, such as an incoherent type-1 feedforward loop, is challenging. By tuning the parameters used by the mathematical model, we could get a sense of what strength of promoters and ribosome binding sites should be used in the actual biocircuit. Then we had to spend some amount of time characterizing specific parts, such as promoters, ribosome binding sites and coding sequences individually in TX-TL. From this preliminary parts library, then we could assemble our constructs and test the actual components in TX-TL. Because of the fast iteration time of this platform, we were able to finish all the above and the final implementation in cells within a month. Compared to the
first generation of biocircuits, we have shortened the development time significantly [4, 5]. We have also optimized a variant FFL circuit composed of a different activator in TX-TL and in cells (see “Implementation of the feedforward loop composed of LasR and pLas” in Supplementary Materials for details).
There are limitations to this protocol. First, there are limited resources in the TX- TL reactions and on top of that, there is competition of different components for the same transcription and translation machineries. One way to avoid this limitation is to set up reactions in compartments that only allow small molecules exchanges so that some resources, such as amino acids and NTPs, can be replenished. Second, it is challenging to use TX-TL data quantitatively to deduce the results in cells. Cell-free systems, no matter how we justify it, are different from cells. When TX-TL is used to help with prototyping novel synthetic biocircuits, it is recommended that the results are examined qualitatively instead of quantitatively. Although the absolute strengths of certain promoters and RBSs are different between TX-TL and cells, their relative strengths are comparable between the two systems. Third, the TX-TL simulation toolbox has its uncertainty and arbitrariness. The parameters used in the toolbox might not be physiologically reasonable despite the fact that we tried to refer to as many literature available parameters as possible. However, qualitatively we can use the simulation results as a reference; for example, we need one promoter to be stronger than the other promoter in order to achieve the desired dynamics and then we can have this information in mind when we design the actual biocircuits. In summary, though it is not a platform without its limitations, TX-TL could certainly
be used for rapid preliminary characterization and prototyping of synthetic biocircuits.
Materials and Methods
Cell-free experiment preparation and execution
Preparation of the cell-free TX-TL expression system was done according to previously described protocols [21], resulting in extract with conditions: 8.9 – 9.9 mg/mL protein, 5 mM Mg-glutamate, 40 mM K-glutamate, 1.5 mM each amino acid except leucine, 1.25 mM leucine, 50 mM HEPES, 1.5 mM ATP and GTP, 0.9 mM CTP and UTP, 0.2 mg/mL tRNA, 0.26 mM CoA, 0.33 mM NAD, 0.75 mM cAMP, 0.068 mM folinic acid, 1 mM spermidine, 30 mM 3-PGA, 2% PEG-8000.
TX-TL reactions were conducted in a volume of 10 µL in a 384-well plate (Nunc MicroWell 384-well optical bottom plates) at 29°C, using a three-tube system:
extract, buffer, and DNA. When possible, inducers such as arabinose or purified proteins such as gamS [26] were added to a mix of extract and buffer to ensure uniform distribution. For deGFP, samples were read in a Synergy H1 plate reader (Biotek) using settings for excitation/emission: 485 nm/525 nm, gain 61 or 100. All samples were read in the same plate reader, and for deGFP relative fluorescent units were converted to either nM (for TX-TL) or Normalized Fluorescent Unit (NFU for in vivo) using a purified deGFP-His6 standard to eliminate machine to machine variation (different Bioteks).
PCR product preparation and plasmid DNA assembly
Linear DNA fragments were amplified using Pfu Phusion Polymerase (New England Biolabs), DpnI digested for 5 min at 37°C (New England Biolabs) while verified with agarose gel electrophoresis, and PCR purified using previously described procedures.
Fragments were then assembled in vitro using Golden Gate assembly. For Golden Gate assembly, a 15 µL reaction was set up consisting of equimolar amounts of vector and insert, 1.5 µL 10X NEB T4 Buffer (New England Biolabs), 1.5 µL 10X BSA (New England Biolabs), 1 µL BsaI (New England Biolabs), and 1 µL T4 Ligase at 2 million units/mL (New England Biolabs). Reactions were run in a thermocycler at 10 cycles of 2 min/37°C, 3 min/20°C, 1 cycle 5 min/50°C, 5 min/80°C. For Golden Gate assembly, constructs with internal BsaI cut sites were silently mutated beforehand using a QuikChange Lightning Multi Site-Directed Mutagenesis kit (Agilent). For both methods, assembled circular DNAs were transformed into electrocompetent or chemically competent cells: a KL740 strain (lab made competent strain) if using an OR2-OR1 promoter (29°C), a MG1655 strain (lab made competent cells) for circuit testing, and a JM109 strain (Zymo Research) for all other constructs.
KL740 upregulates a temperature sensitive lambda cI repressor. PCR products were amplified using Pfu Phusion Polymerase (New England Biolabs) for all constructs, and were DpnI digested. Plasmids were miniprepped using a Qiagen mini prep kit.
All plasmids were processed at stationery phase. Before use in the cell-free reaction, both plasmids and PCR products underwent an additional PCR purification step using a QiaQuick column (Qiagen), which removed excess salt detrimental to TX-
TL, and were eluted and stored in 10 mM Tris-Cl solution, pH 8.5 at 4°C for short- term storage and −20°C for long-term storage. All the plasmids used in the work can be found on https://www.addgene.org/.
In vivo experiment
All in vivo experiments were performed in E. coli strain MG1655. Plasmid combinations were transformed into chemically competent E. coli MG1655 cells, plated on Difco LB+Agar plates containing 100 µg/mL carbenicillin and incubated overnight at 37°C. Plates were taken out of the incubator and three colonies were picked and separately inoculated into 5 mL of LB containing carbenicillin and/or chloramphenicol, and/or kanamycin at the concentrations above in a 14 mL Falcon Round-Bottom Polypropylene Tubes (Fisher Scientific), and grown approximately 17 h overnight at 37°C at 200 rpm in a benchtop shaker. This overnight culture (100 µL) was then added to a new 14mL tube containing 5 mL (1:50 dilution) of Minimal M9 casamino acid (M9CA) media [1X M9 salts (42 mM Na2HPO4, 24 mM KH2PO4, 9 mM NaCl, 19 mM NH4Cl, 1 mM MgSO4, 0.1 mM CaCl2, 0.5 µg/ml thiamine, 0.1% casamino acids, 0.4% glycerol) containing the selective antibiotics and grown for 4 h at the same conditions as the overnight culture. Then 10 µL cultures were transferred to 96-well glass bottom plate with 290 µL M9 with corresponding experimental conditions. Plates were shaken and GFP fluorescence (485 nm excitation, 525 nm emission), and optical density (OD, 600 nm) were measured using a Biotek Synergy H1m plate reader at 37°C at the highest speed for 12 hours.
Supplementary Materials
Implementation of the feedforward loop composed of LasR and pLas
Besides the feedforward loop (FFL) circuit we designed, prototyped, and implemented in the main article, we also tested a FFL designed by Zachary Sun, which had AraC, arabinose, pBAD, and pBAD-tetO replaced by LasR, N-(3- Oxododecanoyl)-L-homoserine lactone (AHL), pLas, and pLas-tetO, respectively.
The circuit design is shown in Supplementary Figure S1.
Supplementary Figure S1 Illustration diagram of the FFL composed of LasR. The arrows mean activation and the bars mean repression.
The promoter J23151 is a constitutive promoter [41]. LasR protein, in the presence of the inducer AHL, becomes an activator that can turn on both pLas and pLas-tetO promoters. All the other components work like the AraC FFL, and the time course data of the LasR circuit from in vivo experiments are shown in Supplementary Figure S2.
LasR
J23151
TetR pLas
GFPssrA pLas-tetO
AHL
aTc
Supplementary Figure S2 Time course data from the in vivo experiment of the LasR FFL circuit in MG1655 E. coli cells.
Detailed experiment setup was described in the Materials and Methods. Briefly, 4 AHL concentrations were used in the experiment, from 0 to 100 nM. 20 ng/mL of aTc was added to all of them. GFP fluorescence and OD600 measurements were done using a Biotek plate reader. GFP data was subtracted by the background and then normalized with OD data to get the normalized fluorescence unit (NFU).
Though the LasR FFL works in a similar way as the AraC FFL, one problem with the LasR FFL circuit was that the aTc, which would bind to TetR proteins and sequester them away from tetO, had to be added to extend the delay to create significant pulses. This was due to the leaky expression of the pLas promoter. To make the circuit more robust, we engineered the pLas promoter to be more tightly controlled by LasR-AHL via prototyping different variants of pLas promoters in TX- TL. The one we found working very robustly is shown in Supplementary Figure S3 and the sequence of that pLas variant can be found on https://www.addgene.org/. As we can see in the figure, only when both LasR and AHL were added, we could see the activation of the pLas-GFP. Neither LasR nor AHL alone could activate the promoter and there was little to no leaky expression from the promoter itself. TetR
-2 0 2 4 6 8 10 12 14
Time (h) -5
0 5 10 15 20 25 30
GFP/OD NFU
0 AHL 10nM AHL 50nM AHL 100nM AHL
and aTc were tested to make sure that the pLas promoter, without the tetO part, could not be affected by them.
Supplementary Figure S3 Time course of the selected pLas promoter with GFP at its 3’. Experiments were run with 10 nM pLas-GFP linear DNA with or without the additional components/inducers listed in the legend. If used, the pCon- LasR linear DNA was 10 nM, pCon-TetR linear DNA was 10 nM, AHL was 50 nM and aTc was 20 ng/mL. The GFP fluorescence data was subtracted with background and then normalized using GFP protein calibration data on a Biotek plate reader.
We then modified the LasR FFL circuit with this exact promoter and we were able to generate pulse-like behavior in cells without adding any aTc. The in vivo data is shown in Supplementary Figure S4. As we can see, when there was no AHL added, we got no response from the circuit. Only when we had significant activation caused by AHL (more than 50 nM in this case) would we see pulse-like behavior from the circuit in cells, and the highest peaks of the pulses were positively correlated with the inducer concentrations.
0 2 4 6 8 10 12
Time (h) -0.5
0 0.5 1 1.5 2 2.5
GFP NFU per 10nM DNA
Reporter only LasR AHL LasR+AHL LasR+AHL+TetR LasR+AHL+TetR+aTc
Supplementary Figure S4 Time course data from the in vivo experiment of the optimized LasR FFL circuit in MG1655 E.
coli cells. Detailed experiment setup was described in the Materials and Methods. Briefly, 4 AHL concentrations were used in the experiment, from 0 to 100 nM. 20 ng/mL of aTc was added to all of them. GFP fluorescence and OD600 measurements were done using a Biotek plate reader. GFP data was subtracted by the background and then normalized with OD data to get the normalized fluorescence unit (NFU).
Not only did we test the circuit quantitatively in bulks, but we also examined the circuit behavior qualitatively in a microfluidic device, also known as the mother machine. The mother machine consists of a series of growth channels that can trap single bacterial cells inside, and is designed to allow growth medium to pass through at a constant rate, which results in diffusion of fresh medium into the growth channels as well as removal of cells as they emerge from the channels into the main trench [42]. As we can see in Supplementary Figure S5, while cells were growing and dividing in a narrow comb-like space, they showed green fluorescence intensity starting from weak to strong and then back to weak with the same media keeping the inducer AHL concentration constant at 50 nM.
-2 0 2 4 6 8 10 12 14
Time (h) -5
0 5 10 15 20
GFP/OD NFU
0 AHL 10nM AHL 50nM AHL 100nM AHL
Supplementary Figure S5 Microscope movie snapshots of the optimized LasR FFL. Each frame was taken 10 minutes apart.
Cells were grown using the same in vivo method described in the Materials and Methods. Fluorescence microscopy imaging was performed on an Olympus IX81 inverted fluorescence microscope using a Chroma wtGFP filter cube (450/50 BP excitation filter, 480 LP dichroic beamsplitter, and 510/50 BP emission filter), with an XFO-citep 120 PC light source at 100
% intensity and a Hamamatsu ORCA-03G camera. Cells were imaged using a 100x phase objective with oil.
C h a p t e r 2
IMPLEMENTATION AND SYSTEM IDENTIFICATION OF A PHOSPHORYLATION-BASED INSULATOR IN A CELL-FREE
TRANSCRIPTION-TRANSLATION SYSTEM Abstract
An outstanding challenge in the design of synthetic biocircuits is the development of a robust and efficient strategy for interconnecting functional modules. Recent work demonstrated that a phosphorylation-based insulator (PBI) implementing a dual strategy of high gain and strong negative feedback can be used as a device to attenuate retroactivity. This paper describes the implementation of such a biological circuit in a cell-free transcription-translation system and the structural identifiability of the PBI in the system. We first show that the retroactivity exists in the cell-free system by testing a simple negative regulation circuit. Then we demonstrate that the PBI circuit helps attenuate the retroactivity significantly compared to the control. We consider a complex model that provides an intricate description of all chemical reactions and leveraging specific physiologically plausible assumptions. We derive a rigorous simplified model that captures the output dynamics of the PBI. We performed standard system identification analysis and determined that the model is globally identifiable with respect to three critical parameters. These three parameters are identifiable under specific experimental conditions and we performed these experiments to estimate the parameters. Our experimental results suggest that the
functional form of our simplified model is sufficient to describe the reporter dynamics and enable parameter estimation. In general, this research illustrates the utility of the cell-free expression system as an alternate platform for biocircuit implementation and system identification and it can provide interesting insights into future biological circuit designs.
2.1 Introduction
The successful design and implementation of the inaugural biocircuits, such as the genetic toggle switch and the repressilator, have demonstrated the possibility of modularity in synthetic biological circuits [4, 5]. The recognition of functional modules makes building large and complicated synthetic biological circuits possible.
Basic modules can be studied and tested in isolation and then can be connected with other modules to perform certain functions. However, the modularity of biological circuits can change when interconnections are made. This effect is called retroactivity and is a fundamental issue in systems engineering [43, 44]. This means that when a downstream system is connected to another system, the downstream system will affect the behavior of upstream component. As a result, the signal generated by the upstream component may not be effectively transferred to other components.
Retroactivity can be divided into two types based on which signal it affects: the retroactivity to the input and the retroactivity to the output. Based on previous theoretical studies, an operational-amplifier-like orthogonal biomolecular device could help attenuate retroactivity [43]. An electronic operational amplifier absorbs little current from upstream; as a result, there is almost no voltage drop to upstream output. At the same time, the retroactivity to the output is attenuated because of a large amplification gain and an equally large negative feedback loop (Details are described in “Brief introduction on retroactivity and how to attenuate it” in Supplementary Materials). Based on these ideas and previous work [45], we tested
an insulator design using nitrogen regulation proteins [46] in a cell-free transcription- translation (TX-TL) system.
The TX-TL system developed in [20, 21] is an attractive candidate platform for such rapid prototyping. The system facilitates DNA-based expression on plasmids and linear DNA, and since linear and plasmid DNA can be prepared and expressed in the TX-TL system in a single day’s time [22], the time required to iterate over designs is considerably reduced.
Another powerful aspect of the TX-TL system is the ability to directly modulate the concentration of different pieces of DNA encoding different biocircuit components. The ability to rapidly synthesize and test the effect of different promoter sites, ribosome binding sites, and other components, and simultaneously vary the DNA encoding these parts, permits a degree of freedom typically absent in cell-based assays. In this setting, iterating of prototypes can be assisted by predictive modeling of biocircuit dynamics. It is the ability to control DNA concentrations and rapidly vary structural properties of the biocircuit that allow us to address the problem of parameterizing a predictive model.
Cell-free systems have long been used to characterize fundamental parameters in biological systems [47]. In a synthetic biology context, especially for the phosphorylation-based insulator circuit, it is unclear what parametric information can be extracted from a series of systematic tests in an in vitro system, specifically the TX-TL system. With additional degrees of freedom in the experimental conditions,
the TX-TL system may be able to provide insight into model parameters that in vivo studies could not. Moreover, it is unclear what systematic tests should be carried out in order to retrieve this information. This paper investigates these issues using the phosphorylation-based insulator as a case study.
In general, a parametric model is globally structurally identifiable only under certain mathematical conditions [48]. These conditions are valid as long as the control variables enter the dynamical system as a multiplicative perturbation. However, as we will see with the phosphorylation-based insulator, even if the model retains this structure the model may not be globally identifiable because of the large number of parameters it contains, despite having only a couple output variables. As is often the case, a first principles model may be physically representative of the intricate reactions happening in the system, but carry a complexity that far exceeds the information present in the data. Thus, simplified models that are reflective of the low- dimensional output data, while also retaining the (controllable) experimental variables in the TX-TL system, are desirable.
In this work, we successfully implement the PBI circuit in TX-TL and further propose a complex model based on the fundamental processes of transcription, translation, and phosphorylation. The model is unwieldy to analyze so we rigorously derive a simplified model based on a series of physically realistic assumptions, show that it is globally identifiable with respect to the data, and perform a series of experimental perturbation tests to back out the simplified model parameters.
The main contributions of this work are the following: 1) we demonstrate that the TX-TL system can be used to prototype relatively complicated synthetic biocircuits, such as the PBI circuit that involves not only transcriptions, translations, and protein- DNA interactions but also post-translated interactions like phosphorylation and dephosphorylation; 2) we show that by utilizing the TX-TL system that has extra degrees of freedom compared to cell-based systems, we can systematically identify the parameters of our mathematical models using actual experimental data, which subsequently guide us to achieve more efficient circuit prototyping and better future circuit designs [49, 50].
2.2 Demonstration of Retroactivity in TX-TL
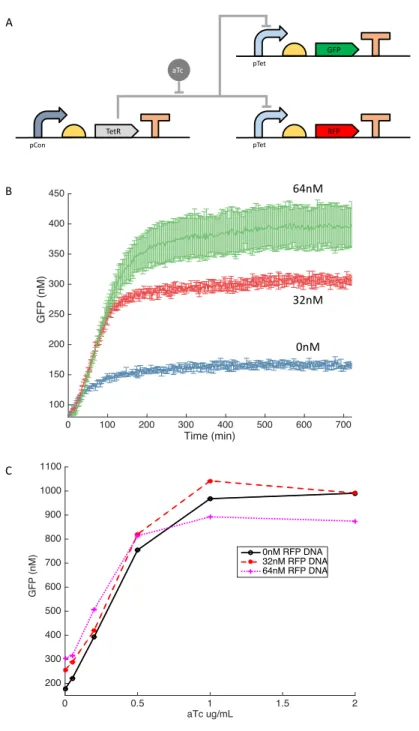
Firstly, we wanted to demonstrate retroactivity in the TX-TL system. The example we used is a simple negative regulation circuit, in which constitutively expressed TetR proteins repress the transcription of downstream components pTet-GFP and pTet-RFP DNA unless an inducer aTc is added (Figure 1A). Here, we considered pTet-GFP as the reporter and pTet-RFP as the load. When there is no inducer present, the reporter will remain off because of the repression by TetR. However, if we added a significant amount of load into the system, the load sequesters the TetR proteins from pTet-GFP, resulting in the activation of GFP transcription (Figure 1B). This is a result of retroactivity, in which downstream components affect the behavior of the upstream system output. We next tested this effect in the presence of different inducer concentrations (Figure 1C). At low aTc concentrations (less than 0.5 µg/mL), as load concentration increased, GFP expression increased because of retroactivity.
Figure 1 Demonstration of the retroactivity in the TX-TL system. A: Circuit diagram of a negative regulation circuit. B: Time traces of the GFP fluorescence in presence of different concentrations of RFP DNA. As RFP DNA concentrations increase, more GFP fluorescence can be detected as a result of the retroactivity. Error bars are standard deviations from 3 repeats.
C: Titration of TetR repressor aTc in presence of different concentrations of RFP DNA. X axis is the final concentrations of aTc in each sample and Y axis is the end point GFP fluorescence of the corresponding samples. Data were collected using a plate reader with settings for excitation/emission: 485 nm/525 nm.
0 0.5 1 1.5 2
aTc ug/mL 200
300 400 500 600 700 800 900 1000 1100
deGFP (nM)
0nM RFP DNA 32nM RFP DNA 64nM RFP DNA
0 100 200 300 400 500 600 700
Time (min) 100
150 200 250 300 350 400 450
deGFP (nM)
TetR pCon
GFP pTet
RFP pTet
aTc
A
B
C
64nM
32nM 0nM
However, if too much aTc was added, GFP expression actually decreased as load increased. This is because resources in TX-TL, such as ribosomes and RNA polymerase, are limited.
This simple circuit demonstrates that there is retroactivity in biological circuits in the TX-TL system. To address this problem, we implement an insulator component to compensate for the retroactivity.
2.3 Demonstration of the Insulation Capability of the PBI Circuit
Based on the insulator design in [45], we adapted a simpler form to implement an insulator in the TX-TL system (Figure 2A). The insulator design is based on a well- known two-component signal transduction system regulating the transcription of genes encoding metabolic enzymes and permeases in response to carbon and nitrogen status in E. coli and related bacteria [51]. There are two essential proteins in the system: NRII and NRI (NtrB-NtrC). NRI can be phosphorylated into NRIP by NRII (kinase form). Only NRIP is able to activate the s54-dependent promoter glnA and trigger the transcription of downstream genes [52]. NRII is both a kinase and phosphatase, regulated by the PII signal transduction protein, which, on binding to NRII, inhibits the kinase activity of NRII and activates the NRII phosphatase activity [53]. NRII is known to form dimers and will autophosphorylate itself to become a kinase. Previous studies suggested that when NRII has a mutation of leucine to arginine at residue 16, it loses its phosphatase activity but shows normal autophosphorylation. In contrast, NRII with a H139N mutation is not able to transfer
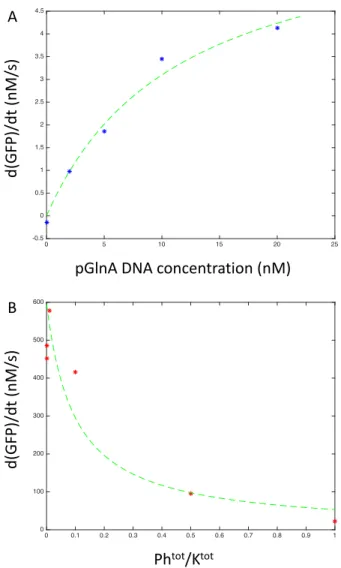
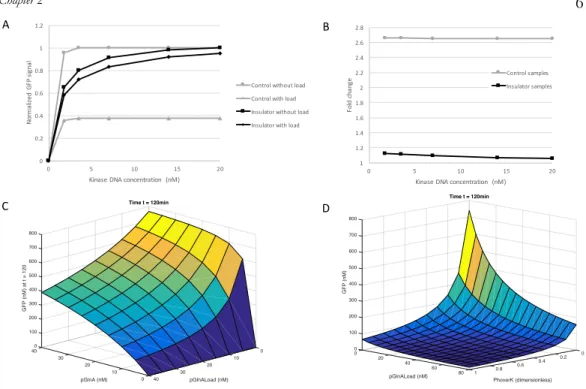
Figure 2 Implementation of the PBI circuit in the TX-TL system. A: Circuit diagram of the PBI circuit. pCon is a constitutive promoter. B: Transfer function curves for controls and insulators with or without load DNA. Raw GFP fluorescences were normalized using the highest GFP fluorescences from controls and insulators, respectively (highest GFP = 1). Compared to the control with load, which only had 40% signal left, the insulator with load was able to preserve 80% of the signal, significantly attenuating the retroactivity. C: Fold changes of the samples without load over the ones with load. The insulator samples have significantly smaller fold changes compared to those of the control samples.
0 0.2 0.4 0.6 0.8 1 1.2
0 5 10 15 20
Normalized GFP signal
Kinase DNA concentration (nM)
Control without load Control with load Insulator without load Insulator with load
A
C B
NRII$L16R$
pCon
NRI pCon
NRII$H139N$
pCon
Kinase
Substrate
Phosphatase
NRIP
GFP pGlnA
RFP pGlnA
1 1.5 2 2.5 3 3.5
0 5 10 15 20
Fold change
Kinase DNA concentration (nM)
Control samples Insulator samples