JANUARY 2006 ISSN 1522-0613 n
' E B
MICHAELL.
ROSENZWEIG-
EDITOR-IN-CHIEFVOLUME
8NUMBER
1Published by EVOLUTIONARY ECOLOGY LTD.
www.evolutionary-eco1o~.com
C C C C
OVE RClockw ise from the top:
Myrmotherula axillaris, Percnostola rufifrons Thamnomanes ardesiacus, Hylophylax poecilinota
pp 268, 262, 248, & 252 from The Birds of Surinam
by F. Haverschmidt Illustrations by Paul Barruel
Reprinted by permission of
Netherlands Foundation for the Advancement of Tropical Research ( WOTRO)
© 1968 WOTRO http://www.nwo.nl/wotro
Local extinctions in flocking birds in Amazonian forest fragments
Kyle S. Van Houtan,
1Stuart L. Pimm,
1* Richard O. Bierregaard Jr.,
2,3Thomas E. Lovejoy
2,4and Philip C. Stouffer
2,51Nicholas School of the Environment and Earth Sciences, Duke University, Durham, NC, USA,
2Biological Dynamics of Forest Fragments Project, National Institute for Amazonian Research, Manaus, Brazil, 3Department of Biology, University of North Carolina, Charlotte, NC, USA,
4The H. John Heinz III Center for Science Economics and the Environment, Washington, DC, USA and 5School of Renewable Natural Resources,
Louisiana State University, Baton Rouge, LA, USA
ABSTRACT
Questions: Does the tendency to join flocks predispose a bird species to local or global extinction? Does the ability to revise particular social preferences in fragmented landscapes confer greater persistence? Do solitary species of birds persist longer in small forest patches?
Background: Social carnivores range more widely than solitary carnivores and are more prone to local extinction in fragmented landscapes. Flocking bird species typically range over larger areas than solitary ones, thus potentially encountering threats in and beyond the edges of their habitat more often than solitary species.
Data: A 14-year bird-capture database from the Biological Dynamics of Forest Fragments Project (BDFFP) near Manaus, Brazil.
Methods: From the literature, from independent field observations and mist-net captures we identified 30 species that join mixed flocks or follow ant swarms. We quantify the tendency for these species to flock both before and after habitat fragmentation. We test the effect of flocking on understory species’ persistence in forest fragments of 1, 10 and 100 ha.
Results: Species that typically forage in flocks before plot isolation persist for shorter times than those that infrequently join flocks. Species that drop out of flocks after fragmentation persist longer than those that remain in flocks. Our model outperformed a nested analysis of variance that treated each species as a variable, inherently testing for life-history idiosyncrasies and phylogeny. Recapture rates, calculated using MARK, did not explain the residual variation from our model. Flocking behaviour, and its plasticity, influence species persistence and so are important criteria in understanding local extinction.
Keywords: BDFFP, correlates of extinction, flocking propensity, fragmentation, understory flocks.
* Address all correspondence to Stuart L. Pimm, Nicholas School of the Environment and Earth Sciences, Box 90328, Duke University, Durham, NC 27708, USA. e-mail: [email protected]
Consult the copyright statement on the inside front cover for non-commercial copying policies.
Evolutionary Ecology Research, 2006, 8: 129–148
© 2006 Stuart L. Pimm
INTRODUCTION
The risk of extinction varies widely among species (Diamond, 1984; Pimm et al., 1995). At large spatial scales, the size of the species’ geographical range and the species’ local abundance are major factors in determining whether a species survives human impacts
(Manne et al., 1999; Manne and Pimm, 2001). At smaller scales, differences in local extinction among species can unfold as a naturally occurring phenomenon, such as on birds on small islands
(Pimm et al., 1988). These differences are especially striking, however, in the newly fragmented landscapes (Diamond et al., 1987; Rozenzweig, 1995) that now cover large areas of the planet (Jenkins and Pimm, 2003). Several factors explain why certain species are less susceptible to local extinction than are others. Again, local abundance is one of them (Pimm et al., 1988; Pimm 1991;
Rozenzweig, 1995).
Gosling and Sutherland (2000) asked what the effects of ‘behaviour’ are, broadly defined.
Their synthesis was rich in ideas, but contained few empirical studies. In one of them, Woodroffe and Ginsberg (1998, 2000) demonstrated the importance of how wide-ranging an individual is. Other things being equal, large-bodied species range more widely and have lower local abundances than smaller species. Importantly, how far an individual ranges also depends on that species’ behaviour, here defined narrowly as its sociality. For a given body size, social carnivores had substantially larger ranges as individuals (because their social groups ranged widely) than individuals of solitary carnivore species. Consequently, individuals of wide-ranging species had greater contact with edges and other unsuitable habitat. Such contacts increased conflicts with humans and human-modified landscapes, increasing mortality, and so the chance of local extinction.
We explore this idea in a different context. Birds of the forest understory that are more likely to move to, or beyond, the edges of their newly fragmented habitat should disappear from forest fragments more quickly. Typically, species that join interspecific flocks range more widely than do solitary species (Stouffer and Bierregaard, 1995). The latter should persist longer than the former after forest fragments become isolated. We also predict that flocking species demonstrating a flexibility to forage outside of flocks after forest isolation will persist longer than those that remain in flocks. (We distinguish flocking as a measure of sociality from mechanisms involving the vulnerabilities of colonial species. For example, the Passenger Pigeon, Ectopistes migratorius, notoriously required vast nesting colonies to persist.)
Insectivorous forest birds often disappear from forest patches quickly after their isolation
(Willis, 1974, 1979; Karr, 1982; Thiollay, 1992; Stouffer and Bierregaard, 1995; Canaday, 1997). There are several explanatory hypotheses, but the underlying mechanisms remain uncertain (S¸ekerciog˙lu et
al., 2002). Among insectivores, many that join mixed-species flocks or follow army ant
swarms are highly sensitive to forest fragmentation (Willis, 1974; Leck, 1979; Lovejoy et al., 1986; Stouffer and Bierregaard, 1995), though there are exceptions (Willis, 1974; Karr, 1982; Stouffer and Bierregaard, 1995). These two foraging strategies are distinct and specialized. [For army ants, see Oniki and Willis (1972), Willis and Oniki (1978), Harper (1987); for mixed-species flocks, see Powell (1979), Munn (1985), Stotz (1993), Jullien and Thiollay (1998).] Here we consider them collectively because of their general susceptibility to local extinction in fragments.
We show that species that join flocks do so to different degrees and we quantify the differences using data from captures in mist-nets. Extensive experience suggests that the regular checks of mist-nets in humid, tropical forests generally go unrewarded.
Occasionally, a check reveals many individuals. They are typically of species known to Van Houtan et al.
130
forage in flocks or follow ant swarms. This experience of contagious captures may be familiar, but does it generate the quantitatively useful information needed to predict the persistence of species in forest fragments? It does so in several important ways.
First, if we assume that captures are not contagious, but random, the frequency of capturing 0, 1, 2, . . . , n individuals should follow a Poisson distribution. We can estimate the single parameter of that distribution from frequencies of captures of 1 and 2 individuals.
(We lack the records of how many net checks returned empty-handed, and show that this is not a problem.) There is an excess of captures involving three or more individuals, compared with the assumption of independent capture. In other words, the simultaneous capture of three or more individuals is unexpected, suggesting the birds are travelling together – most likely in a flock. This is exactly the criterion employed by other observational studies of species’ flocks (see below).
Second, we show that species that flock according to this criterion are overwhelmingly those determined to flock by observational studies. The exceptions are easily understood and we eliminate them. Third, we show that our numerical measure of propensity to flock – the fraction of individuals captured in flocks over the total number of individuals captured – closely correlates with the comparable measure from independent field observations. (We can do this for most but not all the species in this study.) Fourth, we show that the species that withdraw the most from flocks after fragmentation are those known to be facultative in their flocking behaviour. Finally, our quantitative measure significantly predicts two features of how long species persist in isolated forest fragments:
1. We demonstrate that, after forest fragmentation, the more often a species was present in a flock, the more quickly it was lost from a given fragment.
2. Species depend on flocking to varying degrees. Those that rely on flocking strategies in continuous forests – and retain that preference in forest fragments – persist for shorter times than those that tend not to flock in fragmented habitats.
METHODS Study site
The forest bird populations of the Biological Dynamics of Forest Fragments Project (BDFFP) in the central Amazon present an unrivalled context to measure differences in vulnerability to local extinction. This ecosystem has been studied for 25 years through extensive mist-net surveys conducted both in continuous and fragmented forests (Lovejoy et al., 1986; Bierregaard et al., 2001; Laurance et al., 2001). We analysed 36,657 mist-net captures from both continuous and fragmented forests at Fazendas Dimona, Esteio, and Porto Alegre at the BDFFP, approximately 80 km north of Manaus, Brazil. Mist-nets caught birds in 27 forest plots of 1, 10, 100 and 1000 ha from 1979 through 1993. Eleven plots were isolated from the surrounding continuous forest after sampling began (five 1 ha, four 10 ha and two 100 ha plots). The remaining 20 study areas were never isolated (nine 1 ha, six 10 ha, three 100 ha and two 1000 ha plots). Lovejoy et al. (1986) and Bierregaard and Stouffer (1997) provide further experimental details.
Local extinction in flocking birds 131
Flocks and flocking behaviour
To characterize different species’ social tendencies, we examined the literature and mist-net captures. We employ mutually reinforcing measures to define flocking species, flocks and flocking tendencies.
Relying on field experience, we referenced the authoritative monograph of central Amazonian birds (Cohn-Haft et al., 1997). We include a species in our study only if Cohn-Haft et al. considered it to join mixed-species flocks or follow ant swarms to any extent (see Table 1 for descriptions).
Having identified flocking species, we then quantified their tendencies to flock. Thiollay
(1999) defined a mixed flock as three or more birds of two or more species observed within 10 m of each other. Others’ definitions are quite similar (Stotz, 1993; Jullien and Thiollay, 1998; Develey and Stouffer, 2001). We checked nets every 30 min and considered groups of three or more birds of two or more species captured during the same check, within two mist-nets’ proximity (< 36 m), as tentatively being a ‘flock’. We characterized army ant flocks similarly, except we allowed for monospecific groups, as is characteristic of these flocks (Willis and Oniki, 1978; Harper, 1987). This allowed us to calculate the empirical frequencies for capturing single birds, pairs, triplets, and so forth, for both mixed-species and ant-following flocks.
We then addressed whether it is appropriate to consider three or more netted birds to constitute a flock. The number ‘three’ is an arbitrary minimum flock size, except that it encapsulates the considerable field experience of tropical mixed flocks (see above). If there were no flocks, individual birds would enter nets independently of one another and the frequency of group captures would follow a Poisson distribution. We do not have the full statistical distribution, as we did not record the number of empty nets. Nonetheless, we can estimate λ, the parameter of a Poisson distribution, from the ratio of the frequencies of captures of one (e−λ·λ) and two (e−λ·λ2· ½) individuals. This parameter estimate allows the prediction of the full distribution of net captures under the Poisson assumption of independent captures. Using the data from continuous forest plots, our results confirm that group captures of three or more birds occurred more often than predicted. Corroborating previous flock definitions, we deem such captures to be flocks.
Once we defined flocks, we quantified the frequency of species joining flocks. Jullien and Thiollay (1998) and Jullien and Clobert (2000) defined a species’ flocking ‘propensity’ as the proportion of individuals observed foraging in flocks to the total observations. Similarly, we created a flocking index for each species from the frequency of in-flock captures divided by total captures for that species. This index was initially derived in continuous forest conditions (using data from all 27 plots) for all species with more than 25 total captures.
Figure 1 correlates our measure of flocking behaviour to the flocking propensities of Jullien and Thiollay (1998) for species common to the two sites. Jullien and Thiollay did not consider ant followers.
We considered several factors that could potentially invalidate applying mist-net data to these ends. The possibility exists that distress calls from netted birds could attract other birds into nets, thereby confounding our estimate of flocking behaviour. From our experience, this only occurred in one species, the Musician’s Wren, Cyphorhinus aradus, which is not a flocking species (Cohn-Haft et al., 1997).
We also considered the effect of varying recapture rates between species (LeBreton et al., 1992). Species are active at different heights and in different ways, affecting how often mist-nets detect them (Remsen and Parker, 1983; Remsen and Good, 1996). Recapture rate cancels out in our
Van Houtan et al.
132
flocking index (in-flock captures divided by total captures). We do evaluate the effects of different recapture rates, when estimating how long species persist.
Persistence and behaviour in fragments
Post-fragmentation captures document each species’ survival in fragments. We defined
‘persistence’ as the length of time that a species was recorded after the fragment’s isol- ation. Low values indicate rapid local extinction. We averaged persistence values across similar-sized fragments (five 1 ha, four 10 ha, one 100 ha) to gather a single measure for each species in each fragment size. If a species was not present in a fragment before isolation, we could not calculate its persistence. If a species was detected before but never after isolation, we gave it a value of ‘0’. We used data from only one 100 ha fragment, Porto Alegre #3304, as the second 100 ha fragment, Dimona #2303, was isolated too late in the study to provide comparable measures of persistence. The 1000 ha plot, Gavião #1401, was never isolated.
Occasionally, the barriers isolating the fragments were poorly maintained (the cattle ranches were abandoned) enabling some species to re-colonize fragments through corridors of Cecropia sp. and Vismia sp. regrowth (Bierregaard and Stouffer, 1997; Stratford and Stouffer, 1999). Concordantly, we assume absences of greater than 4 years in the capture record to be local extinctions followed by re-colonizations, as opposed to continual persistence.
We compared flocking indices for each species before and after plot isolation. Using the previous method, we recorded additional flocks after the plots were fragmented, calculating an additional measure of flocking propensity from captures in the 11 plots that were isolated. We did not characterize flocks in the first 3 months after fragmentation to avoid the ‘crowding effect’ Lovejoy et al. (1986) observed. We tested the statistical independence of these different values and derived their difference by subtracting the flocking index after fragmentation from the one before. This value served as a measure of change in flocking between continuous and isolated plot conditions.
Statistical analyses
To test the effect of flocking behaviour on persistence, we used an analysis of covariance (ANCOVA) model with pre-fragmentation capture frequency, pre-fragmentation flocking index and change in flocking (after fragmentation) as continuous variables and fragment size as a discrete variable. We developed the model sequentially to represent the individual effects of the separate behavioural factors graphically.
Captures from all continuous forest plots were used to gauge species’ rarity. While capture frequencies alone are biased measures of actual species abundance (Williams et al., 2002)
to the extent that they do measure relative abundance, we retain them as a statistical correction. Rare species are likely to be lost before common ones (Pimm et al., 1988; Pimm, 1991). Moreover, species with low population densities might appear to ‘disappear’ more often from fragments simply as an artifact of being hard to detect.
Additionally, we calculated the recapture rate, p(t), for each species using the program MARK (White and Burnham, 1999). We used 8 years of captures in adjacent, similarly sampled, continuous forest plots (Florestal, Gavião and km 34). As individuals moved between these three areas, we pooled the data to attain accurate individual capture series. The best estimate of p(t) in MARK allowed it to vary annually, according to netting effort. We
Local extinction in flocking birds 133
Table 1.Behaviour and persistence of 30 understory social species before and after plot isolation Pre-fragmentationPost-fragmentationPersistence (days) RecaptureFlocking SpeciesSocialityrateCapturesIndexCapturesIndexchange1 ha10 ha100 ha TYRANNIDAE Rhynchocyclus olivaceusu730.32640.190.1385111923063 Terenotriccus erythrurussu0.09680.12580.090.0349015353409 Myiobius barbatusu0.204330.142370.140.0023911493410 Onychorhynchus coronatussu0.271090.17280.18−0.01—4622989 THAMNOPHILIDAE Thamnophilus murinussu0.11790.11590.12−0.0114279793350 Thamnomanes ardesiacusu0.389730.343760.240.1041316383408 Thamnomanes caesiusu0.076370.322320.270.0532919153350 Myrmotherula guttatasu0.492820.21550.22−0.011166753087 Myrmotherula gutturalisu0.335540.341730.290.0538118883408 Myrmotherula axillarisus0.192480.281930.220.06119723643347 Myrmotherula longipennisu0.354800.312280.310.0037711503409 Myrmotherula menetriesiiu *0.132250.251080.230.0249312023408 Percnostola rufifronssa *0.475150.173440.130.04341918893409 Pithys albifronsa0.3527910.274080.30−0.031621423410 Gymnopithys rufigulaa0.3015380.312630.33−0.021808923408 Hylophylax poecilinotasa0.4420100.187110.140.0475335523410
FURNARIIDAE Philydor erythrocercusu *0.041160.31380.290.02845093148 Automolus infuscatusu *0.464990.341200.330.0132710563281 Automolus ochrolaemussu0.05630.32260.310.010121527 Xenops minutusu0.282360.28680.31−0.031556623198 Dendrocincla fuliginosasua *0.121550.201140.180.0241630043408 Dendrocincla merulaa0.226600.26570.28−0.02752263150 Deconychura longicaudauc *0.11870.24400.28−0.04563743409 Deconychura stictolaemau0.345700.241910.200.04803363409 Glyphorynchus spirurusus0.3812340.145860.080.06349235523410 Hylexetastes perrotiisa *0.05770.35520.290.06485221946 Dendrocolaptes certhiaas *0.07370.16430.070.0918641591374 Xiphorhynchus pardalotusu *0.165450.374670.180.19160433333281 VIREONIDAE Hylophilus ochraceicepsu0.294330.40920.340.06947603350 CERTHIIDAE Microbates collarissu *0.635230.232080.170.064085963196 Note: Sociality (in order of prevalence) from Cohn-Haft et al. (1997). u=in understory mixed flocks, s=solitary or in pairs, a=army ant follower, c=in canopy mixed flocks. *Described differently in Ridgely and Tudor (1989, 1994). Recapture rate: reconstituted from p(t) parameter in MARK; blank indicates inestimable parameter. Pre- and Post-fragmentation: Captures=total captures during period, Index=proportion of in-flock captures to total captures. Flocking change: decrease in flocking behaviour after plot isolation; negative values indicate increases. Persistence: duration species detected in plots after isolation, averaged among similar sized plots (five 1 ha, four 10 ha, one 100 ha). 0=detected before but not after isolation, —=never detected.
reconstituted values for p(t) for each species, based on an annual effort of 10,000 net hours, to determine if these explained the residuals from the full model.
We averaged persistence values in the model within each fragment size treatment, thereby eliminating any differences between individual fragments of the same size. By inspection, we noticed that persistence times within a species, within a given fragment size, were quite similar. To formalize this assumption, we compared our initial covariance model (where persistence is pooled by fragment size) to a similar model that treated each fragment as a class variable. The alternative model posits that how long a species persists depends on the particular fragment in which it is found – that is, not the fragment’s size, but its identity.
These differences could arise if, for example, fragments in close proximity to continuous forest held species longer than more spatially isolated fragments. The original model assumes that, among the possible patch metrics, area exerts the dominant effect on species persistence.
Additionally, we checked if flocking behaviour affects persistence to varying extents in fragments of different sizes. We ran a more complex covariance model (using the factors capture frequency, fragment size and flocking index) adding the crossed effect of flocking index and fragment size. This effectively tested for significant differences in the extent to which flocking behaviour affects persistence (or differences in the slopes) in the three fragment size classes.
Finally, we checked whether there are phylogenetic differences in persistence over and above the effects of capture frequency, fragment size and flocking behaviour. We performed a two-way analysis of variance (ANOVA) using fragment size and each species as class variables. The resulting residual sum of squares is a pure error term (within species, within fragment) and its reduction over the model with species (represented by capture frequency, flocking index and change in flocking index) serves as an F-test for lack of fit for that model.
While the ANOVA inherently tests for significant phylogenetic differences, we plot the residuals from the full ANCOVA model according to phylogeny to check for any potential confounding factors. There are multiple factors we exclude that might correlate with extinction risk, though perhaps not directly (clutch size or nest type are examples). These variables tend to correlate with body size, which was not a significant predictor of species persistence when fragment size is considered (ANCOVA, degrees of freedom=1,85, P=0.06).
We tested all the models using the general linear models procedure (PROC GLM) in SAS release 9.1 (SAS Institute, 2003).
RESULTS
What constitutes a flock and which species flock?
From the observed frequency of captures of one and two individuals in continuous plots, we fit the expected distribution of pre-fragmentation captures of 0, 3, 4, . . . , n (Fig. 1). The observed frequency of birds caught in groups of three or more is greater than expected by the fitted distribution. This result confirms field experience that three or more birds compose a flock. There were no captures of exactly 15, 18 or 21 birds, nor any captures with 23 or more.
We identified 30 flocking species in 1352 flocks from 26,074 net captures before frag- mentation. Table 1 organizes these species based on the phylogeny of Sibley and Monroe
Van Houtan et al.
136
(1990). Flocking species represent: Tyrannidae (4), Thamnophilidae (12), Furnariidae (12), Vireonidae (1) and Certhiidae (1).
We exclude four species considered to join understory flocks by the literature – Yellow-throated Woodpecker (Piculus flavigula), Olivaceous Woodcreeper (Sittasomus griseicapillus), Black-banded Woodcreeper (Dendrocolaptes picumnus) and Curve-billed Scythebill (Campylorhamphus procurvoides) – as we caught them too few times (see Methods). We exclude some species from the analyses that we detected in groups of three or more because they are not listed as joining understory mixed flocks or following ants by Cohn-Haft et al. (1997). By chance alone, there should be such species and most can be explained from the species being drawn to fruiting trees, occurring in family groups and similar miscellaneous reasons.
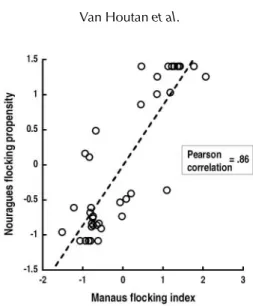
Calibrating our measure of flocking with other studies
Figure 2 plots flocking index values for each species (based on net captures) against an independent measure of flocking behaviour based on field observations by Jullien and Thiollay (1998) in French Guiana. Values from both studies are closely correlated (Pearson correlation=0.86).
Behaviour and persistence
Table 2 lists the results of the full model. There were five major results: (1) The effect of capture frequency (‘captures’) is numerically small, but statistically significant. (2) Species detected more often in flocks, both before and after fragmentation, disappear from frag- ments more quickly than those that are not. (3) Larger fragments hold birds significantly longer than do smaller fragments. (4) Species that withdraw flocks after fragmentation Fig. 1. The frequency of birds caught in groups of three or more is greater than expected by chance alone. Open circles are the observed probabilities of birds netted in different-sized groups. From the numbers of captures of 1 and 2 individuals, we deduce the parameters of a Poisson distribution and so predict the expected probabilities of captures of 0, 1, . . . , n captures (shown in grey ×’s). Capture probabilities are log-transformed.
Local extinction in flocking birds 137
(‘change in flocking index’) persist longer than those that do not. (5) The lack of fit test – factoring fragment size, considering each species a variable – was not significant (P=0.17).
Results 1–3
Figure 3 shows the effect of flocking index on persistence. Persistence times are corrected for capture frequency and fragment size. Although there is significant variation, the trend indicates that species predisposed to flock with frequency disappear from fragments faster.
Fig. 2. Flocking tendency measured from mist-net data correlates well with an observer-based method by Jullien and Thiollay (1998). Comparisons are between similar forests in Manaus, Brazil and Nouragues, French Guiana, and are restricted to species in common to both locations. Values shown are standardized.
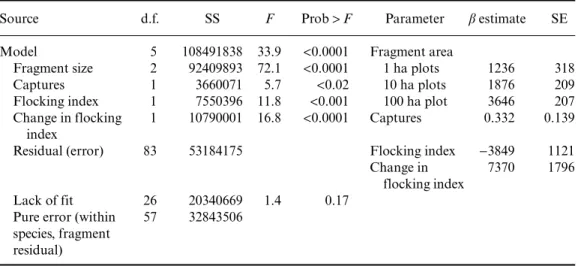
Table 2. Statistical summary of the full persistence model
Source d.f. SS F Prob>F Parameter β estimate SE
Model 5 108491838 33.9 <0.0001 Fragment area
Fragment size 2 92409893 72.1 <0.0001 1 ha plots 1236 318
Captures 1 3660071 5.7 <0.02 10 ha plots 1876 209
Flocking index 1 7550396 11.8 <0.001 100 ha plot 3646 207
Change in flocking index
1 10790001 16.8 <0.0001 Captures 0.332 0.139
Residual (error) 83 53184175 Flocking index −3849 1121
Change in flocking index
7370 1796
Lack of fit 26 20340669 1.4 0.17
Pure error (within species, fragment residual)
57 32843506
Note: Capture frequency, fragment size, flocking behaviour in continuous forest, and flock ‘drop-out’ after forest fragmentation all factor significantly in species persistence. This model outcompeted a model including fragment size and considering each species as a unique variable; serving as a lack of fit test. Model R2=0.67.
Van Houtan et al.
138
Here, the crossed interaction of flocking behaviour and fragment size is not significant (F2,81=1.5, P=0.22). Thus, the slopes of the three trend lines between plots of different size are not significantly different. (We do not retain this factor in the model.)
Result 4
From the 10,583 captures after isolation, we derive an independent measure of flocking behaviour from an additional 444 flocks. Figure 4 plots flocking indexes before and after Fig. 3. The more likely a species is found in a flock before fragmentation, the shorter the period of time it persists afterwards. Residual values are extracted from a model using capture frequency and fragment size to predict persistence. Data from five 1 ha, four 10 ha and one 100 ha plot are shown.
Black circles are species joining mixed flocks; grey circles represent ant followers (this colour coding is retained throughout). Trend line represents both guilds.
Local extinction in flocking birds 139
fragmentation for each species. Generally, birds join flocks less after fragmentation than before, as reflected in the observation that most of the points fall below the 1:1 line (paired t-test: t30=3.5, P<0.002). This confirms three species known to ‘drop out’ of flocks (Stouffer and Bierregaard, 1995) – the White-flanked Antwren (Myrmotherula axillaris), Wedge-billed Woodcreeper (Glyphorhynchus spirurus) and Chestnut-rumped Woodcreeper (Xiphorhyn- chus pardalotus). We identify two additional species that withdraw from flocks – the Barred Woodcreeper (Dendrocolaptes certhia) and Olivaceous Flatbill (Rhynchocyclus olivaceus).
In contrast, several species flocked with slightly greater frequency after fragmentation (Table 1). Two notable examples are the White-plumed Antbird (Pithys albifrons) and Long-tailed Woodcreeper (Deconychura longicauda).
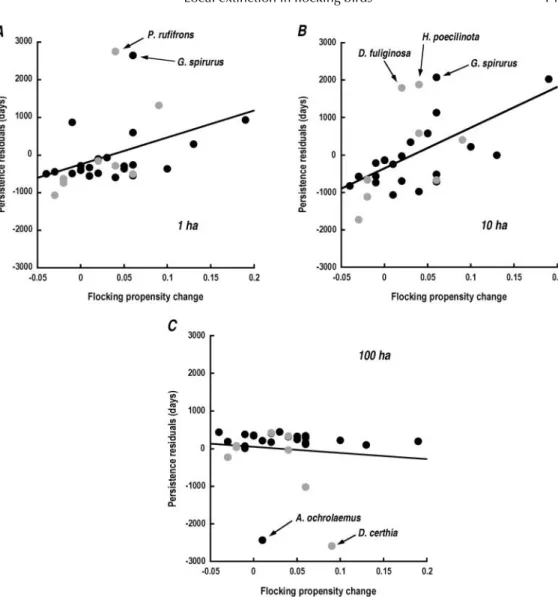
A species’ ability to decrease its dependence on flocking, in isolated plots, affects its persistence in fragments (Fig. 5). Other things being equal, the species that persist longer are those that flock less after fragmentation than before. We illustrate this by plotting the residuals from the previous model against the change in flocking propensity.
Results of tests for confounding effects
Including differences in persistence within fragments of the same size was not an improvement upon our model. The F-test for lack of fit between these two models was not significant (F7,281=1.5, P>0.15). This confirms our assumption that we can pool the data based on fragment size.
Concerns about phylogenetic effects raise the issue of whether a model that considers species as discrete entities would be an improvement. It is not. The F-test between these two models is not significant (Table 2), indicating that a species-specific model does not perform better than one that characterizes species by the three ecological factors we consider (captures, flocking index, change in flocking index). Of course, there might be more complex phylogenetic effects between species. For example, species within families may be more similar in their persistence times than those between families. Or, there could be differences between the two flocking guilds that are confounded by phylogenetic effects.
Fig. 4. Species are generally detected more frequently in flocks before fragmentation (paired t-test:
t30=3.5, P<0.002). Dashed line is the line of equality. Labelled species are discussed in the text.
Van Houtan et al.
140
We show the residuals from the model for each species in Fig. 6, coding species by family and social strategy (ant followers or not). Each species has three data points, one for each of the three fragment sizes. The Royal Flycatcher (Onychorhynchus coronatus) was not caught in the 1 ha plots. By chance alone, some species should appear to persist longer and others shorter than the model predicts. For example, the Olive-backed Foliage gleaner (Automolus infuscatus) consistently persists longer than expected and the Buff-throated Foliage gleaner (A. ochrolaemus) consistently persists shorter than expected (Fig. 6). There are no phylo- genetic trends (Fig. 6). Indeed, the previous example is of two congeners. Moreover, there is no consistent difference based on foraging strategy.
Fig. 5. The more a species decreases its occurrence in flocks as a result of fragmentation, the longer it persists after fragmentation. Residual values are extracted from a persistence model using capture frequency, fragment size and pre-fragmentation flocking behaviour as factors. Labelled outliers are detailed in the Discussion.
Local extinction in flocking birds 141
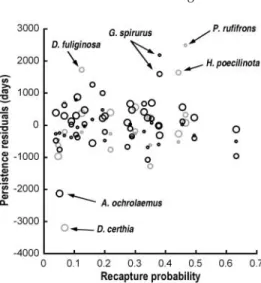
Recapture rate could also potentially explain differences in the model. Species that are
‘difficult’ to recapture may not appear to persist in fragments, when in fact they simply avoid nets. Figure 7 plots recapture rate against the residuals from the model. No consistent pattern emerges. Contrary to expectation, the species with the greatest capture probability – the Collared Gnatwren (Microbates collaris) – falls below the model in all three fragment sizes (Fig. 6).
Outliers
To the extent that the model does not fit the data well, two species, G. spirurus and the Black-headed Antbird (Percnostola rufifrons), consistently persist longer than the model predicts (Figs. 5a and 6). In addition to using mature forest, both of these species tolerate forest edges and gaps, as well as secondary forest. There are too few species with such broad habitat requirements to test whether this is a general effect, however. While most of the species persisted in the 100 ha fragment, two species – D. certhia and A. ochrolaemus – appeared to vanish after less than 2 years (Table 1). Both of these species have low capture probabilities (Fig. 7), but that factor does not otherwise predict a species’ persistence (Fig 5c). The Scale-backed Antbird (Hylophylax poecilinota) persists longer than expected in the 10 ha plots (Fig. 5b). This species is unique in that it follows ant swarms, but also maintains small individual territories.
Fig. 6. No clear taxonomic trends explain differences in the model; nor does foraging strategy. Circles increase in size according to fragment area, with small circles representing data from 1 ha plots.
A=Tyrannidae: (1) Rhynchocyclus olivaceus, (2) Terenotriccus erythrurus, (3) Myiobius barbatus, (4) Onychorhynchus coronatus. B=Thamnophilidae: (1) Thamnophilus murinus, (2) Thamnomanes ardesiacus, (3) T. caesius, (4) Myrmotherula guttata, (5) M. gutturalis, (6) M. axillaris, (7) M. longipennis, (8) M. menetriesii, (9) Percnostola rufifrons, (10) Pithys albifrons, (11) Gymno- pithys rufigula, (12) Hylophylax poecilinota. C=Furnariidae: (1) Philydor erythrocercus, (2) Automolus infuscatus, (3) A. ochrolaemus, (4) Xenops minutus, (5) Dendrocincla fuliginosa, (6) D. merula, (7) Deconychura longicauda, (8) D. stictolaema, (9) Glyphorhynchus spirurus, (10) Hylexetastis perrotii, (11) Dendrocolaptes certhia, (12) Xiphorhynchus pardalotus. D=Vireonidae: (1) Hylophilus ochraceiceps. E=Certhiidae: (1) Microbates collaris.
Van Houtan et al.
142
DISCUSSION
While it is clear that flocking species are susceptible to habitat loss (Willis, 1974; Bierregaard and Lovejoy, 1989; Thiollay, 1992, 1999; Canaday, 1997), we show that the process has several subtleties. Those species more likely to be in flocks in continuous habitat persist for less time in isolated fragments (Fig. 3). Species withdrawing from flocks after isolation persist longer than do those that remain in flocks (Fig. 5). Differences in phylogeny (Fig. 6) or detection rates (Fig. 7) do not provide better explanations of the variation in the data. These findings add to the general notion that behaviour influences species’ survival in fragmented landscapes.
Quite how flocking should affect persistence is not self-evident. Persistence in an isolated fragment depends on extinction and immigration. Our postulated mechanism first assumes that flocking species require more area (and so perhaps leave the fragments sooner) than non-flocking species. More subtly, our mechanism assumes that flocking species do not return to the fragments more readily than non-flocking species. We consider each assumption in turn.
The literature suggests that understory insectivores that join flocks range more widely than those that do not. Birds that regularly join mixed-species flocks range over a flock territory of 8–15 ha (Stouffer and Bierregaard, 1995; Jullien and Thiollay, 1998; Develey and Stouffer, 2001). By comparison, citing Terborgh et al. (1990), Stouffer and Bierregaard (1995) argue that small insectivores occupy territories smaller (and sometimes much smaller) than 10 ha. Lacking complete data on all ant followers, we deduce they likely range beyond 100 ha (Harper, 1987), although not all such species range as widely (Wilson, 2003). Ant followers often require several army ant colonies, each occupying about 30 ha, to ensure that they have at least one swarming ant colony at any given time (Willis and Oniki, 1978; Lovejoy et al., 1986). Isolated small forest fragments do not provide enough habitat for such wide-ranging species. The more a species relies on flocking as a foraging strategy, the more we expect this pattern to be true.
Fig. 7. Differences in recapture probability do not explain the model residuals. Recapture rate was calculated in MARK, and allowed to vary annually, with netting effort. Rates shown are reconstituted based on an annual sampling rate of 10,000 net hours. Each species has three points (one for each fragment size). Circles increase in size based on fragment size. The model over-predicts fragment persistence for two species (Fig. 5c) that mist-nets do not detect frequently.
Local extinction in flocking birds 143
Regarding the second assumption, we can imagine scenarios where flocking species would be more prevalent in isolated habitats. By analogy to island biogeography, wide- ranging birds may occur in fragments solely because they are more vagile. Isolated forest
‘islands’ should contain vagile species at least some of the time, whereas sedentary species should never be present (Pimm et al., 1988). Additionally, wide-ranging birds encounter forest gaps more often than sedentary birds, perhaps encouraging a greater aptitude to cross them.
Such arguments are contrary to our findings.
Differences in species’ willingness to cross forest gaps are not well documented. What the literature does suggest is that all forest understory species are reluctant to cross forest gaps (Karr, 1982; Thiollay, 1992; Stouffer and Bierregaard, 1995; Gascon et al., 1999; S¸ekerciog˙lu et al., 2002;
Laurance et al., 2004). This pattern seems to hold even when the distance between forest patches is only 30 m (Develey and Stouffer, 2001). In contrast to these studies, Harper (1987) observed obligate ant-following species fleeing fragments into surrounding continuous forests, sometimes crossing clearings over 300 m. This suggests that some flocking species have the ability and inclination to leave unsuitable fragments to seek habitats elsewhere. Whether species disperse from fragments or whether they die in them is uncertain. However, because of the reluctance to cross gaps, flocking species should not immigrate to isolated fragments from surrounding forests. To survive, flocking species must either flee small fragments or revise their foraging behaviour.
Other explanations for our results require we consider the selective mechanisms under- lying flocking. Species likely select flocks in both tropical and temperate forests to avoid predators, increase their foraging efficiency, or both (Powell, 1985; Terborgh, 1990; Jullien and Clobert, 2000). Comparing forests across different continents, Thiollay (1999) found insectivores joined flocks more often when raptor abundance was higher. If predators were less frequent in the BDFFP fragments, then species that usually flocked to avoid predators would likely drop out of flocks, as most species seem to do (Fig. 4). As our nets sample raptors poorly, we make no comment on raptor abundance in fragments. Although this could potentially explain birds flocking less often in fragments, it would not explain why flocking species disappear from fragments.
Studies at the BDFFP demonstrate that the majority of invertebrate groups decrease inside fragments (Lovejoy et al., 1986; Didham, 1997; Didham et al., 1998). If birds join flocks in con- tinuous forests to increase their foraging efficiency, a reduction in forage would increase the selective benefits of flocking. As a result, we would expect flocking propensities to increase in fragments. We observed the opposite (Fig. 4). Other mechanisms besides foraging efficiency, then, must be at work. Exploring the factors contributing to joining flocks appears secondary to the reality that small forest fragments do not provide enough habitat for flocking species. Neither changes to resource availability nor risk of predation provide simple explanations for the results we obtain.
We instigated this study because of the overarching need to understand the factors that predict extinction. Such factors clearly vary across spatial scales and we are not surprised that what matters will be more complex and more idiosyncratic at smaller scales. One factor common to all scales is local abundance. For a given geographical range, locally rare species are more prone to be threatened globally than are locally common ones. Locally rare species are lost more quickly from small habitat patches (such as islands) than are locally common ones. The mechanism seems obvious: small numbers make a species particularly vulnerable to the vagaries of nature that cause all populations to fluctuate (Pimm, 1991). This is surely the explanation for why broadly similar species differ in their vulnerabilities.
Van Houtan et al.
144
We had also assumed it was the likely explanation for differences in species that differ on body size. Woodroffe and Ginsberg (1998, 2000) challenge that confidence. Species composed of widely ranging individuals essentially run out of space in the fragmented ecosystems than now dominate most of the planet. Other things being equal, larger-bodied species will roam more widely, have lower local densities and higher extinction risks. Importantly, behavioural differences also affect how widely a species ranges, independently of body size.
Thus, Woodroffe and Ginsberg not only provide a fundamental (and thus potentially general) explanation for differences in extinction risk, but an explanation that invokes behaviour. The role of behaviour was appreciated rather more than it was empirically demonstrated. Our aim was to determine if the proposed mechanism was a general one.
This ‘wider ranging species are at risk’ hypothesis immediately resonated with our experiences at Manaus. Our earliest experiences suggested that the first species to be lost from the isolated fragments were often those with certain behavioural traits – flocking and ant-following – rather than simply those that were locally rare (Lovejoy et al., 1986). Our present results confirm this.
Local abundance certainly plays a significant role in predicting which species are lost.
Differences in the number of captures suggest that the most commonly encountered species last less than 2 years longer in the smaller fragments than do the rarest species. (This estimate comes from multiplying the ranges of values, ∼100 to ∼2000 days in Table 1, with the parameter value, 0.332 in Table 2.) Differences in the flocking index are more important for species in the smaller fragments, however. Here species that flock the least last over 3 years longer than species that flock the most. Those species that withdraw from flocks after fragmentation offset the vulnerability of the species that remain in flocks.
These quantitative estimates show that, at least broadly, the behavioural differences between species are more important at this spatial scale than the ecological differences in abundance. Over the landscape, compared to large forest patches, small fragments will lose more species and lose them more quickly (Ferraz et al., 2003). As shown here, the species small fragments contain will be different not only in terms of a simple species list, but in the behavioural features of those species.
ACKNOWLEDGEMENTS
This work was graciously supported by the Biological Dynamics of Forest Fragments Project, the Instituto Nacional de Pesquisas da Amazônia, the US Department of Education, the Center for Latin American Studies at Duke University, and the University Program in Ecology at Duke University.
Mario Cohn-Haft, Gonçalo Ferraz, Lee Harper and George Powell provided helpful insights that helped shape this manuscript. Special consideration and thanks to Rita Mesquita, Natalie Hartman and Nancy Morgans for much needed logistical support. This is contribution #443 from the BDFFP technical series.
REFERENCES
Bierregaard, R.O. and Lovejoy, T.E. 1989. Effects of forest fragmentation on Amazonian understory bird communities. Acta Amazonica, 19: 215–241.
Bierregaard, R.O. and Stouffer, P.C. 1997. Understory birds and dynamic habitat mosaics in Amazonian rainforests. In Tropical Forest Remnants (W.F. Laurance and R.O. Bierregaard, eds.), pp. 138–155. Chicago, IL: University of Chicago Press.
Local extinction in flocking birds 145
Bierregaard, R.O., Lovejoy, T.E., Gascon, C. et al., eds. 2001. Lessons from Amazonia: The Ecology and Conservation of a Fragmented Forest. New Haven, CT: Yale University Press.
Canaday, C. 1997. Loss of insectivorous birds along a gradient of human impact in Amazonia.
Biol. Conserv., 77: 63–77.
Cohn-Haft, M., Whittaker, A. and Stouffer, P.C. 1997. A new look at the ‘species poor’ central Amazon: the avifauna north of Manaus, Brazil. Ornithol. Monogr., 48: 205–235.
Develey, P.F. and Stouffer, P.C. 2001. Roads affect movements of understory flocks in central Amazonian Brazil. Conserv. Biol., 15: 1416–1422.
Diamond, J.M. 1984. ‘Normal’ extinctions of isolated populations. In Extinctions (M.H. Nitecki, ed.), pp. 191–246. Chicago, IL: University of Chicago Press.
Diamond, J.M., Bishop, K.D. and Balen, S.V. 1987. Bird survival in an isolated Javan woodland:
island or mirror? Conserv. Biol., 1: 132–142.
Didham, R.K. 1997. The influence of edge effects and forest fragmentation on leaf litter invertebrates in Central Amazonia. In Tropical Forest Remnants (W.F. Laurance and R.O.
Bierregaard, eds.), pp. 55–70. Chicago, IL: University of Chicago Press.
Didham, R.K., Hammond, P.M., Lawton, J.H. et al. 1998. Beetle species responses to tropical forest fragmentation. Ecol. Monogr., 68: 295–323.
Ferraz, G., Russell, G.J., Stouffer, P.C., Bierregaard, R.O., Pimm, S.L. and Lovejoy, T.E. 2003.
Rates of species loss from Amazonian forest fragments. Proc. Natl. Acad. Sci. USA, 100:
14069–14073.
Gascon, C., Lovejoy, T.E., Bierregaard, R.O. et al. 1999. Matrix habitat and species richness in tropical forest remnants. Biol. Conserv., 91: 223–229.
Gosling, L.M. and Sutherland, W.J., eds. 2000. Behaviour and Conservation. Cambridge: Cambridge University Press.
Harper, L.H. 1987. Conservation of ant-following birds in central Amazonia forest fragments. PhD dissertation, State University of New York, Albany, NY.
Jenkins, C.N. and Pimm, S.L. 2003. How big is the global weed patch? Ann. Missouri Bot. Gard., 90: 172–178.
Jullien, M. and Clobert, J. 2000. The survival value of flocking in Neotropical birds: reality or fiction? Ecology, 81: 3416–3430.
Jullien, M. and Thiollay, J.-M. 1998. Multi-species territoriality and dynamic neotropical forest understorey bird flocks. J. Anim. Ecol., 67: 227–252.
Karr, J.R. 1982. Avian extinction on Barro Colorado Island, Panama: a reassessment. Am. Nat., 119: 220–239.
Laurance, S.G.W., Stouffer, P.C. and Laurance, W.F. 2004. Effects of road clearings on movement patterns of understory rainforest birds in Central Amazonia. Conserv. Biol., 18: 1099–1109.
Laurance, W.F., Lovejoy, T.E., Vasconcelos, H.L. et al. 2001. Ecosystem decay of Amazonian forest fragments: a 22-year investigation. Conserv. Biol., 16: 605–618.
LeBreton, J.-D., Burnham, K.P., Clobert, J. et al. 1992. Modeling survival and testing biological hypotheses using marked individuals: a unified approach with case studies. Ecol. Monogr., 62: 67–118.
Leck, C. 1979. Avian extinction in an isolated tropical wet forest preserve, Ecuador. Auk, 96: 343–352.
Lovejoy, T.E., Bierregaard, R.O., Rylands, A.B. et al. 1986. Edge and other effects of isolation on Amazon forest fragments. In Conservation Biology: In Theory and Practice (M. Soulé, ed.), pp. 257–285. Sunderland, MA: Sinauer Associates.
Manne, L.L. and Pimm, S.L. 2001. Beyond eight forms of rarity: which species are threatened and which will be next? Anim. Conserv., 4: 221–230.
Manne, L.L., Brooks, T.M. and Pimm, S.L. 1999. Relative risk of extinction of passerine birds on continents and islands. Nature, 399: 258–261.
Munn, C.A. 1985. Permanent canopy and understory flocks in Amazonia: species composition and population density. Ornithol. Monogr., 36: 683–712.
Van Houtan et al.
146
Oniki, Y. and Willis, E.O. 1972. Studies of ant-following birds north of the eastern Amazon. Acta Amazônica, 2: 127–151.
Pimm, S.L. 1991. The Balance of Nature? Ecological Issues in the Conservation of Species and Communities. Chicago, IL: University of Chicago Press.
Pimm, S.L. 1998. The forest fragment classic. Nature, 393: 23–24.
Pimm, S.L., Jones, H.L. and Diamond, J.M. 1988. On the risk of extinction. Am. Nat., 132:
757–785.
Pimm, S.L., Russell, G.J., Gittleman, J.L. et al. 1995. The future of biodiversity. Science, 269:
347–350.
Powell, G.V.N. 1979. Structure and dynamics of interspecific flocks in a neotropical mid-elevation forest. Auk, 96: 375–390.
Powell, G.V.N. 1985. Sociobiology and adaptive significance of interspecific foraging flocks in the neotropics. Ornithol. Monogr., 36: 713–732.
Remsen, J.V. and Good, D.A. 1996. Misuse of mist-net captures to assess relative abundance in bird populations. Auk, 113: 381–398.
Remsen, J.V. and Parker, T.A., III. 1983. Contribution of river-created habitats to bird species richness in Amazonia. Biotropica, 15: 223–231.
Ridgely, R.S. and Tudor, G. 1989. The Birds of South America, Vol. I. Austin, TX: University of Texas Press.
Ridgely, R.S. and Tudor, G. 1994. The Birds of South America, Vol. II. Austin, TX: University of Texas Press.
Rosenzweig, M.L. 1995. Species Diversity in Space and Time. Cambridge: Cambridge University Press.
SAS Institute. 2003. SAS. Cary, NC: SAS Institute Inc.
S¸ekerciog˙lu, Ç.H., Ehrlich, P.R., Daily, G.C. et al. 2002. Disappearance of insectivorous birds from tropical forest fragments. Proc. Natl. Acad. Sci. USA, 99: 263–267.
Sibley, C.G. and Monroe, B.L., Jr. 1990. Distribution and Taxonomy of Birds of the World. New Haven, CT: Yale University Press.
Stotz, D.F. 1993. Geographic variation in species composition of mixed species flocks in lowland humid forests of Brazil. Pap. Avulsos Zool. (São Paolo), 38: 61–75.
Stouffer, P.C. and Bierregaard, R.O. 1995. Use of Amazonian forest fragments by understory insect- ivorous birds. Ecology, 76: 2429–2445.
Stratford, J.A. and Stouffer, P.C. 1999. Local extinctions of terrestrial insectivorous birds in a frag- mented landscape near Manaus, Brazil. Conserv. Biol., 13: 1416–1423.
Terborgh, J. 1990. Mixed flocks and polyspecific associations: costs and benefits of mixed groups to birds and monkeys. Am. J. Primatol., 21: 87–100.
Terborgh, J., Robinson, S.K., Parker, T.A., III et al. 1990. Structure and organization of an Amazonian forest bird community. Ecol. Monogr., 60: 213–238.
Thiollay, J.-M. 1992. Influence of selective logging on bird species diversity in a Guianan rain forest.
Conserv. Biol., 6: 47–60.
Thiollay, J.-M. 1999. Frequency of mixed species flocking in tropical forest birds and correlates of predation risk: an intertropical comparison. J. Avian Biol., 30: 282–294.
White, G.C. and Burnham, K.P. 1999. Program MARK: survival estimation from populations of marked animals. Bird Study, 46: 120–139.
Williams, B.K., Nichols, J.D. and Conroy, M.J. 2002. Analysis and Management of Animal Popula- tions. San Diego, CA: Academic Press.
Willis, E.O. 1974. Populations and local extinctions of birds on Barro Colorado Island, Panama.
Ecol. Monogr., 44: 153–169.
Willis, E.O. 1979. The composition of avian communities in remanescent woodlots in southern Brazil. Pap. Avulsos Zool. (São Paolo), 33: 1–25.
Willis, E.O. and Oniki, Y. 1978. Birds and army ants. Annu. Rev. Ecol. Syst., 9: 243–263.
Local extinction in flocking birds 147
Wilson, S.K. 2003. Army ants and obligate ant-following birds. PhD dissertation, University of Missouri-Columbia.
Woodroffe, R. and Ginsberg, J.R. 1998. Edge effects and the extinction of populations inside protected areas. Science, 280: 2126–2128.
Woodroffe, R. and Ginsberg, J.R. 2000. Ranging behaviour and vulnerability to extinction in carni- vores. In Behaviour and Conservation (L.M. Gosling and W.J. Sutherland, eds.), pp. 125–140.
Cambridge: Cambridge University Press.
Van Houtan et al.
148