My thanks to Michael Buchhold from the University of Cologne, who magically constructed out of nowhere the exact microscopic model I need for almost all my projects. I am honored to work with Chao Lian at the University of Texas at Austin, who is running a TDDFT simulation that significantly clarifies my elemental tellurium project.
LIST OF TABLES
Light-Induced Emergent Phenomena
If the photon energy of the pump pulse corresponds to an infrared (IR)-active phonon mode, a direct resonant enhancement of such a mode can be initiated (Först et al., 2011). Prominent examples include the light-induced complete suppression of charge order (Möhr-Vorobeva et al., 2011;
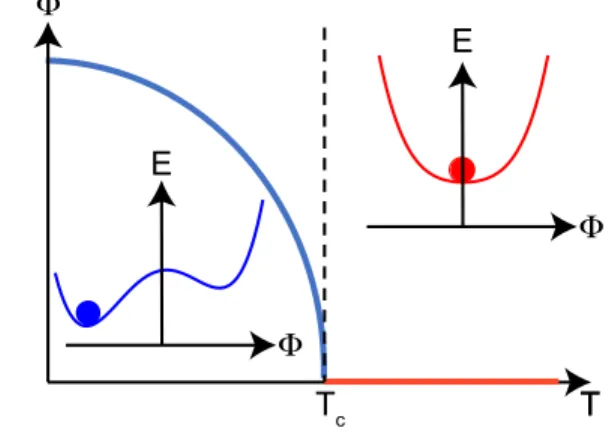
Time Dependent Landau Theory
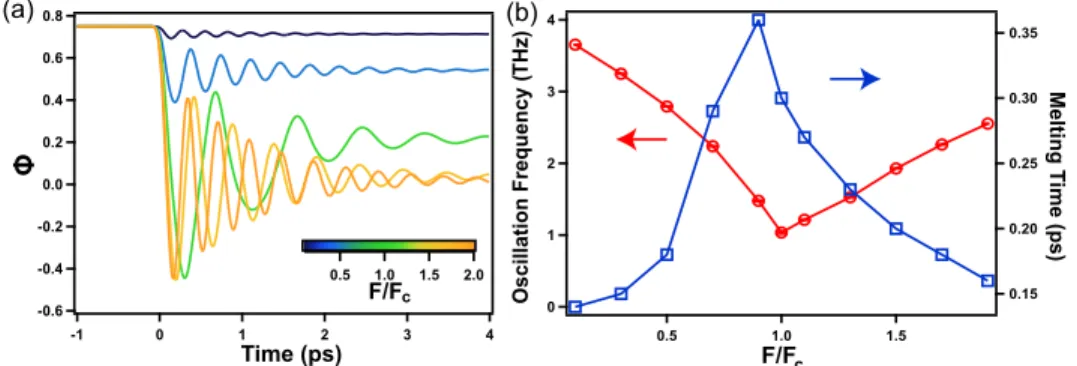
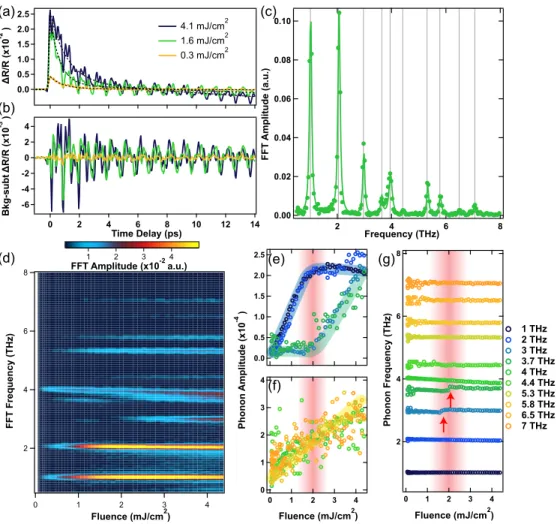
At all influences, a coherent oscillation corresponding to the OP amplitude mode excitation can be resolved unambiguously [Figure 1.5(a)]. At the same time, an inverse behavior of the melting time can be observed, showing a diverging behavior at 𝐹∼𝐹𝑐, indicating a critical slowdown.
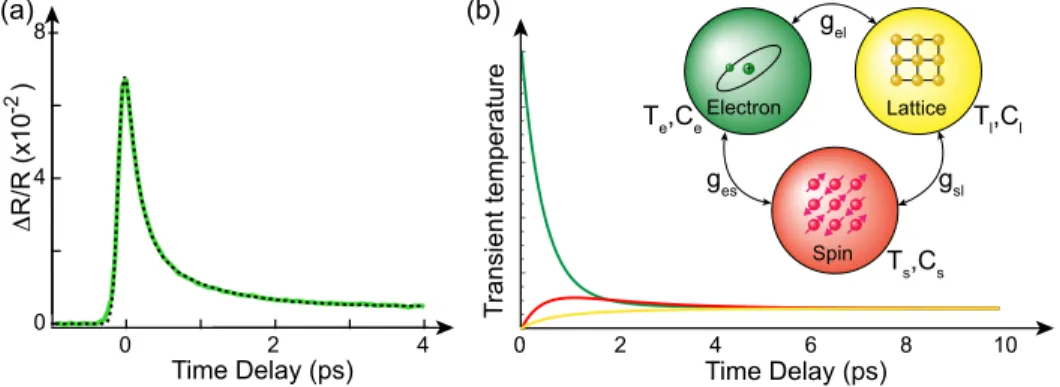
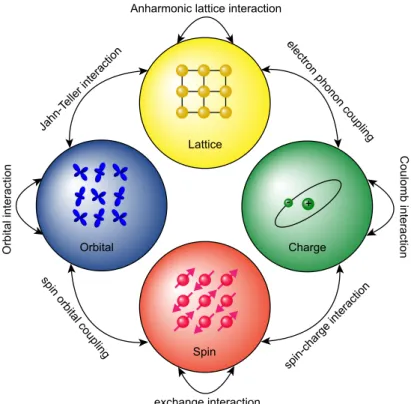
Degrees of Freedom and their Interactions
The origin of these rules can be attributed to the minimization of the Coulomb interaction. This QP velocity change can be interpreted equivalently as an improvement of the effective mass𝑚∗.
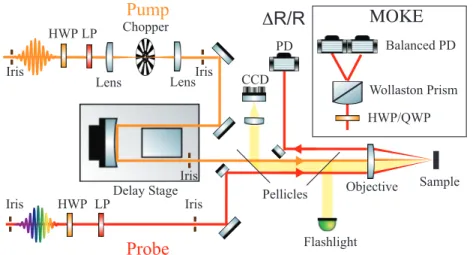
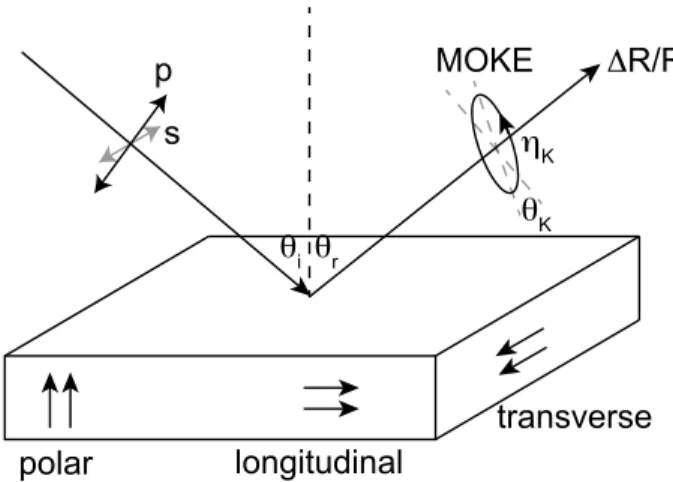
Time-Resolved Reflectivity and Magneto-Optical Kerr Effect
In addition, the polarization change of the reflected light can also arise from the transient change of the grating. We can measure 𝑅by setting the frequency of the lock-in amplifier to be equal to the repetition rate of the laser.
Time-Resolved Second Harmonic Generation Rotational Anisotropy Second harmonic generation (SHG) is the lowest-order degenerate nonlinear opticalSecond harmonic generation (SHG) is the lowest-order degenerate nonlinear optical
Note that if an unknown symmetry breaking occurs, a subgroup of the structural or magnetic point group must be used. Note that additional symmetry constraints of different SHG processes make part of the tensor elements interchangeable.
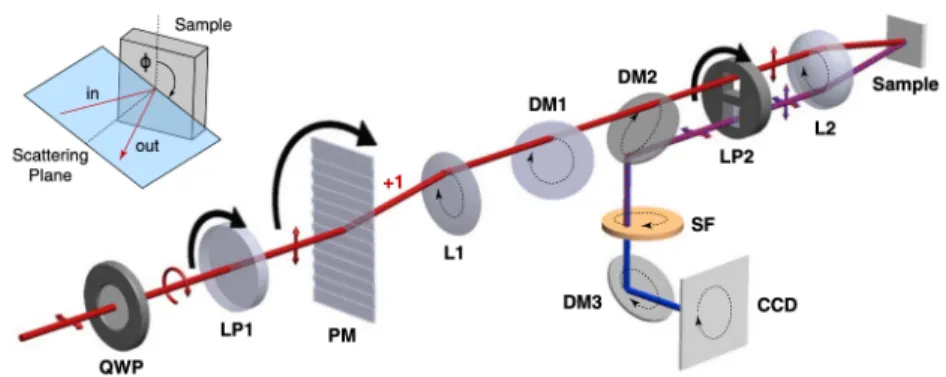
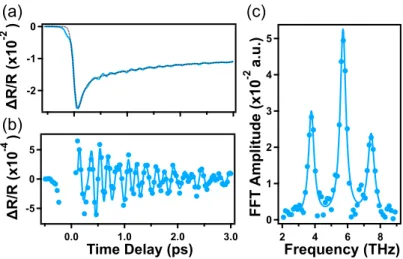
Coherent Phonon Spectroscopy
Depending on the symmetry of the different Raman modes, they can also be measured with probes of different polarization configurations. The symmetry of the different modes can be determined by measuring RA, reminiscent of SHG-RA. The Raman tensor of different modes of different groups of points is available on the Bilbao Crystallographic Server.

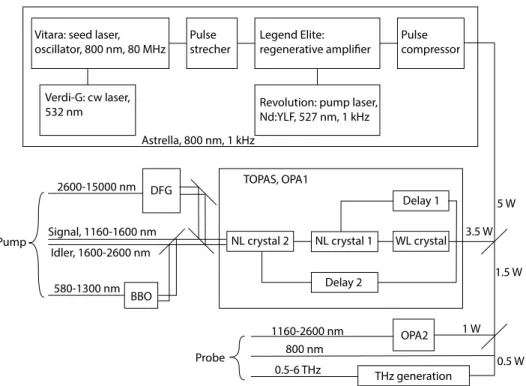
Miscellaneous
This indicates that the current z-axis position is the focal point of the objective and the position where the sample is measured. Both the temporal and spectral profile of the pump and probe beams can be measured using frequency-resolved optical gating (FROG). Using a phase retrieval algorithm, the temporal and spectral information from the beam can be retrieved.
Introduction
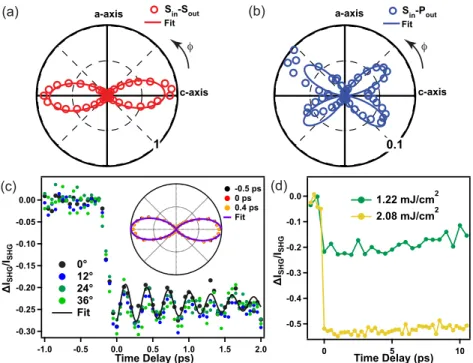
Predicted signatures of the inverse-Peierls deformation are experimentally reproduced using time-resolved optical second harmonic generation rotational anisotropy (tr-SHG-RA). This structure can be considered as arising from the Peierls deformation of an achiral centrosymmetric rhombohedral structure (space group 𝑅3𝑚) in which the NN and NNN distances are equal [Figures 3.1(d),(f)] (Tangney and Fahy, 2002 ). The structural evolution is parameterized by the chain radius𝑥, expressed in units of the lattice constant or interchain distance 𝑎, which is a displacement along the 𝐴.
Density Functional Theory Simulation
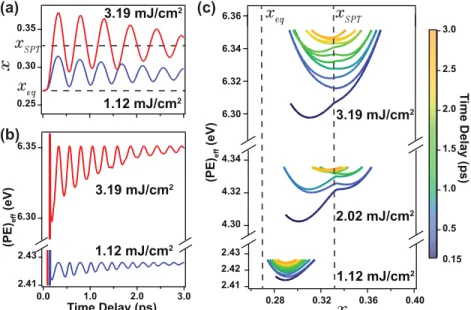
Elemental tellurium (Te) is a prototypical highly spin-orbit coupled Peierls distorted system, which crystallizes in a non-centrosymmetric trigonal structure consisting of chiral chains of Te atoms oriented along the 𝑐 axis, with space group 𝑃3121 or 𝑃3221 depending on the chirality of the chain [Figure 3.1(c) shows the 𝑃3121 structure]. In the equilibrium phase 𝑥𝑒 𝑞 = 0.269 and in the structural phase transition to the rhombohedral phase 𝑥𝑆 𝑃𝑇 = 0.333, which amounts to a difference of about 0.26 Å. Figure 3.1: Band evolution of Te across the Peierls junction. a) Schematic evolution of the potential energy surface (PE) over a Peierls transition. 3D point group). g) DFT calculated band structure of Te in equilibrium and (h) Peierl's undeformed structure, respectively.

Time-Dependent Density Functional Theory Simulation
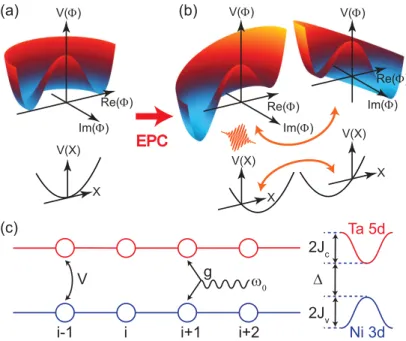
Our method provides a fully ab initio description of the electronic, phonon, and photon degrees of freedom on the same basis. TDDFT calculated time evolution of (a)𝑥and (b) effective potential energy (see text) after impulsive optical excitation at fluence below (blue) and above (red)𝐹𝑐. c) Space-time trajectories of effective potential energy at fluences below, near and above𝐹𝑐. Based on the adiabatic approximation, in which the electrons are assumed to adjust instantaneously to a new lattice position, the time-dependent electronic structure as a function of 𝑥(𝑡) can be reproduced by static DFT calculation as a function of 𝑥 Sie, Nyby , et al., 2019.
Experimental Results
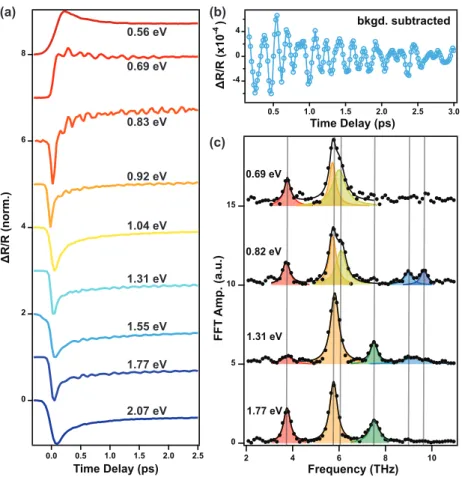
The ratio between 𝜒𝑥 𝑥 𝑥 and 𝜒𝑥 𝑦 𝑧 obtained by fitting is 1:0.05, in agreement with a recent theoretical SHG simulation (M. Cheng et al., 2019). First, the amorphous phase of Te shows a broad mode centered at 4.7 THz in its spontaneous Raman spectrum, which is absent from the FFT spectrum of our signal (Brodsky et al., 1972). The shaded blue bars mark the critical regime. 1995; Teitelbaum et al., 2018) and indicates that TDDFT somewhat underestimates the frequency.
Discussion and Outlook
Following the same direction, one would expect the thin film samples to show a more pronounced frequency softening than the bulk samples, which is indeed the case as shown by previous experimental results on both thin films (Y.-H. Cheng, Teitelbaum et al., 2018) and bulk samples (Hunsche, Wienecke and Kurz, 1996; Kudryashov et al., 2007; Kamaraju et al., 2010).
Introduction
There is currently no experimental method to switch or directly measure the phase of an EI order parameter on ultrashort time scales. Optical phase-resolved measurements of the second harmonic generation (Mankowsky, Hoegen, et al., 2017; Manfred Fiebig, Thomas Lottermoser, et al., 2004; M. Fiebig, Fröhlich, Sluyterman v. L., et al., 1995 ) have been used to measure the phase of structural order parameters in non-centrosymmetric ferroic materials (M). Our simulations show that the EI order parameter is stably inverted above a critical laser fluence, indirectly identifiable via a saturation of the coherent OPCP amplitude.
Microscopic Model and Dynamical Simulation
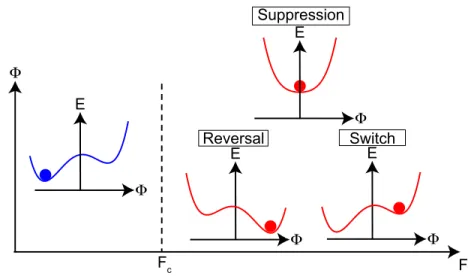
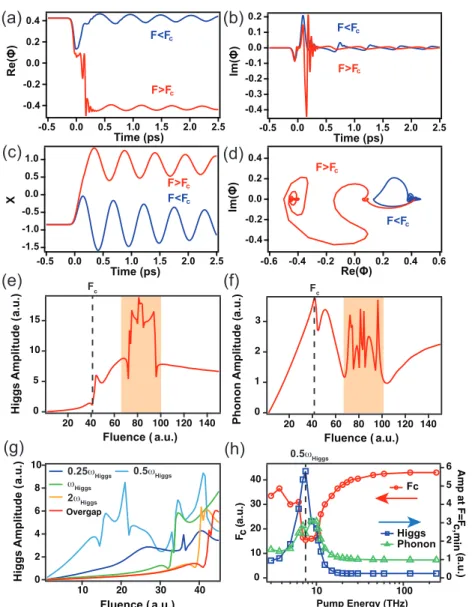
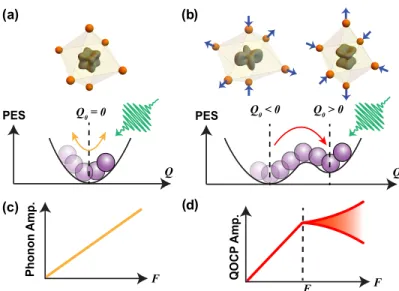
Photographs of the potential landscapes (solid lines) and the electronic and structural order parameters (circles) are shown (a) in the equilibrium state (represented as dashed lines in (b)-(d)), (b) at the moment of excitation, (c) during transition to the reversed state, and (d) in the reversed state before equilibration, where both potentials are modulated at the phonon frequency (red arrows). We show the time evolution of the complex electronic order parameter Φ (real in equilibrium) and the real structural order parameter 𝑋 in Figure 4.3(a)-(d) for two characteristic fluences: 𝐹 > 𝐹𝑐 and 𝐹 < 𝐹𝑐. But once the initial displacement of𝑉(𝑋) is large enough to allow escape to the opposite minimum (𝐹 > 𝐹𝑐), the amplitude stops growing.
Experimental Results
Pump current dependence of the amplitude of the different phonon modes obtained from the Lorentzian fit to the FFT spectra in (d). Pump current dependence of the amplitude of the 1 and 2 THz phonon modes obtained by fitting to the FFT spectra in panels (c)–(g). The amplitude of the 2 THz mode is shifted vertically for clarity. m) Temperature dependence of the critical fluence for 1 and 2 THz phonons.
Control of the Excitonic Order Reversal via Two-Pulse Pumping
𝑋 after single-pulse pumping (black) and two-pulse OP (blue) and IP (red) pumping of 2 THz phonon using. In the case of two pulses, OP pumping of the 2 THz phonon correspondingly leads to partial suppression of Φ without reversal, but reversal is achieved with IP pumping. As shown in Figure 4.8(b) and (c), OP pumping leads to suppression of the 2 THz phonon amplitude relative to the single pump case, similar to a conventional phonon, because the oscillation is around the initial potential minimum.

Resonant Amplification of the Higgs mode
Third, the Higgs mode can decay into a pair of Goldstone modes with half the Higgs mode energy and opposing impulses. We define the Higgs amplitude as the region between 5 and 35 THz of the Higgs mode in the FFT spectra. In summary, our simulation systematically examines the energy of pump photons and the dependence of the amplitude on the Higgs mode and the critical influence of the reversal.
Introduction
The quadrupolar moment of the intermediate state is quite small as evidenced by the RXS results where subtle intensities of several specific magnetic Bragg peaks persist up to 𝑇𝑄𝑂 (Zegkinoglou et al., 2005; Porter et al., 2018). Moreover, the structure of Ca2RuO4 respects a rather low orthorhombic symmetry at all temperatures and shows no obvious anomaly around 𝑇𝑄𝑂, indicating that the QO is hidden from probes sensitive to changes in global structural symmetry (Friedt et al., 2001) . On the other hand, a recent study shows that the phonon of 3.7 THz, whose eigenvector is parallel to the direction of the octahedral distortion across 𝑇𝑄𝑂, shows a phase shift at 𝑇𝑄𝑂 (M.-C. Lee, C.H. Kim, Kwak , J.Kim, et al., 2018).
Experimental Results
Third, we trace the temperature dependence of the amplitude of the pumped 3.7 THz mode at a fixation𝐹 =15 mJ/cm2 and find an order parameter as the phonon amplitude reversal in 𝑇𝑄𝑂 [Figure 5.5(b)], in accordance good with the temperature dependence of 𝐹𝑐. The 3.7 THz phonon amplitude onset and 𝐹𝑐at To understand the phonon nonlinearity with electronic band resolution, we investigate the 𝐹 dependence of the 3.7 THz mode amplitude at different probe energies at 80 K.
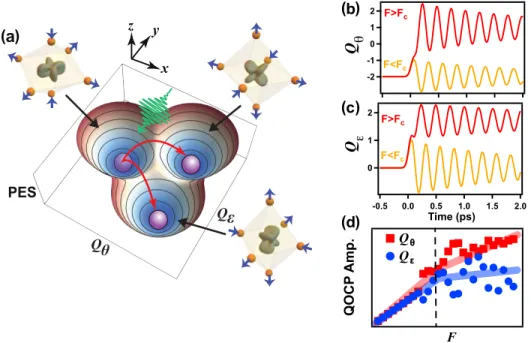
Microscopic Model and Dynamical Simulation Microscopic ModelMicroscopic Model
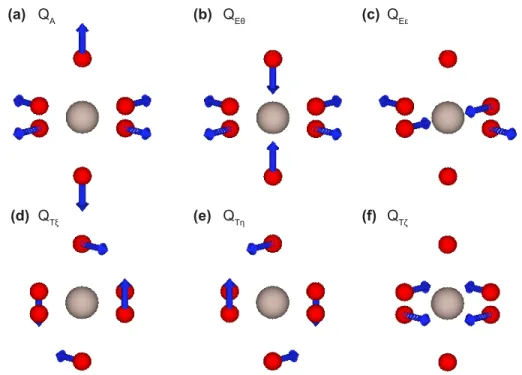
By performing the FFT on the time traces, after the system is stabilized, as we vary the only free parameter 𝐹, we can follow the fluence amplitude dependence of the 𝑄𝜃 and 𝑄𝜖 modes. 1, the system will roll over the barrier and move into a new valley, which obviously travels a longer distance, so the damping will reduce the amplitude by 𝐹. As 𝐹 increases further, more energy deposited into the system will compensate for the damping loss and the phonon amplitude will slowly increase until it again reaches the boundary between the two valleys at 𝐹 = 𝐹𝑐.
Discussion and Outlook
However, since direct evidence of the hidden QO is lacking, we refrain from drawing more detailed conclusions. In the previous chapter, we focused on the phonon dynamics of the transient reflection curves at selected probe energies and temperatures, revealing an ultrafast switch of spin-orbit coupled quadrupolar order. In this chapter, we find that the sign and magnitude of the background exponential terms capture the charge dynamics on the sub-gap pump, reflecting the transient electron distribution through nonlinear carrier generation.
Introduction
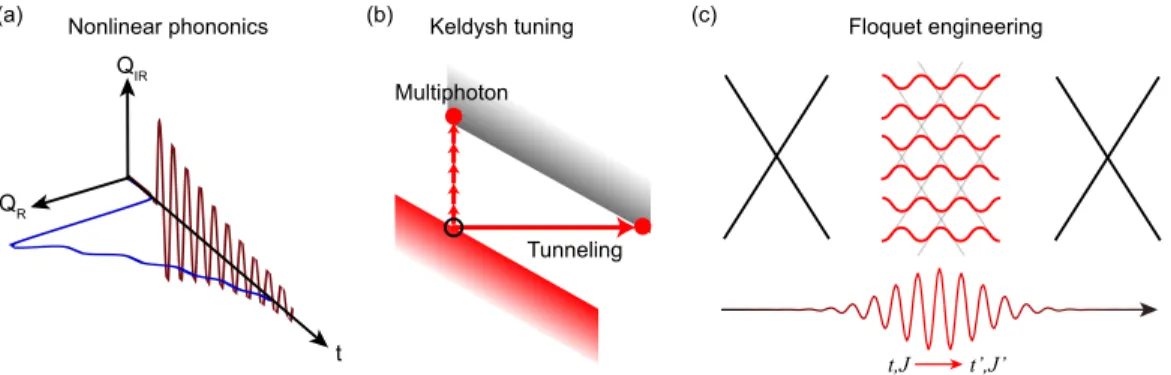
More specifically, by sweeping the pump flow, we demonstrate the so-called Keldysh crossover from a multi-photon absorption to quantum tunneling-dominated pair production regime associated with a continuous coherent bandwidth renormalization. Therefore, there is growing interest in understanding double lon-holon (d-h) pair production and their non-thermal dynamics in the strong field AC regime. In particular, d-h pairs are mainly produced by two nonlinear mechanisms: multi-photon absorption and quantum tunneling (Oka, 2012; Kruchinin, Krausz, & Yakovlev, 2018).
Experiment and Simulation: Nonlinear Carrier Generation and Keldysh CrossoverCrossover
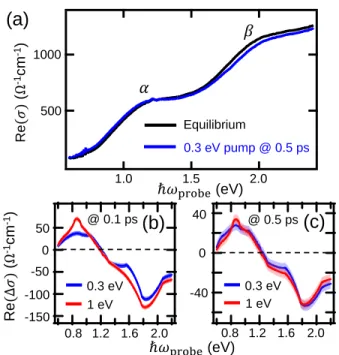
As will be shown later [Figure 6.5(a)], it is valid to assume that Δ(𝑝𝑥, 𝑝𝑦) decreases in proportion to the number of excitations. For the Keldysh tuning case [Figure 6.3(b)], as 𝑃𝑝 evolves from state (i) to (iii), we find that the intersection between the nonequilibrium and equilibrium reflectivity spectra shifts to progressively higher energy. In stark contrast to the subgap pumping case, the amplitude of𝑃𝑝 increases with𝐸. Figure 6.3: Non-thermal pair distribution through the Keldysh junction. a) Calculate𝑃𝑝 for conditions using the Landau-Dykhne method.

Experiment and Simulation: Coherent Bandwidth Renormalization and Floquet EngineeringFloquet Engineering
We expanded the bandwidth 𝑊 in the simulation by reducing the tilt angle 𝜃 of the structure [Figure 6.8(a) bottom panel] while keeping all other structural parameters the same;. The table in Figure 6.8(b) shows examples of combinations of structural parameters and the resulting ratio between the modified bandwidth and the static equilibrium bandwidth, 𝑊/𝑊. As can be clearly seen in the bottom panel of Figure 6.8(b), the blue parameter set actually leads to an expanded bandwidth compared to the red parameter set.
Discussion and Outlook
According to Ref. (Mentink, Balzer, and M. Eckstein, 2015), when the Mott insulator is strongly coupled (𝑈 ≫ 𝑡), the ratio of the light-modified bandwidth to the static bandwidth is . Since bandwidth renormalization increases with the Floquet parameter in the case of photo-assisted virtual hopping, this obviously explains why subgap pumping induces the much larger UBR effect compared to over-gap pumping.
SHG AS A PROBE OF STRUCTURE OF MAGNETIC WEYL SEMIMETALS
Introduction
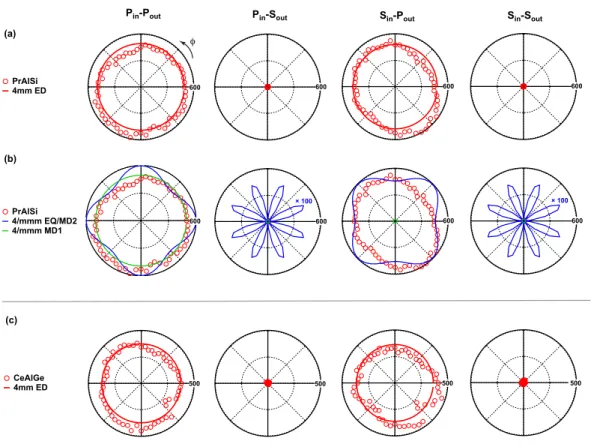
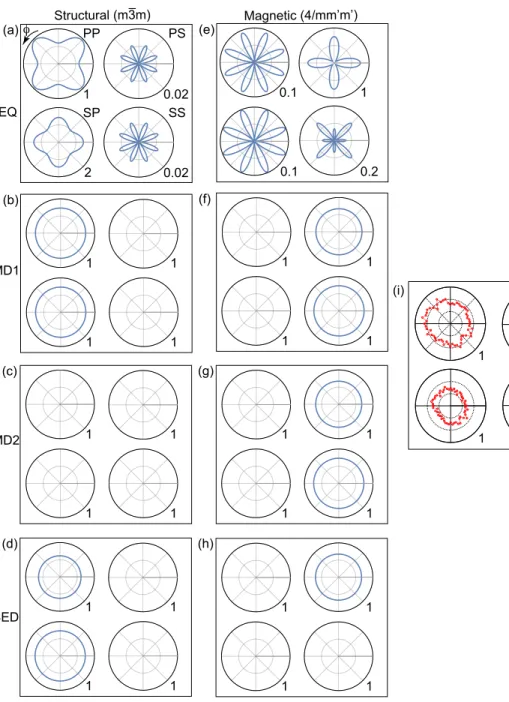
The SHG-RA data are collected by choosing the incident (in) and outgoing (out) light polarization to be either parallel (P) or perpendicular (S) to the scattering plane and then recording the intensity of reflected SHG as the scattering plane is rotated about (001 ) axis of PrAlSi. The ED SHG contribution from the (001) surface of a 4/𝑚 𝑚 𝑚 point group can produce the same RA patterns as the bulk ED SHG from a 4𝑚 𝑚 point group. This indicates that the SHG response of PrAlSi is predominantly of bulk ED origin from a 4𝑚 𝑚 point group, as opposed to surface ED origin which would be much weaker.
SHG measurements of Co 2 MnGa
We measured the SHG-RA patterns in the four geometries and found that both the SHG-RA patterns and the absolute SHG intensities from PrAlSi and CeAlGe are very similar [Figure A.1(c)]. For this purpose, we used a near-IR 800 nm (1.55 eV) light and performed the SHG-RA measurement to investigate the possible enhancement of SHG signal from resonant excitation of electrons between flat surface bands in Co2MnGa. We performed the SHG-RA measurement on the (001) surface of Co2MnGa at 300 K in the four different polarization configurations.
BIBLIOGRAPHY
Imaging the coherent propagation of collective modes in the excitonic insulator Ta2NiSe5 at room temperature”.