The Quest for Equity: An Examination of Weighted-Student Funding and Site-Based Budgeting in Tennessee
By
Angelique Nicole Crutchfield
Dissertation
Submitted to the Faculty of the Graduate School of Vanderbilt University
in partial fulfillment of the requirements for the degree of
DOCTOR OF PHILOSOPHY in
Leadership and Policy Studies December 16, 2023 Nashville, Tennessee
Approved:
Christopher A. Candelaria, Ph.D.
Jason A. Grissom, Ph.D.
Chezare A. Warren, Ph.D.
Alounso A. Gilzene, Ph.D.
To my inspiring and bright daughters to encourage you to dream big and never give up, to my exemplary mother and grandmother for setting a high bar,
to my amazing husband for your boundless support and love, and
to my cherished father and grandfather in loving memory
Acknowledgements
I would like to express my deepest gratitude to my family for their unwavering support throughout this academic journey. Your encouragement and belief in me have been a constant source of motivation. To my husband, your support, understanding, and patience during this challenging process have been my rock. I could not imagine doing this without you.
I am immensely grateful to my dissertation committee for their valuable insights, feedback, and guidance. Your expertise has been instrumental in shaping this work. I want to extend a special thanks to my chair for the countless hours dedicated to guiding and helping me through this process. Your wisdom, dedication, and encouragement were invaluable.
I also want to acknowledge and express my appreciation to countless others I have worked with during my time at Vanderbilt. From fellow students to professors, you have served as a constant source of inspiration. Your intellectual contributions, camaraderie, and the
exchange of ideas have enriched my academic experience and helped strengthen my research.
I would also like to extend my gratitude to the Metro Nashville Public Schools (MNPS) principals who participated in this research and to MNPS for allowing me to conduct this study.
Your cooperation and willingness to engage in this research were essential to its success.
This dissertation would not have been possible without the support and contributions of all those mentioned above. Thank you for being an integral part of this academic journey.
Table of Contents
Acknowledgements ... iii
List of Tables ... viii
List of Figures ... ix
Chapter 1 Introduction ... 1
School Finance Methodologies in Tennessee ... 2
District-Level Resource Distribution Methodologies ... 4
Student-Based Budgeting in MNPS ... 6
Student-Based Budgeting in SCS ... 6
Exploring Resource and Outcomes-Based Equity in MNPS and SCS ... 7
References ... 9
Chapter 2 Weighted-Student Funding and Equity: Does Differentiated Funding Lead to More Equitable Outcomes? ... 12
Introduction ... 12
Weighted Student Funding Background ... 17
Implementation and Allocation Method of WSF ... 19
Examining Equity and Outcomes in WSF Districts ... 20
Study Context ... 23
Methodology ... 27
Data ... 27
Analytic Plan ... 28
Examining Resource Equity through Progressivity ... 29
Intra-District Resource Equity ... 31
Inter-District Resource Equity ... 32
Results ... 34
Intra-District Equity in MNPS ... 35
Intra-district Resource Equity: SCS ... 38
Outcomes-Based Equity in MNPS ... 43
Outcomes-Based Equity in SCS ... 46
Other Specification Models ... 48
Discussion and Conclusion ... 49
References ... 54
Chapter 3 Toward a Conceptualization of Equity-Focused Research Management: A Multiple Case Study Approach in Metro Nashville Public Schools ... 72
Introduction ... 72
Conceptual Framework ... 75
Equity-Focused Resource Management ... 75
Framing Disparities and Action ... 77
Construction and Enactment of Leadership ... 78
Culture of Inquiry ... 79
Summary ... 80
Methodology ... 80
Sample ... 82
Analytic Approach ... 83
Conceptualizing Equity ... 84
Allocating Resources ... 84
Findings ... 85
Conceptualizing Equity ... 87
Access to Resources and Opportunity ... 87
School and Community Context ... 89
Inclusivity in Diverse Contexts ... 90
Framing Disparities ... 92
Pervasive Impact of Poverty ... 92
Parental Perceptions and Lack of Educational Support ... 93
Language Barriers and Educational Access ... 94
Parental Illiteracy ... 95
Taking Action through Resource Allocations ... 96
Strategically Allocating Personnel Resources ... 97
Holistic Non-Personnel Allocations for Student Well-Being ... 101
Equity-Focused Capacity Building Allocations ... 103
Construction and Enactment of Leadership ... 106
Teacher-Centric Stakeholder Involvement ... 107
Multiple Stakeholder Collaboration ... 108
Fostering a Culture of Inquiry and Continuous improvement ... 111
Facilitating Effective Data Use ... 112
Using Data to Inform Resource Allocation Need ... 115
Discussion ... 117
Conclusion ... 121
References ... 122
Appendix A: Semi-Structured Principal Interview Protocol (First Interview) ... 128
Appendix B: Semi-Structured Principal Interview Protocol (Second Interview) ... 129
Appendix C: Semi-Structured Teacher Focus Group Protocol ... 131
Chapter 4 The Impact of Additional Funding and Principal Flexibility on Student Outcomes ... 132
Introduction ... 132
The Depth and Breadth of Student-Based Budgeting Research ... 136
The Ambiguities of Student-Based Budgeting Outcomes ... 136
Exploring Broad Gaps in Student-Based Budgeting Studies ... 139
Student-Based Budgeting Implementation in Metro Nashville Public Schools ... 141
Conceptualizing Student-Based Budgeting ... 143
Education Production Theory and Student-Based Resource Allocation ... 143
Resource Allocation in Effective Schools ... 146
Analytic Plan and Methods ... 148
Quantitative analyses ... 148
Dosage-Based Measure of Treatment ... 149
Identification Strategy: Comparative Interrupted Time Series (CITS) Design. ... 151
Analyzing Heterogeneity Among Student Subgroups ... 152
Robustness Checks and Assumptions ... 153
Qualitative Analysis ... 154
Coding Strategy ... 154
Ensuring Reliability and Consistency in Analysis ... 154
Data ... 155
Quantitative Data ... 155
Outcome Measures ... 156
Overview of the Analytic Sample ... 157
Qualitative Data ... 157
Qualitative Sample Characteristics ... 158
Results ... 159
Evidence from Event Studies ... 159
Evidence from Comparative Interrupted Time Series and Difference-in-Differences .. 160
Robustness Checks ... 163
Qualitative Findings ... 163
Considering Broader School Contexts ... 164
Deep Understanding of Students’ Multifaceted Needs ... 165
Using Increased Flexibility to Meet Student Needs ... 167
Constraints of Limited Flexibility ... 168
Focusing on People First Resource Allocations ... 170
Navigating the Budgetary Process ... 172
Student Learning Loss Resulting from COVID-19 ... 173
Minimizing Funding Constraints through ESSER Funding ... 175
Discussion and Conclusion ... 176
References ... 178
Chapter 5 Conclusion ... 194
List of Tables
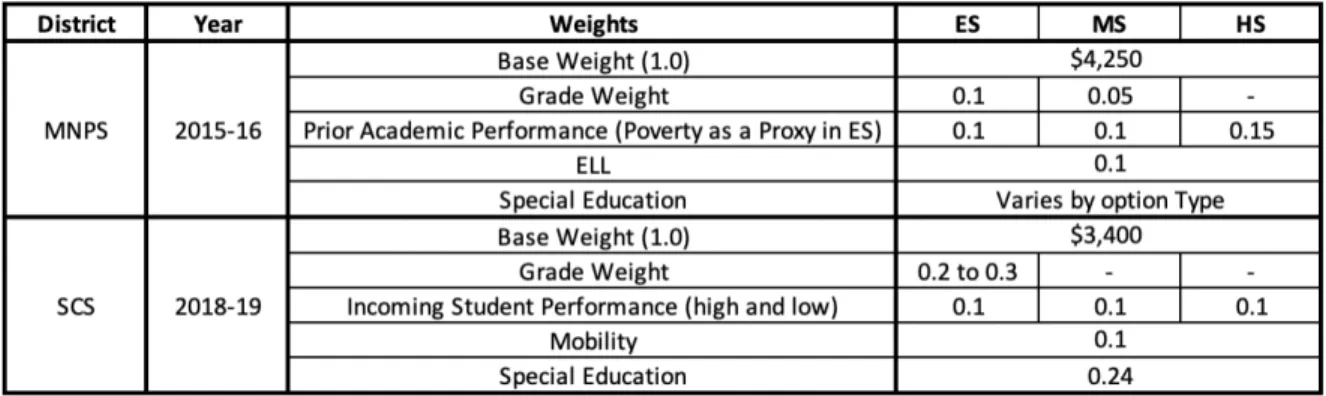
Table 2-1. MNPS and SCS Weights in Initial WSF Year ... 58
Table 2-2. School Characteristics for WSF Districts and Non-WSF Comparison Districts 58 Table 3-1. Principal Characteristics ... 127
Table 4-1. Descriptive Statistics ... 184
Table 4-2. Descriptive Characteristics of Principals in Qualitative Sample ... 185
Table 4-3. Test Score Outcomes on 3rd and 4th Grade State Assessments ... 186
Table 4-4. Discipline Outcomes ... 187
Table 4-5. Attendance Outcomes ... 188
Table 4-6. Heterogeneity Analyses ... 189
Table 4-7. Robustness Check: Demographic Changes ... 190
Table 4-8. Robustness Check: Test Score Missingness/Suppression ... 191
List of Figures
Chapter 1
Introduction
In the landscape of American public education, the pursuit of equitable educational opportunities has long been a fundamental tenet. Ensuring that all students, regardless of their socioeconomic background, geographical location, or other student characteristics, have access to a high-quality education that fosters positive student outcomes remains a paramount goal.
Equitable school funding is one means of promoting positive student outcomes (e.g., Jackson, 2020; Candelaria & Shores, 2019), yet intra-district funding is often inequitably distributed (Shores & Ejdemyr, 2017). This is particularly problematic in urban districts which tend to serve large proportions of students with higher educational needs, such as economically disadvantaged students and English language learners, who typically have poorer outcomes compared to more advantaged student subgroups (Miles & Roza, 2006; Stiefel, Rubenstein, & Berne, 1998).
To ensure more equitable opportunity for these students and improve student outcomes, many districts have adopted a decentralized funding approach known as student-based
budgeting. This approach combines site-based budgeting with weighted-student funding, in order to achieve resource equity and outcomes-based equity (Ladd, 2008; Chambers et al., 2010;
Malen, Dayhoff, Egan, & Croninger, 2017). The weighted student funding component of SBB accounts for the differential costs of educating different categories of students and provides students with the highest need a larger share of resources. The site-based budgeting component provides principals with greater budgetary flexibility to tailor school resources to student needs.
Through student-based budgeting, school leaders play an important role in determining the inputs necessary to produce more effective schools and more equitable education outcomes.
understand students’ educational needs and best know how to utilize resources to address those needs and improve student outcomes (Chambers et al., 2010; Annenberg Institute, 2002). For this approach to produce the desired output of improving student outcomes, school-level leaders have to understand the cost of educating different categories of students and be able to identify the services required for these students to be successful. Knowledge of these costs and services must also inform the district’s allocation of school-level funds to ensure equity (Malen et al., 2017; Foley, 2010; Ladd, 2008).
This dissertation research examines the intricate relationship between SBB and
educational equity, with a particular focus on the two largest urban school districts in Tennessee:
Metro Nashville Public Schools (MNPS) and Memphis-Shelby County Schools (SCS). In this introductory chapter, I will begin with an overview of school finance in Tennessee to provide context and situate the two SBB districts. I will then take a more detailed look at school finance within MNPS and SCS. I will conclude with a brief overview of the three essays that will follow in this dissertation and that shed light on the relationship between SBB and equity in these two urban districts.
School Finance Methodologies in Tennessee
This section discusses the state-level and district-level resource distribution and school finance approaches in Tennessee. Tennessee introduced the Basic Education Program (BEP) in the early 1990s, which evolved into BEP 2.0 to better address varying student needs. To further the state’s commitment to fostering equity in schools, the Tennessee Investment in Student Act (TISA) was signed in 2022, shifting the district funding model to focus more on individual student needs. Likewise, MNPS and SCS have adopted student-based budgeting to align resources with individual student requirements. These reforms signify a drive towards a more
equitable and student-centered education system.
State-Level Resource Distribution to Districts
Over recent decades, Tennessee has championed substantial educational changes with an emphasis on enhancing the quality, accessibility, and funding of education. In 1992, the state rolled out the Basic Education Program (BEP), aiming to standardize education funding throughout districts and guarantee every student had sufficient funding. This program uses a formula to allocate state education dollars based on factors like student enrollment, teacher salaries, and infrastructural requirements. It determines the expense of delivering fundamental education and splits this between state and local authorities, factoring in aspects such as local fiscal capabilities (Meyers, Valesky, & Hirth, 1995; GoldBaher & Callahan, 2001; Krause, 2010;
Cohen-Vogel & Cohen-Vogel, 2001). In 2007, the BEP evolved into BEP 2.0, restructured to more effectively address school and student requirements. This update sought to improve the funding model to better represent the actual expense of educating students, considering elements like student counts and their varied needs (Krause, 2010).
In more recent years, Tennessee has continued to explore new ways to improve equitable resource distribution to schools. The state has made efforts to increase investments in education, in order to improve student outcomes and distribute resources more equitably among various school districts, regardless of size (GoldBaher & Callahan, 2001; Cohen-Vogel & Cohen-Vogel, 2001). The state is also implementing more responsive funding techniques, like the Tennessee Investment in Students Act (TISA), to better serve the needs of diverse student groups (Hahnel, Marchitello, & Ali, 2023).
The TISA Act was signed into law in 2022. This legislation signifies a significant shift in Tennessee’s investment in public education, marking the first major overhaul to the funding
formula in over three decades. Under the TISA funding formula, Tennessee transitioned to a student-based funding model, committing an estimated $9 billion in education funding, including state and local contributions. This includes an additional recurring state investment of $1 billion, starting in the 2023-24 school year (Tennessee Department of Education, 2023).
The TISA public school funding formula aims to empower each student to achieve proficiency in reading by the third grade, equip high school graduates for success in
postsecondary education, and provide necessary resources for all students to ensure their success (TDOE, 2023). TISA includes four key components: a base funding amount allocated to every public-school student; weighted funding to address specific student needs (e.g., low-income students, English learners, students with disabilities, those with characteristics of dyslexia, and students in small or remote communities); direct funding for key priorities like early literacy, career and technical education (CTE), and postsecondary readiness; and outcomes-based funding tied to student achievement. These key funding components are designed to help districts support all students in reaching their full potential (TDOE, 2023). TISA grants districts the autonomy to allocate funds in ways that best serve their local needs. With TISA, funding distribution to districts is based on the students they serve, granting districts the discretion to use funds in a manner that aligns with their unique requirements and educational priorities. This funding
approach represents a significant step towards a more equitable and student-centered approach to education funding in Tennessee (TDOE, 2023).
District-Level Resource Distribution Methodologies
Traditionally, many of Tennessee’s school districts have gravitated towards a centralized funding model (Bergfeld, Potts, & Mumpower, 2021). Under this model, the district’s central office takes the reins, orchestrating the distribution of staff and resources among schools. This
method often sees districts using guides that mirror the BEP’s approach, where staffing decisions are influenced by student enrollment numbers (Bergfeld, Potts, & Mumpower, 2021). For
example, a district might assign a certain number of teaching assistants, specialists, or other staff to a school based on the number of students enrolled in the school. It is important to note that these guides are flexible and not prescriptive; they serve as a foundation that districts adapt based on the specific needs and circumstances of each school.
However, funding disparities persist, notably between affluent and less affluent districts, largely due to the pronounced impact of local funding. Districts with substantial property taxes can invest more in their schools, often resulting in resource and opportunity gaps (GoldBaher &
Callahan, 2001; Cohen-Vogel & Cohen-Vogel, 2001; Klein, 2008). To combat these inequities, districts like MNPS and SCS have adopted customized resource allocation and budgeting approaches, like weighted-student funding or student-based budgeting (Jarmolowski, Aldeman,
& Roza, 2022; Chang, 2018; Roza, Hagan, & Anderson, 2021).
Student-Based Budgeting Model
Driven by a desire to prioritize educational equity, both MNPS and SCS transitioned to a Student-Based Budgeting (SBB) model in recent years (Shelby County Schools, 2018; Metro Nashville Public Schools, 2023; Bergfeld, Potts, & Mumpower, 2021). Unlike traditional funding paradigms, SBB allocates funds based directly on individual student needs. This model hinges on a formula crafted collaboratively by district leaders and school principals. It assigns funding to schools predicated on the requirements of specific student populations—like students with disabilities, economically disadvantaged students, or English language learners. While the district retains control over certain budget activities, such as building maintenance,
transportation, and administrative functions like security and technology services, a large
proportion of the district-level funding is directly allocated to schools (Bergfeld, Potts, &
Mumpower, 2021).
Student-Based Budgeting in MNPS
Metro Nashville Public Schools (MNPS), situated in the state’s capital and Tennessee’s second-largest district, serves as an example of a district in a dynamic urban setting with diverse student needs. Approximately 70% of the student population is Black or Latino, approximately 35% is economically disadvantaged, and approximately 30% are English language learners (TDOE, 2023). MNPS, with its rich cultural diversity, has sought to provide students with more equitable opportunities for academic success.
MNPS began SBB districtwide in 2015-16 after a two-year pilot. SBB gave principals budgetary flexibility over approximately 50% of the district’s budget (MNPS, 2023).The goal of SBB in MNPS was to distribute resources in alignment with student needs, inspire creative decisions, bolster accountability and transparency, and align central office support to school needs (MNPS, 2015). In the 2015-16 academic year, MNPS set a standard student weight of
$4,250, with additional weights based on factors like grade level, prior performance, ELL status, and special education. MNPS has been continuously fine-tuning their allocations each year.
Student-Based Budgeting in SCS
Memphis-Shelby County Schools (SCS), located in the southwestern region of the state and the largest school district in Tennessee, represents a sprawling urban district with a
predominantly black and economically disadvantaged student population. In SCS, over 70% of the student population is black and over 50% is economically disadvantaged (TDOE, 2023). SCS has grappled with longstanding disparities in educational outcomes, predominantly along
socioeconomic lines, consistently serving the largest proportion of low-performing schools in
Tennessee. The district adopted student-based budgeting to help rectify student disparities and improve student outcomes.
SCS adopted a weighted-student funding (WSF) approach during the 2018-19 academic year. In its first year, SCS earmarked approximately 38% of its budget, totaling around $1 billion, for WSF to meet the unique needs of students, especially those encountering learning challenges (Kebede, 2020). The adoption of this funding approach in Memphis aimed to empower individual schools to make budgetary decisions aligned with their distinct
requirements, thereby promoting equity and ensuring that all students have equitable access to essential resources (SCS, 2019). In its initial year of implementation, students received a base allocation of $3,400, with supplementary weights factored in for grade level, student
performance, mobility, and special education. Mobility was utilized as a more nuanced indicator of poverty to provide a more accurate representation of students’ needs. Additionally, in the 2019-20 academic year, SCS introduced an additional weight of 0.03 for English Language Learners (ELL) to account for potential discrepancies in measuring poverty (SCS, 2019). Similar to MNPS, Memphis-Shelby County Schools has continued to refine their weights and base allocation amount in each subsequent school year.
Exploring Resource and Outcomes-Based Equity in MNPS and SCS
The following chapters in this dissertation provide in-depth exploration of student-based budgeting, as a whole or in part, and how it effects or relates to resource equity and outcomes- based equity, particularly for historically underserved subgroups. In Chapter 2, I use a
descriptive analysis and causal analysis to examine the effects of weighted-student funding on resource equity and outcome-based equity in MNPS and SCS. The descriptive analysis uses an exposure-based and slope-based progressivity measure to assess resource equity for historically
underserved student subgroups, particularly English language learners, economically disadvantaged students, and students with disabilities. The progressivity measure indicates whether disadvantaged students tend to be enrolled in schools with more, or less, funding relative to their non-disadvantaged comparison group (Chingos & Blagg, 2017). The causal analysis examines the effect of WSF on outcomes-based equity (achievement scores and graduation rates) over time in MNPS and SCS using an augmented synthetic control method.
In Chapter 3, I use a multiple case study methodology to explore how MNPS principals conceptualize equity and how this conceptualization influences their resource management and allocation process. I use an equity-focused organizational leadership framework developed by Ishimaru and Galloway (2014) to inform my analysis.
In Chapter 4, we use a mixed methods approach to examine how higher levels of funding affect student outcomes and how these effects vary by student subgroup using a comparative interrupted time series design. This paper is the first to use a causal analysis to examine the extent to which student outcomes are affected by varying dosage levels of student-based budgeting. We also use a qualitative analysis to explore potential mechanisms of student-based budgeting that may lead to improved student outcomes.
These essays provide insight into whether differential funding based on student characteristics, improves resource equity and outcomes-based equity for underserved student subgroups. Additionally, these findings can inform policy discussions around how to more efficiently and equitably align financial resources to students as well as provide insight into the role equity-focused resource management plays in strategic principal leadership. Findings will also inform policy regarding how much funding may be adequate to achieve desired student outcomes.
References
Annenberg Institute for School Reform. (2002). First steps to a level playing field: An
introduction to student-based budgeting. Providence, RI: Annenberg Institute for School Reform at Brown University.
Candelaria, C. A., & Shores, K. A. (2019). Court-ordered finance reforms in the adequacy era:
Heterogeneous causal effects and sensitivity. Education Finance and Policy, 14(1), 31- 60.
Chambers, J. G., Levin, J. D., & Shambaugh, L. (2010). Exploring weighted student formulas as a policy for improving equity for distributing resources to schools: A case study of two California school districts. Economics of Education Review, 29, 283-300.
Chang, B. (2018). Transforming School Funding for Equity, Transparency, and Flexibility: An Introduction to Student-Based Budgeting. Watertown, MA: Education Resource
Strategies.
Bergfeld, T., Potts, K., & Mumpower, J. E. (2021). How much Tennessee public schools spend per student. Tennessee Comptroller of the Treasury, Office of Research and Education Accountability. Retrieved from:
https://comptroller.tn.gov/content/dam/cot/orea/advanced-search/2021/PPE_Report.pdf Foley, E. (2010). Equity and student-based budgeting. Voices in Urban Education, 29, 6-16.
Fordham Institute. (2006). Fund the child: Tackling inequity and antiquity in school finance. Washington, DC: Thomas B. Fordham Institute.
Goldhaber, D., & Callahan, K. (2001). Impact of the Basic Education Program on Educational Spending and Equity in Tennessee. Journal of Education Finance, 26(4), 415–435.
Jackson, C. K. (2020). Does school spending matter? The new literature on an old question. In L.
Tach, R. Dunifon, & D. L. Miller (Eds.), Confronting inequality: How policies and practices shape children's opportunities (pp. 165–186). American Psychological Association. https://doi.org/10.1037/0000187-008
Jang, H., & Disalvo, R. W. (2022). Separate, but Better? Measuring School Spending
Progressivity and its Association with School Segregation. EdWorkingPaper: 22-678.
Annenberg Institute at Brown University.
Jarmolowski, H., Aldeman, C., and Roza, M. (2022). Do districts using weighted student funding formulas deliver more dollars to low-income students? Peabody Journal of Education, 97(4), 427-438.
Kebede, L. F. (2018). For the first time, money for Memphis schools will be based on student needs. Here’s how it works. Chalkbeat. Retrived from:
https://tn.chalkbeat.org/2018/6/7/21106653/for-the-first-time-money-for-memphis- schools-will-be-based-on-student-needs-here-s-how-it-works
Klein, C. C. (2008). Intradistrict public school funding equity, community resources, and performance in Nashville, Tennessee. Journal of Education Finance, 1-14.
Krause, M. (2010). State Education Finance and Governance Profile: Tennessee. Peabody Journal of Education, 85(1), 97–100.
Hahnel, C., Marchitello, M., & Ali, T. T. (2023). From Antiquated to Equitable: How Tennessee Overhauled Its State School Funding Formula. Bellwether.
Ladd, H. F. (2008). Reflections on equity, adequacy, and weighted student funding. Education Finance and Policy, 3, 402-423.
Meyers, T. J., Valesky, T. C., & Hirth, M. A. (1995). K-12 Education Funding in Tennessee:
Equity Now — Adequacy Coming. Journal of Education Finance, 20(4), 394–409.
Malen, B., Dayhoff, J., Egan, L., & Croninger, R. G. (2017). The challenges of advancing fiscal equity in a resource-strained context. Educational Policy, 31(5), 615-642.
Metro Nashville Public Schools. (2023). Funding Metro Nashville Public Schools Retrieved from: https://www.mnps.org/about/budgets
Miles, K. H., & Roza, M. (2006). Understanding student-weighted allocations as a means to greater school resource equity. Peabody Journal of Education, 81(3), 39-62.
Roza, M., Hagan, K., & Anderson, L. (2021). Variation is the norm: A landscape analysis of weighted student funding implementation. Public Budgeting & Finance, 41(1), 3-25.
Shelby County Schools. (2018). Back To Students Frequently Asked Questions (FAQs).
Retrieved from:
https://www.scsk12.org/back2students/files/2018/Back2StudentsFAQs.pdf Shores, K., & Ejdemyr, S. (2017). Pulling back the curtain: Intra-district school spending
inequality and its correlates. Retrieved from: https://ssrn.com/abstract=3009775 or http://dx.doi.org/10.2139/ssrn.3009775
Stiefel, L., Rubenstein, R., & Berne, R. (1998). Intra-district equity in four large cities: data, methods and results. Journal of Education Finance, 23(4), 447–467.
Tennessee Comptroller of the Treasury, Office of Research and Education Accountability.
(2021). Dashboard of per pupil expenditures by school [Interactive dashboard].
Tennessee Department of Education (2023). Tennessee Investment in Student Achievement (TISA) Formula. Retrieved from: https://www.tn.gov/education/best-for-
all/tnedufunding.html
Cohen-Vogel, L. A., & Cohen-Vogel, D. R. (2001). School Finance Reform in Tennessee:
Inching Toward Adequacy. Journal of Education Finance, 26(3), 297–317.
Chapter 2
Weighted-Student Funding and Equity:
Does Differentiated Funding Lead to More Equitable Outcomes?
Introduction
District-level budget models in the United States often do not adequately consider the diverse needs of students. These models typically involve centralized resource allocation, in which school districts exercise a large amount of control over individual school budgets (Chang, 2018; Stiefel, Rubenstein, & Berne, 1998). In centralized resource allocation, district central offices allocate resources to schools in the form of predetermined staff and dollars provided for particular purposes, and school principals have little to no input (Chang, 2018; Odden & Picus, 2019; Stiefel, Rubenstein, & Berne, 1998). Intra-district per pupil spending can vary widely, which has been associated with increased educational inequities for disadvantaged and historically underserved students, such as lower achievement scores for economically
disadvantaged and Limited English Proficient students (Houck, 2011; Iatorala & Stiefel, 2003;
Owens & Maiden, 1999).
Weighted student funding (WSF) has been adopted in several urban districts across the United States to help increase equity between and within schools as well as remedy some of the perceived issues associated with more centralized budgeting (Miles & Roza, 2006; Miles, Ware,
& Roza, 2003). WSF is a decentralized budgeting model that is designed to increase vertical equity. This approach takes into account the differential costs of educating different categories of
students and provides students with the highest need a larger share of resources (Ladd, 2008;
Chambers, Levin, & Shambaugh, 2010; Malen, Dayhoff, Egan, & Croninger, 2017). Weighted student groups often include economically disadvantaged students, English Language Learners, and students with disabilities (Miles & Roza, 2006). Ideally, weighted student funding should lead to more equitable outcomes for disadvantaged students by helping ensure they have the resources needed to be successful.
Heterogeneity in the design and implementation of WSF across urban districts
underscores the diverse approaches taken when tailoring the model to local needs, preferences, and contexts. Factors such as local political climates, socio-economic conditions, and the historical context of school funding in the district can all shape the specifics of WSF design and implementation (Miles & Roza, 2006). For instance, some districts might use WSF primarily to channel more funds to students with disabilities, while others might focus on economically disadvantaged students or English language learners (Edunomics Lab, 2020; Miles & Roza, 2006).
While there is substantial heterogeneity in how districts design and implement WSF (Edunomics Lab, 2020), this research can still provide useful insights into the utility and effectiveness of WSF, which can help other districts that are considering implementing a WSF model. Each WSF implementation, regardless of its design specifics, offers a unique case study on how resources can be allocated to address diverse student needs. Although the diverse nature of WSF implementations across districts can introduce complexities when evaluating its
overarching success, it also broadens the scope of insights available. By examining various WSF models, we can discern patterns of success and identify potential pitfalls in the quest for
achieving greater equity.
However, limited research exists regarding the extent to which weighted-student funding has achieved greater equity. Some studies have shown that WSF has led to improved resource equity in urban districts like Houston and Oakland, but other studies have shown limited effect on resource equity (Miles & Roza, 2006; Chambers et al., 2010; Baker, 2009). Similarly,
research on WSF’s effect on student outcomes is largely mixed or inconclusive (Hanushek, Link, and Woessmann, 2011; Derby & Roza, 2017; Stroub, 2018). While weighted-student funding holds promise for helping to solve some of the resource-driven inequities that plague many urban districts, the lack of evidence demonstrating this funding reforms efficacy in improving
outcomes-based equity and resource equity may contribute to districts hesitancy in adopting this funding approach. Likewise, if this funding approach does not achieve the aims of improving equity, then districts who already utilize WSF will benefit from greater evidence showing where WSF may fall short so they can adjust accordingly.
This study seeks to contribute to the existing literature and WSF policy landscape by examining the effects of weighted-student funding on resource and outcome-based equity in two urban Tennessee districts, Metro Nashville Public Schools (MNPS) and Shelby County Schools (SCS), relative to other districts in Tennessee that did not implement WSF. I use both a
descriptive and causal analysis to examine resource and outcomes-based equity. For the descriptive analysis, inter-district resource equity is measured using a method developed by Chingos and Blagg (2017), which computes funding progressivity for historically underserved subgroups of students, particularly economically disadvantaged students, English language learners, and students with disabilities. Progressivity of funding relates to the average funding for a higher need student subgroup (i.e., students with disabilities) relative to the average funding for students not in that subgroup (i.e, students without disabilities). For example, funding would be
considered progressive if the average student with a disability attends schools that are better funded than schools the average students without disabilities attends (Chingos & Blagg, 2017).
The causal analysis uses an augmented synthetic control method to examine the causal effect of WSF on outcomes-based equity (achievement scores and graduation rates) over time in MNPS and SCS. The synthetic control method creates one weighted, average comparison group (synthetic control) for all other districts in the state, which closely approximates the treated groups’ pre-treatment outcomes and covariates (Ben-Michael, Feller, & Rothstein, 2021). The augmented synthetic control method (ASCM) enhances the SCM approach by calculating a de- biased synthetic control mean for every outcome of interest in non-WSF districts, by adding a bias correction term.
This study will answer the following research questions:
1. Intra-District Resource Equity. Within WSF districts, how progressive is per pupil spending among schools? The student subgroups on whom I will assess progressivity include economically disadvantaged students, students with disabilities, and English language learners.
2. Inter-District Resource Equity. How progressive is per pupil spending among WSF districts in comparison to similar non-WSF districts in Tennessee?
3. Outcomes-Based Equity. What is the relationship between weighted-student funding and student outcomes, specifically graduation rates and test score proficiency rates?
For research question 1, I use NERD$ school-level finance data to examine whether disadvantaged sub-groups on average attend better funded schools than their non-disadvantaged comparison groups withing MNPS and SCS. This research question examines resource equity
within districts and provides evidence for whether WSF has increased intra-district resource equity.
For research question 2, I use NERD$ school-level finance data to compare WSF districts in Tennessee to five similar non-WSF districts in Tennessee. This research question examines resource equity between districts and provides evidence for whether WSF has increased inter- district resource equity. If WSF is working as designed, I expect that WSF districts will have more progressive funding than non-WSF districts. Due to only have four years of school-level fiscal data available, I am unable to conduct a causal analysis. However, a descriptive analysis will still provide useful information to district leaders and policymakers into whether WSF is generally performing as designed in regard to increasing resource equity. If not, the findings can provide support for further research into student weights and whether revisions to the funding formula would be warranted.
For research question 3, I use the augmented synthetic control method to examine the change in outcomes of the treated WSF districts compared to the change in outcomes of the weighted comparison group over time, similar to a difference-in-differences design. However, unlike the difference-in-differences model, weights are systematically assigned to the
comparison group to create a better counterfactual comparison group (Abadie, Diamond, &
Hainmueller, 2010).
Ultimately, this study seeks to examine whether providing differential funding based on student characteristics has led to the desired result of improved resource equity and more
equitable student outcomes for underserved student subgroups. This study finds that within WSF districts, MNPS and SCS show progressive per pupil spending for economically disadvantaged students and students with disabilities, especially at the elementary level. However, ELL students
in both districts experience regressive spending trends. Comparatively, Knox County stands out for its progressive spending across all student subgroups among the non-WSF districts, while SCS ranks among the least progressive. In terms of the impact of WSF on student outcomes in MNPS and SCS compared to the five non-WSF comparison districts, no significant or consistent effects were observed. The relationship between WSF and student outcomes remains
inconclusive in this study.
Weighted Student Funding Background
Weighted Student Funding (WSF) originated in the 1950s as a strategy to ensure equitable state aid distribution across public districts, adjusting funds based on unique student needs. Over the decades, WSF evolved to also address intra-district disparities, especially in urban areas with diverse student populations. However, despite its intentions, the implementation of WSF varies significantly across districts, leading to disparities in achieving equitable
educational outcomes. While some studies suggest WSF leads to greater resource equity within districts, the overall research on its effectiveness remains inconclusive, emphasizing the need for further examination in diverse contexts.
Origin and Development of Weighted Student Funding
Weighted Student Funding (WSF) began in the 1950s as a method to allocate state aid to public school districts. Over time, its focus shifted to how these districts distribute funds to the individual public schools within their jurisdiction. This shift highlighted the disparities in resource availability, particularly in urban districts with high concentrations of diverse learners, necessitating a more equitable distribution of funds.
Weighted Student Funding (WSF) began in the 1950s as a means to promote equitable allocation of state aid and resources across local public districts. WSF was originally developed
to address the diverse needs across public school districts (Baker, 2009). WSF’s approach involves allocating funds based on student characteristics to ensure each student’s needs are met (Baker, 2009; Miles & Roza, 2006; Rubenstein, Schwartz, Stiefel, & Amor, 2007). This funding strategy seeks to address the range of educational needs within diverse student populations, with the underlying principle of attributing more weight to students who need more resources, ideally resulting in a more equitable distribution of resources (Ladd, 2008; Chambers, Levin, &
Shambaugh, 2010; Miles & Roza, 2006).
In recent decades, WSF has evolved to address not only disparities between districts but also those within, prompting a shift in focus to district-level allocation to further the goal of equity (Baker, 2009; Miles & Roza, 2006; Rubenstein, Schwartz, Stiefel, & Amor, 2007; Berne
& Stiefel, 1994). Urban districts, characterized by their often diverse student population with a wide range of educational needs, became the focus of WSF discussions (Miles & Roza, 2006;
Stiefel, Rubenstein, & Berne, 1998). By acknowledging the differing costs associated with educating a variety of student demographics in urban settings, WSF played an important role in promoting equitable resource allocation strategies (Ladd, 2008; Chambers et al., 2010).
The emergence and refinement of WSF as a district-level allocation model represents a proactive approach to addressing multifaceted educational disparities, both between and within districts. It seeks to align financial resources with the needs of diverse student populations, in order to provide enhanced equity and inclusivity in educational settings (Baker, 2009; Miles &
Roza, 2006). The focus on resolving disparities within urban districts signifies WSF’s potential in transforming urban educational settings, marked by their pronounced diversity and inherent challenges (Miles & Roza, 2006; Stiefel et al.,1998). However, in order to better understand how
WSF promotes equity, it is important to explore the methodologies and strategies employed to actualize the equitable distribution principles inherent in WSF.
Implementation and Allocation Method of WSF
Within WSF districts, weighted formulas determine the allocation of funds and provide schools with allocations reflective of their specific student characteristics. This funding model often provides principals enhanced autonomy, allowing them to tailor resources more accurately to the unique needs of their schools, promoting greater intra-district equity.
In district-level weighted student funding, the district determines the funding formula.
The formula typically includes a base weight for all students and student need weights for students with higher educational needs. Higher weighted categories commonly include English language learners, economically disadvantaged students, and special education students (Miles &
Roza, 2006). Schools then receive a dollar allocation based on their school enrollment number and the district’s WSF formula (Chang, 2018).
After districts allocate additional resources based on student needs, principals are often given greater budgetary flexibility to use those resources to meet the needs of their students.
WSF operates under the assumption that principals and site-based planning teams have greater knowledge and understanding about the needs of students within their school (Hanushek, Link, and Woessmann, 2011). Ideally, this needs-based aid distribution to schools and school-level resource allocation by principals can help resolve some of the significant within district inequities that often exists between schools in a district (Baker, 2009; Miles, Ware, & Roza, 2003).
The increased autonomy entrusted to principals, based on their understanding of the unique needs within their schools, serves as a pivotal mechanism for operationalizing the ideals
of WSF and bridging the gaps between allocating resources and addressing actual student needs (Hanushek, Link, & Woessmann, 2011; Baker, 2009). While increased autonomy is often tied with WSF, we do not observe the extent to which principals have autonomy in this paper. As the next section explores equity and outcomes intrinsic to WSF models, the emphasis will be on exploring the implications of WSF, combined with principal budgetary flexibility, in various urban districts.
Examining Equity and Outcomes in WSF Districts
WSF aims to achieve vertical equity, prioritizing outcomes-based equity by adjusting resources based on distinct student needs. However, the implementation of WSF models varies significantly across districts, creating disparities in the pursuit of equitable educational outcomes and making the evaluation of its overall efficacy challenging.
Weighted student funding within schools represents vertical equity in which students with higher needs receive higher funding weights than students with lower needs. WSF is designed to increase equity through distribution of resources to schools based on student needs.
Consequently, weighted student-funding focuses more on outcomes-based equity (Ladd, 2008).
Equity in terms of equality of outcomes requires that all schools have adequate resources to accomplish similar educational outcomes for students (Berne & Stiefel, 1984; Berne & Stiefel, 1994; Ladd, 2008; Houck, 2011). If the student weights correctly account for the differential costs of educating different categories of students, then weighted student funding should increase equality of outcomes (Ladd, 2008).
However, substantial variation exists in how districts design their WSF model and weights chosen for students. Some districts, such as Prince George’s County, distribute less than a quarter of their total budget through their WSF formula. While other districts, such as Orleans
Parish, deploy almost 90 percent of their total budget through their WSF formula (Edunomics, 2020). Most WSF districts, including MNPS and SCS, distribute between 30 and 50 percent of their funds via their WSF formula, with non-formula allocations ranging from central office related supports to allocations for exempted programs or schools (Edunomics, 2020).
Additionally, base weights and student demographic weights vary widely across districts. Grade level weights are the most common weighted category, but variation exists regarding which grade level should receive the highest weight. Similarly, the majority of districts also include a weight for English Language Learners, but weights range from 10 percent to 70 percent (Edunomics, 2020).
Not surprising, given the significant variation in WSF models, limited research exists regarding the extent to which weighted student funding has achieved greater equity, especially for students with higher needs who ideally should benefit more from this funding approach compared to more traditional budgeting approaches (Baker, 2009). At a minimum, several studies have found that weighted student funding does lead to greater resource equity within districts.
Some researchers have found that WSF has led to greater resource equity within districts.
In the Houston Independent School district and Cincinnati Public Schools, Miles and Roza (2006) found that weighted student funding increased resource equity among schools within each district, with more schools in both districts receiving allocations closer to the weighted average expenditure in the district after previously having significant spending disparities. In San Francisco and Oakland, Chambers et al. (2010) found that after implementation of weighted student funding, per pupil spending became more responsive to student poverty at certain schooling levels.
However, the degree to which WSF improved equity varies across studies. In part due to the varying share of funds that go through the WSF formula (Roza & Hill, 2004). In a
comparison of Houston Independent School District and Cincinnati Public Schools to other urban districts in Texas and Ohio, Baker (2009) found that, regardless of whether a district used a student weighting formula, districts were able to focus resources on higher-need schools. His findings suggest that weighted student funding may not be a necessary precursor to equitable need-based resource distribution at the district level.
Similar to research linking weighted student funding to more equitable resource distribution, research linking weighted student funding to more equitable student outcomes is limited and inconclusive. On a broader level, research has shown that decentralizing decision- making and providing principals with more autonomy to make budgeting allocation decisions, like in the weighted student funding process, can positively benefit students and positively effect student outcomes (Hanushek, Link, & Woessmann, 2011). Derby and Roza (2017) found that in California student achievement scores on state assessments seemed to improve after the
introduction of weighted student funding, but the improvements coincided with a new testing system adopted by California during the same period, so the link between weighted student funding and student achievement was less clear. In Edmonton, Seattle, and Houston, who each used a decentralized form of funding in which principals made resource allocation decisions, Ouchi (2006) found that decentralized districts had better overall student achievement and more effectively reduced achievement gaps compared to centralized districts where funding was more directly controlled at the district level. However, Stroub (2018) found no relationship between student achievement and narrowing of achievement gaps with decentralization in Houston Independent School district.
Prior studies have also examined the relationship between WSF and improved outcomes for underserved and disadvantaged subgroups. Derby and Roza (2017) did not find evidence that weighted student funding significantly decreased achievement gaps, but they did find evidence of improved test scores for socioeconomically disadvantaged students after implementation of weighted student funding. Stroub (2018) also did not find evidence that decentralization narrowed the racial or socioeconomic achievement gap in Houston. Additionally, there was no significant effect of decentralization by grade level or school size.
The broad spectrum of WSF models and weights applied across districts reflect different strategies to address localized needs and priorities (Edunomics, 2020). The existing research, while providing some insights into the potential benefits of WSF in terms of resource allocation and student outcomes, remains inconclusive and points towards the need for a more
comprehensive understanding of WSF’s impact on equity (Derby & Roza, 2017; Stroub, 2018).
The studies suggest that WSF, albeit promising, is not a panacea and needs to be contextualized within broader educational frameworks to effectively address the persistent inequalities in education (Baker, 2009; Ouchi, 2006). Subsequent sections seek to contribute to this growing body of literature by examining resource equity and outcomes-based equity in two urban districts in Tennessee that have adopted a WSF funding model.
Study Context
The history of education in Tennessee and within Tennessee school districts is marked by ongoing efforts to establish and refine an equitable and adequate funding system using various strategies and formulas to address the diverse needs of students. The challenges of local disparities and differing needs across urban, suburban, and rural districts continue to shape discussions and reforms in education funding policy at the state and district level.
In the last few decades, Tennessee has undergone significant educational reforms, focused on improving education quality, access, and funding. Tennessee introduced the Basic Education Program (BEP) in 1992 as a new formula to fund K-12 education. The BEP was designed to equalize education funding across districts and ensure adequate funding for every student in the state. The program calculates the cost of providing basic education and divides it between the state and local governments, considering factors like local fiscal capacity (Meyers, Valesky, & Hirth, 1995; GoldBaher & Callahan, 2001; Krause, 2010; Cohen-Vogel & Cohen- Vogel, 2001). The BEP was revised to BEP 2.0 in 2007, intending to better address the needs of schools and students. The revision aimed to refine the funding formula to more accurately reflect the actual cost of educating a student, taking into account various factors, including the number of students and the diverse needs of those students (Krause; 2010).
In recent years, discussions and reforms have continued around education and school district funding in Tennessee. The state has made efforts to increase investments in education, focus on improving outcomes, and ensure equitable distribution of resources across diverse and differently-sized school districts (GoldBaher & Callahan, 2001; Cohen-Vogel & Cohen-Vogel, 2001). The state continues to explore various funding strategies, such as the Tennessee
Investment in Students Act (TISA), to address the specific needs of different student populations efficiently (Hahnel, Marchitello, & Ali, 2023;).
Despite state efforts, disparities still exist between wealthy and less affluent districts due to the significant role local funding plays in school finances. Wealthier districts with a higher property tax base can contribute more local funds to their schools, often leading to disparities in resources and opportunities for students (GoldBaher & Callahan, 2001; Cohen-Vogel & Cohen- Vogel, 2001; Klein, 2008). To address these disparities and better address student needs, districts
have implemented more tailored resource allocation strategies, such as weighted-student funding (Jarmolowski, Aldeman, & Roza, 2022; Chang, 2018; Roza, Hagan, & Anderson, 2021).
Metropolitan Nasville Public Schools (MNPS), the second largest district in Tennessee, implemented WSF district-wide in the 2015-16 school year after a two-year pilot program that provided principals with greater budgetary flexibility but not additional weighted funds. WSF gave principals decision-making power over approximately 50% of the district’s budget (MNPS, 2023). The goal of WSF in MNPS was to equitably distribute resources to better align with the diverse needs of its students, enable innovative resource allocation decision-making, encourage accountability, increase resource equity, promote school funding transparency, and align central office services to the needs of schools (MNPS, 2015). In school year 2015-16, as seen in Table 2-1, MNPS included a base weight of $4,250 for students as well as included weights for grade level, prior academic performance or poverty weight, ELL status, and special education. MNPS has continued to refine their base allocation and weights over recent school years.
Shelby County Schools (SCS), the largest district in Tennessee, adopted a weighted- student funding approach in the 2018-19 school year. In its first year, SCS allocated
approximately 38% of its roughly $1 billion dollar budget to WSF to address individual needs of students more effectively, particularly those facing learning challenges (Kebede, 2020).
Memphis adopted this funding approach with the intention of empowering school leaders to make budgetary decisions that align with the unique needs of their student population, fostering equity and ensuring all students have access to necessary resources (SCS, 2019). In its initial year, as seen in Figure 2-1, students had a base allocation of $3,400 with additional weights provided for grade level, student performance, mobility and special education. Mobility was used as a more nuanced proxy for poverty to provide a better indication of student need. In 2019-20,
SCS also added a .03 weight for ELL to offset potential inadequacies in the poverty
measurement (SCS, 2019). Much like MNPS, the district has continued to refine their weights and base allocation amount each school year.
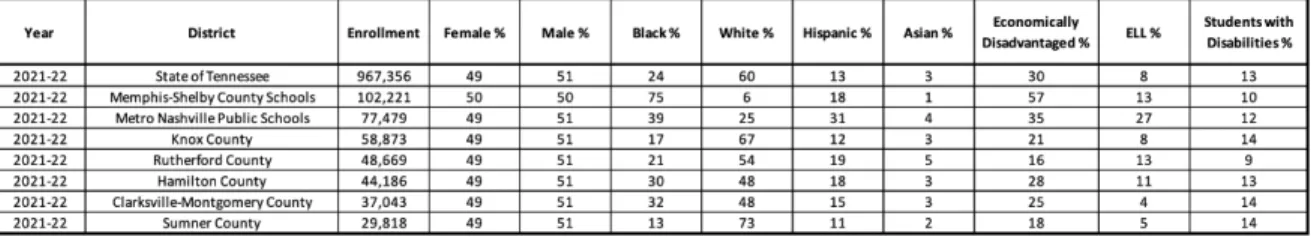
For this study, MNPS and SCS are compared to five other districts in Tennessee. These five comparison districts were selected based on size and demographic composition of students.
The five selected comparison districts were among the largest and more demographically similar non-WSF districts in Tennessee. The comparison districts include Knox County, Rutherford County, Hamilton County, Clarksville-Montgomery County, and Sumner County.1 As shown in Table 2-2, while SCS and MNPS range in size from approximately 102,000 to approximately 77,000, respectively, the comparison districts range in size from approximately 30,000 (Sumner) to approximately 59,000 (Knox). MNPS and SCS also have a large percentage of Black,
Hispanic, and economically disadvantaged student compared to the non-WSF districts. However, Nashville and Memphis are significantly larger, both with a population of more than 600,000, compared the next largest city in the state, Knoxville with a population of less than 200,000.
However, districts in the same state were chosen to offer a more consistent environment for analysis by mitigating the potential effects of state laws and policies as well as other contextual differences or confounding variables that could result from comparison districts in different geographic regions.
1 Williamson County serves more students than Clarksville-Montgomery County and Sumner County. However, only approximately 3 percent of Williamson County’s student population is economically disadvantaged, while the other comparison districts had at least 15 percent economically disadvantaged students. Given that this is one of the commonly weighted categories and a primary subgroup of interest in this paper, Williamson County was excluded
Methodology Data
To assess resource equity in research questions 1 and 2, the study uses Tennessee school-level fiscal data from NERD$ data archive and administrative school characteristic data from Tennessee Department of Education (TDOE) in fiscal years 2019-2022. To assess outcomes- based equity in research question 3, the study uses school-level school characteristic and outcome data from TDOE in fiscal years 2012-2022 and school characteristic data from Common Core of Data (CCD) Public school data.
For research questions 1 and 2, the analysis uses spending data from the NERD$ data archive for Tennessee in fiscal years 2019-2022 and publicly available Tennessee Department of Education (TDOE) administrative data. The NERD$ dataset provides school-level funding data which enables a descriptive analysis of WSF and resource equity within MNPS and SCS
compared to the five largest and most demographically similar non-WSF districts in Tennessee, which, as discussed previously, include Knox County, Rutherford County, Hamilton County, Clarksville-Montgomery County, and Sumner County. The analysis uses the state and local per pupil total expenditure variable in the NERD$ dataset. The fiscal data is merged with
administrative data provided by the TDOE for years 2019-2022. The administrative dataset includes school-level and district-level data on all public schools in Tennessee. The analysis for research questions 1 and 2 uses school-level demographic information, including number of economically disadvantaged students, number of students with disabilities, and number of English Language Learners.
For research question 3, the analysis uses publicly available TDOE administrative data and publicly available National Center for Education Statistics (NCES) Common Core of Data
(CCD) Public school data. The TDOE data includes school-level demographic characteristics (e.g. percent male or female; percent ELL; percent free and reduced-price lunch eligible; percent students with disabilities), high school graduation rates, and achievement rates, specifically percent proficient or advanced, for end-of-grade tests in grades 3-8 from fiscal years 2012-2022.
Of note, achievement test data is not available in fiscal year 2016 and 2020, due to testing complications in 2016 and pandemic-related complications in 2020. As a result, other student outcome data in the form of high school graduation rates is incorporated. Graduation rates are used because they reflect academic achievement and student success in achieving academic prerequisites. Improving graduation rates can indicate an environment that is more effectively using resources to meet the educational needs of students.
The analysis examines these outcomes for economically disadvantaged students, students with disabilities, and ELL students, when possible. For ELL students, the analysis will begin in fiscal year 2013 because they were not defined as a subgroup in publicly available TDOE data prior to that year. The CCD data includes additional school-characteristic data, such as indicators for charter schools, magnet schools, grade levels, locale, and type of schools. The analysis excludes charter schools and alternative schools, and the sample is limited to only schools that were present in all analysis years.
Analytic Plan
This section discusses the analytic plan to assess resource equity and outcomes-based equity in MNPS and SCS after weighted-student funding implementation. To explore intra- district resource equity in SCS and MNPS, an exposure-based progressivity measure is used to examine whether disadvantaged subgroups (i.e., economically disadvantaged students, English Language Learners, and students with disabilities) attend schools with higher or lower per pupil
expenditures, on average, relative to their non-disadvantaged peers. To explore inter-district resource equity, the progressivity measure is used to compare spending patterns between WSF districts and similar non-WSF districts in Tennessee, highlighting disparities or similarities across different districts. To explore outcomes-based equity, the Ridge Augmented Synthetic Control Method (ASCM) is used to evaluate the impact of WSF on student outcomes in MNPS and SCS, comparing schools in these WSF districts with a de-biased synthetic control mean of schools in the five non-WSF comparison districts.
Examining Resource Equity through Progressivity
The exposure-based and slope-based progressivity measures I use provide a means for evaluating school-level finance data and contrasting funding allocations between weighted and non-weighted student subgroups between and within districts (Chingos and Blagg, 2017, Jang &
DiSalvo, 2023). These measures highlight the association between WSF and funding equity for historically disadvantaged student subgroups in comparison to their non-disadvantaged
counterparts, offering insights into the practical efficacy of WSF in improving intra-district and inter-district resource equity.
Exposure-based progressivity measures the difference in school spending between the average disadvantaged and non-disadvantaged student’s school (Jang & DiSalvo, 2022). Slope- based progressivity measures how much more disadvantaged student subgroups receive as their proportion within schools increases and involves quantifying the linear relationship between per pupil expenditures and the proportion of disadvantaged student subgroups in schools. While the exposure-based measure examines the average spending experienced by different subgroups, the slope-based measure assesses the relationship between per pupil spending and the proportion of
specific subgroups. By including both, I seek to provide a more holistic picture of funding progressivity.
I use these progressivity measures to assess resource equity within MNPS and SCS as well as resource equity across WSF and non-WSF districts. The progressivity measures for each district quantify the difference between school spending for economically disadvantaged and non-economically disadvantaged students; students with disabilities and students without
disabilities; and ELL students and non-ELL students. The measures indicate whether students in the disadvantaged subgroups tend to be enrolled in schools with more, or less, expenditures compared to their non-disadvantaged comparison group (Chingos & Blagg, 2017). The Chingos and Blagg (2017) approach provides a direct comparison of funding between disadvantaged relative to non-disadvantaged subgroups, which adheres to how WSF is designed. A positive difference suggests the distribution of school funding is progressive.
Examining school-level finance data allows for the exploration of how WSF influences intra-district resource equity, a task that, until recently, has been challenging due to the lack of available school-level finance data. Before the availability of school-level finance data, one could only assess inter-district equity at the state level, which masks any variation in funding equity across schools within districts. In this paper, I calculate funding progressivity at the district-level, leveraging variation across schools, by school tier—elementary, middle, and high school—and overall by district in order to capture variations between schools that might be masked by only examining the state-level progressivity.
Under WSF, disadvantaged students should receive a higher share of resources than non- disadvantaged students, but this may not always translate in practice. Disadvantaged students may on average attend a school where there is overall a lower per pupil spending level relative to
schools the average non-disadvantaged student attends. While WSF may make a district more progressive overall relative to non-WSF districts, the district may still be underspending for its most disadvantaged schools relative to non-disadvantaged schools. Additionally, since principals may look at their overall school funding and allocate it more holistically to meet student need, exploring whether disadvantaged students tend to attend better resourced schools in comparison to non-disadvantaged students is an important equity consideration.
Intra-District Resource Equity
Research Question 1: Within WSF districts, how progressive is per pupil spending among schools? The student subgroups on whom I will assess progressivity include economically disadvantaged students, students with disabilities, and English language learners.
Research question 1 descriptively explores how progressive per pupil spending is within SCS and MNPS separately by using the slope-based and exposure-based progressivity measures discussed above. These measures are used to examine equity and spending patterns between weighted student subgroups and students who are not part of the subgroup.
For the slope-based metric, I use the state and local per pupil expenditure variable from the NERD$ dataset to conduct a simple linear regression analysis that describes the correlation between per pupil spending and the proportion of three weighted-student funding groups:
economically disadvantaged students, English language learners, and students with disabilities.
The objective is to determine if there is a higher allocation of funding to schools with a greater representation of economically disadvantaged, ELL, or students with disabilities. I calculate this relationship individually for each fiscal year from 2019 to 2022.
Similarly, for each district, the exposure-based equity metric uses the state and local per pupil expenditure variable to calculate a weighted average of each school’s per pupil spending,
with weights determined by number of economically disadvantaged students, number of students with disabilities, and number of English Language Learners. The analysis then calculates a similar weighted average of each school’s per pupil spending with weights determined by number of non-economically disadvantaged students, number of students without disabilities, and number of students who are not English Language Learners (ELL). A positive spending difference indicates that the spending is progressive (e.g., ELL students attend schools with higher per pupil spending, on average, than non-ELL students). The progressivity measure is calculated at the tier level and overall by district for each year of analysis, fiscal years 2019 to 2022.
1
𝑁!"#$%&'( #(𝑅𝑒𝑣𝑃𝑢𝑝𝑖𝑙) ⋅ 𝑁)&'()
*
)'(
− 1
𝑁!"#$%&'+ #(𝑅𝑒𝑣𝑃𝑢𝑝𝑖𝑙) ⋅ 𝑁)&'+).
*
)'(
(1)
Equation (1) represents the formula used for exposure-based progressivity. In equation (1), 𝑅𝑒𝑣𝑃𝑢𝑝𝑖𝑙) is per pupil revenue at school 𝑠; 𝑁)&'( and 𝑁)&'+ are the proportions of students in group 1 (e.g., ELL students) and group 0 (e.g., non-ELL students) in school 𝑠; and 𝑁!"#$%&'( and 𝑁!"#$%&'+ are the total number of students in group 1 and group 0 in the district.
Inter-District Resource Equity
How progressive is per pupil spending among WSF districts in comparison to similar non-WSF districts in Tennessee?
For research question 2, the exposure-based progressivity measure is used to examine spending progressivity in SCS and MNPS compared to similar non-WSF schools. Following the analysis exploring intra-district equity, spending progressivity is calculated for ELL students, economically disadvantaged students, and students with disabilities across schools in MNPS, SCS, Knox County, Rutherford County, Hamilton County, Montgomery County, and Sumner
County using state and local per pupil expenditures. Like research question 1, the progressivity measure is calculated at the tier level and overall, by district for each year of analysis, fiscal years 2019 to 2022. Per pupil progressivity differences are compared across districts for each fiscal year. Per pupil progressivity is plotted using a line for each district across all fiscal years.
Examining Outcomes-Based Equity through ASCM
Research Question 3: What is the relationship between weighted-student funding and student outcomes?
The Augmented Synthetic Control Method (ASCM) provides a more refined comparison of WSF and non-WSF districts by computing a de-biased synthetic contro