The crystallization temperature of the GCAW was found to increase upon addition of Co and Ni. Additions of Co and Ni to the FeSiB composition reduced the relative heat capacity of the GCAW.
INTRODUCTION 1
LITERATURE SURVEY 3
- Differential Scanning Calorimetry 3
- Modulated ® Differential Scanning Calorimetry 4
- Thermogravimetric Analysis 7
- Glass – Covered Amorphous Metal Wire 8
The glass transition of the other glasses was only detected by MDSC® and could be clearly seen on the inverse heat flow curve as a drop in heat flow. Since the weight of the sample changes with temperature, an electric current is used to maintain equilibrium, which is directly proportional to the change in weight of the material.
EXPERIMENTAL PROCEDURE 12
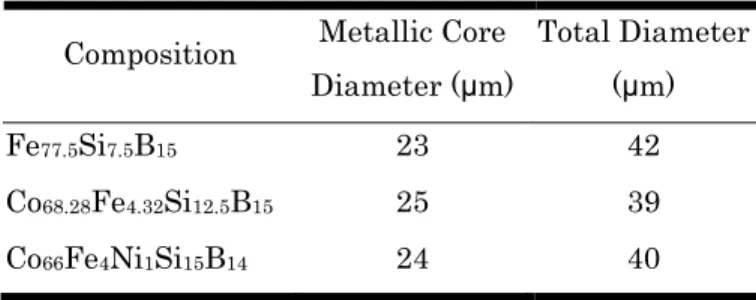
- Sample Compositions 12
- Differential Scanning Calorimetry 12
- Modulated ® Differential Scanning Calorimetry 15
- Thermogravimetric Analysis 16
- MDSC ® OF GCAW AND AMORPHOUS RIBBON 17
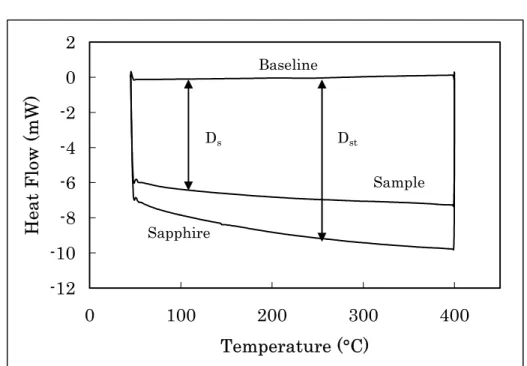
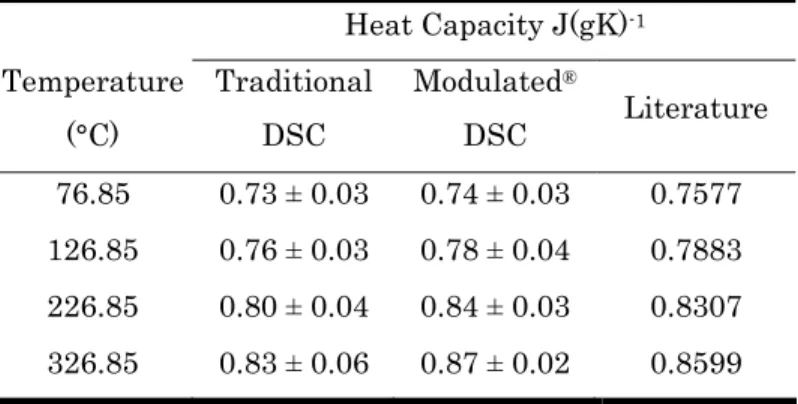
The procedure outlined in ASTM E 1269 – 99 was used to generate the three DSC curves needed to calculate the heat capacity, which included a baseline (empty sample container), a standard (sapphire), and finally the sample.18 The samples were heated. from room temperature to 400°C at 20 K/min with a five-minute hold at both the beginning and end of the heating cycle to allow the system to equilibrate. Using the known heat capacity values of sapphire, also given in the ASTM standard, which have an associated error of 0.05% in the range 150 – 900 K, the cell constant (E) was calculated for each temperature using the following formula:34. Modulated Differential Scanning Calorimetry (MDSC®) was used to determine the glass transition temperatures and heat capacities of all three wire and amorphous tape compositions.
A sapphire standard was used to calibrate the heat capacity constant of the instrument, and indium, tin, and zinc metal standards were used to calibrate the temperature. Depending on the objective of the experiment, a heating rate of 1 K/min, 3 K/min or 5 K/min was used. Although no standard is required for Modulated® DSC heat capacity measurements, a silicon standard was used as a reference throughout the study.
At 60 °C, a magnet provided by TA Instruments was placed under the TGA oven until the end of the thermal cycle so that the magnetic behavior could be observed. A nitrogen flow rate of 60 mL/min was used to purge the sample chamber, while 40 mL/min was used to purge the balance.
Experimental Procedure 17
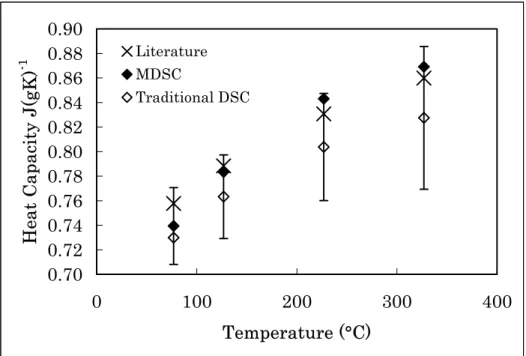
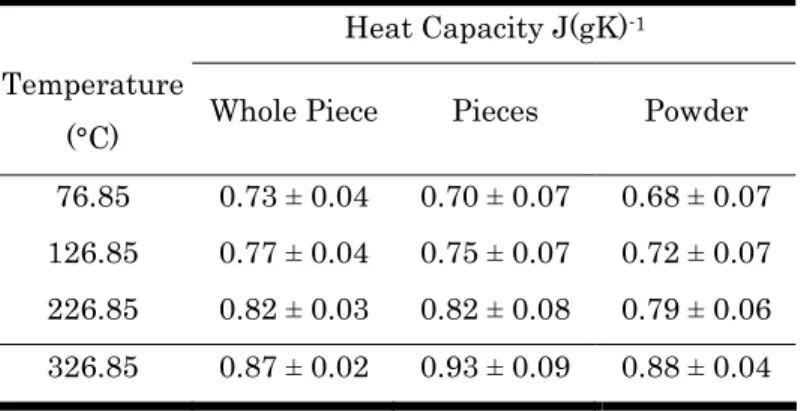
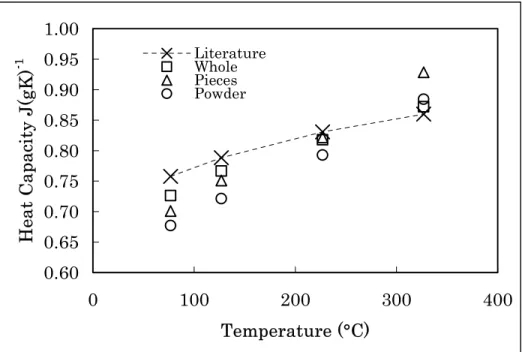
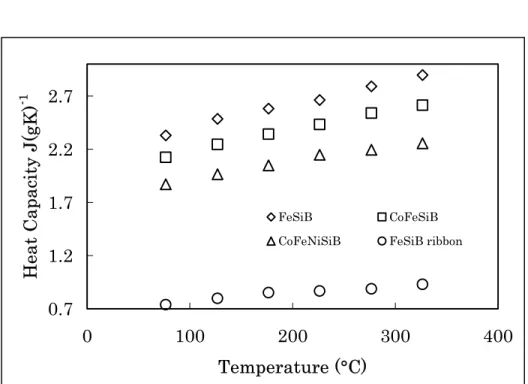
The heat capacities of the silicon were also determined after changing the sample contact with the pan using the “standard”. During the course of the study it was noted that there was significant variation in the heat capacities of the FeSiB wire as the amount of wire increased. The traditional DSC heat capacity results of the amorphous FeSiB ribbon are compared to the MDSC® heat capacities of the GCAW in Figure 8.
Glass removal further increased the heat capacity of all three wires, which can be seen in Figure 9. Comparison of the MDSC® heat capacity curves of FeSiB wire with the MDSC® heat capacity curves of the silicon standard. MDSC® relative heat capacity of the GCAW compared to the traditional heat capacity of the amorphous ribbon.
Comparison of the MDSC® heat capacities of the CoFeSiB GCAW with the glass cladding on and off. A spread in the heat capacities of the different FeSiB wire sections' heat capacities was observed which may be due to structural differences along the length of wire. The measured heat capacities of all three wires exceeded the 3R maximum, while the heat capacity of the FeSiB amorphous ribbon remained well below this limit throughout the entire temperature range.
The heat capacities of glass fibers decreased (<3R) when ground to powder.
Results and Discussion 19
Conclusions 28
THERMAL ANALYSIS OF GCAW AND AMORPHOUS RIBBON 29
Experimental Procedure 29
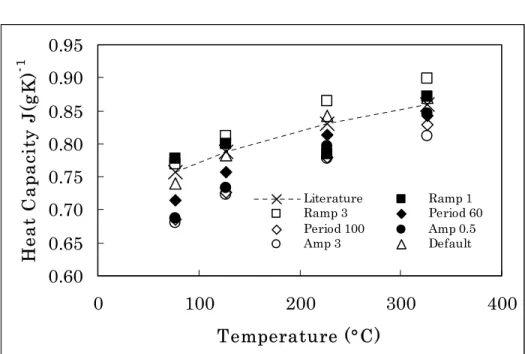
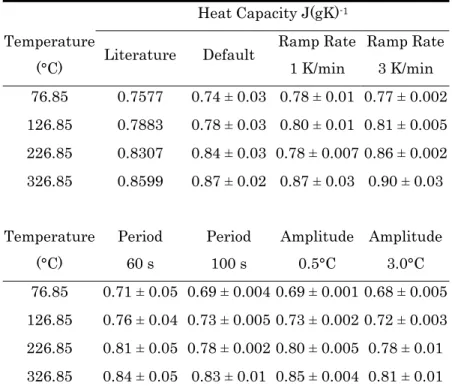
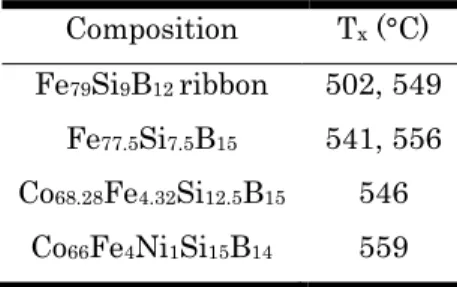
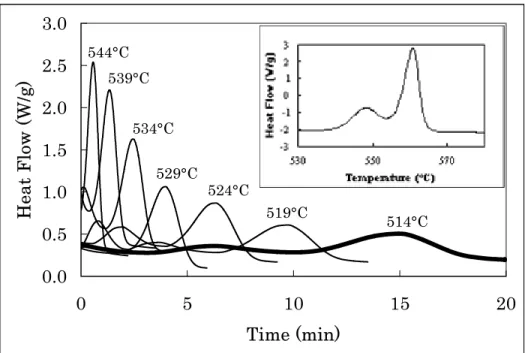
The addition of Co and Ni increases the onset of crystallization by about 20 °C above that of GCAW FeSiB. An interesting aspect of the DSC curve for the FeSiB strip is that the Curie temperature is detectable (Figure 12). The influence of experimental parameters (heating rate, period and amplitude) on the thermal capacity of the same FeSiB sample was also investigated with MDSC®.
The effect of removing glass cladding on the heat capacity of the wires was also investigated. A comparison of the Curie transitions for each of the glass-covered amorphous metal wires can be seen in Figure 14. Comparison of the TGA curves for the amorphous FeSiB band and GCAW with the indicated Curie temperatures.
Differences in the contribution of the electronic heat capacity correspond to the reduced relative heat. The Curie temperature of the crystalline alloy is slightly higher than the amorphous metal due to a higher exchange energy.
Results and Discussion 30
Differential Scanning Calorimetry 30
Modulated® DSC was used to determine the heat capacities for CoFeSiB and CoFeNiSiB wire, as it has been shown to be an accurate and efficient method for determining the heat capacities of amorphous wires. It is obvious that by adding Co and Ni to FeSiB, the heat capacity decreases, which may be due to the effect of the electronic heat capacity on the total heat. It is likely that differences in the electronic heat capacity of GCAW are due to differences in density, which would affect the number of free electrons per unit volume.
Interestingly, when comparing the heat capacity of the FeSiB ribbon with the wire, the values appear abnormally high for all three wires, as shown in Figure 8. Investigating this phenomenon revealed that it was a function of the aspect ratio of the wire. During this study, an interesting phenomenon was encountered, which related to the heat capacity as a function of the location of the wire on the coil.
The contact of the silicon standard with the sample pan was manipulated in different heat cycles and there was no substantial difference in heat capacity. Pyrex® has a specific heat capacity approximately twice that of a metal alloy, so it would be expected that there would be a decrease in the heat capacity of the GCAW when the glass was removed.41 A decrease in fiber diameter was however, it has previously been shown to increase the measured heat capacity and it is likely that the further increase in the heat capacity of the GCAW is due to this effect.
Thermogravimetric Analysis 37
The Curie temperature of the FeSiB ribbon (389°C) is somewhat lower than that of the wire, and as seen in Figure 12, it is consistent with the Curie temperature found by DSC. However, the composition of the FeSiB amorphous ribbon was just outside the range studied and a comparison could not be made. When the FeSiB ribbon was crystallized at 500°C (first crystallization peak), the Curie temperature of the metal shifted to 413°C, about 20°C higher than for the amorphous metal as seen in Figure 15.
In general, the exchange energy in amorphous materials is weaker than in the corresponding crystalline structure, so both the Curie temperature and saturation magnetization will be lower.46 As the ribbon was heated to 800°C, the wire went through the first Curie transition. and at the onset of the α – (Fe, Si) crystallization there was a slight increase (~110 weight %) in the saturation magnetization. TGA curve of the FeSiB ribbon past the crystallization temperature indicating the onset crystallization temperatures of α-Fe and Fe3B. When heated beyond the Néel temperature, there is enough energy in the system to induce random magnetic moments and become paramagnetic.
The presence of the glass coating seems to reduce the magnetic behavior detected by the DSC and TGA and increases the heat capacity of the wire, but it has no influence on the crystallization. A spread in the heat capacities measured by traditional DSC was observed, while there was little variation in the MDSC® heat capacities of the same FeSiB GCAW sample. There was evidence of the Curie temperature in the FeSiB amorphous ribbon DSC curve, while it was absent in the thermal curves of all three GCAW.
To determine the effect of removal method on GCAW properties, the glass should be removed with an acid etch and the properties should be measured again, especially the heat capacity.
Conclusions 42
CONCLUSIONS 44
The addition of Co and Ni to FeSiB wire strongly affects properties such as crystallization temperature, heat capacity, Curie. Amorphous ribbon has slightly lower crystallization temperatures than FeSiB wire, which may be due to differences in composition, surface crystallization, or the presence of nuclei in the ribbon. Due to the slightly different composition, the Curie temperature is lower in the strip than in the wire.
The GCAW exhibit an abnormally high heat capacity, which is due to the aspect ratio of the wire, but is otherwise unexplained. The same behavior was observed for typical borosilicate glass fibers, indicating that an anomaly exists in the measurement of the heat capacity of fibrous materials. As Co and Ni are added to the amorphous alloy, the crystallization temperature is increased from 541°C for the FeSiB wire to 559°C for the CoFeNiSiB GCAW.
The Curie temperature, however, was found in the FeSiB wire after removal of the glass, implying that the glass coating acts as a barrier to the detection of the Curie temperature. Therefore, the exchange energies are less in the CoFeSiB and CoFeNiSiB compounds, since the Curie transition occurs at a lower temperature.
FUTURE WORK 47
Masumoto, “Production of Amorphous Co-Si-B and Co-M-Si-B (M=Group IV - VIII Transition Metal) Wires by a Method Using Melt Spinning in Spinning Water and Some Properties of the Wires,” Mater. Lu, “Separating glass transition and crystallization in metallic glasses by temperature-modulated differential scanning calorimetry,” Philos. Wang, “Effect of Composition on Crystallization and Magnetic Transition of Fe-Si-B Amorphous Alloys,” Mater.
Graham, Jr., "Manufacturing Amorphous Alloy Ribbons and Effects of Apparatus Parameters on Ribbon Dimensions," IEEE Trans. Matsumoto, "The variation of magnetic properties of Fe-based amorphous alloys along the ribbon length," pp.