JOURNAL OF SEDIMENTARY PETROLOGY, VOL. 39, No. 3, P. 1074-1106 FIGS. 1-21, SEPTEMBER, 1969
G R A I N S I Z E D I S T R I B U T I O N S A N D D E P O S I T I O N A L P R O C E S S E S 1
GLENN S. V I S H E R University of Tulsa, Tulsa, Oklahoma
A B S T R A C T
Extensive textural study of both modern and ancient sands has provided the basis for a genetic inter- pretation of sand texture. Analysis is based on recognizing sub-populations within individual log-normal grain size distributions. Each log-normal sub-population may be related to a different mode of sediment transport and deposition, thus providing a measure of their importance in the genesis of a sand unit. The three modes of transport reflected are: (1) suspension; (2) saltation; and (3) surface creep or rolling.
Each of these is developed as a separate sub-population within a grain size distribution. The number, amount, size-range, mixing, and sorting of these populations vary systematically in relation to provenance, sedi- mentary process, and sedimentary dynamics. The analysis of these parameters is the basis for determining the process-response characteristics of individual sand units.
A number of processes are uniquely reflected in log-probability curves o~ grain size distributions of sands and sandstones. These include: (1) current; (2) swash and backwash; (3) wave; (4) tidal channel;
(5) fallout from suspension; (6) turbidity current; and (7) aeolian dune. The combination of two or more of these processes also produce characteristic log-probability curve shapes.
Ancient sands show some differences from their modern analogues, but these are usually minor. Log- probability plots of ancient sands are directly comparable to those from modern sands. The principal limita- tion of this study is in comparing sands formed under comparable conditions and obtaining an independent determination of the processes of formation of ancient sands.
INTRODUCTION
Statement of Problem
F o r m a n y years s e d i m e n t a r y p e t r o g r a p h e r s have attempted to use g r a i n size to d e t e r m i n e sedimentary environments. A survey of the ex- tensive l i t e r a t u r e on this subject illustrates the steady progress t h a t has been made t o w a r d this goal. M a n y excellent contributions have been made d u r i n g the past t w e n t y to t h i r t y years, each p r o v i d i n g new approaches and insights into the n a t u r e and significance of g r a i n size distributions. Only within the past few years, however, h a v e w o r k e r s a t t e m p t e d to relate g r a i n size distributions to the depositional processes responsible for t h e i r formation. T h i s approach appears to be particularly fruitful, and it pro- vides the basis for the n e x t step towards a truly genetic classification of s e d i m e n t a r y textures.
O n e of the m a j o r problems in the analysis of g r a i n size distributions is t h a t the same sedi- m e n t a r y processes occur w i t h i n a n u m b e r of en- v i r o n m e n t s and the consequent t e x t u r a l re- sponse is similar. Now t h a t there are m a n y physical criteria available to identify specific depositional environments, the t e x t u r a l studies do not need to stand alone, but can provide a separate line of evidence to aid in i n t e r p r e t i n g clastic deposits of u n k n o w n origin.
In summary, the problem lays in the relation ' Manuscript received October 10, 1968; revised May 2, 1969.
of s e d i m e n t a r y processes to t e x t u r a l responses.
I f these can be related to specific depositional e n v i r o n m e n t s , then a powerful tool will be available for i n t e r p r e t i n g the genesis o f ancient clastic deposits.
Previous Work
T h e development of a genetic approach to clastic t e x t u r e s has been a long and difiqcult one.
M a n y workers h a v e provided i n f o r m a t i o n and f u r t h e r e d the development t o w a r d s this goal;
consequently, it is n e a r l y impossible to t r a c e the o r i g i n of m a n y of the ideas. Specific concepts such as the log-normality of g r a i n size distribu- tion are v e r y old, with extensive t r e a t m e n t of this concept by K r u m b e i n (1937, 1938). Specu- lation c o n c e r n i n g the reasons for this were dis- cussed by K r u m b e i n (1938), but no satisfactory explanations were given. F r o m t h a t time to the present various approaches to g r a n u l o m e t r i e analysis have been proposed. T h o s e significant to the u n d e r s t a n d i n g of processes are summa- rized, so t h a t the development of the essential ideas relating s e d i m e n t a r y processes to t e x t u r a l responses can be traced.
Developments Durin# I940's
W o r k by P e t t i j o h n (1949) indicated that a n u m b e r of modes existed in g r a i n size distribu- tions, and t h a t deficiencies occurred in the coarse s a n d - - f i n e g r a n u l e size and in the coarse silt size. These modes and deficiencies were at-
trihnted to provenance and to the hydraulics of stream transport, but little environmental sig- nificance was placed oil the observations. No general hypothesis was developed to explain why the same modes should appear hoth in flu- vial and marine sediments.
One of the most significant of the early pa- pers on texture was by Doeglas (1946). He concluded that grain size distributions follow an arithmetic prohability law. Two major contribu- tions by Doeglas were that (1) grain size dis- tributions are mixtures of two or more compo- nent distributions or populations, and that (2) these distributions were produced by varying transport conditions. From his analyses he de- veloped an empirical classification of curve shapes and related types of curves to specific sedimentary environments. There were severaI problems in this type of analysis: (1) a sedi- mentation balance was used for textural analy- sis which did not provide sufficiently accurate or reproducible results: (2) cumulative distribu- tions were plotted on arithmetic probability paper, which tended to minimize the fine grained tail and stronggly accentuated the course fraction; (3) the mixing and truncation of component distritmtions was not observed; (4) curve shapes were not related to specific deposi- tional processes.
Regardless of these limitations Doeglas' con- tributiou was not sufficiently recognized by sedi- mentologists, and this rather fruitful approach to the recognition of sedimentary environments was not widely adopted in this country.
One of the most significant papers relating sedimentation dynamic.~ to texture was pub lishcd by lnman (1949). He recognized that there are three fundamental modes of transport, surface creep, saltation, and suspension (Inman, 1949, p. 55), and he utilized the existing ktmwl- edge concerning fluid mechanics to analyze the mo~ms of transport of sedimentary particles.
Much of the work in this area had been devel- oped by Gilhert (1914), Shields (I936), Rubey (1938), Bagnold (1941), and Kalinske (1943).
Many other workers aided in the development of these concepts, but the above writers related fluid mechanics directly to the problems of sedi- ment transport and deposition.
Preliminary conclusions concerning sorting, skewness, and mean size were derived by Inman (1949). He did not, however, relate these pa- rameters to the total grain size distributions or to the presence of individual populations, as had been suggested earlier hy l)oeglas. Inman's work formed the basis for the emphasis during the 1950's and 1960's on statistical measures of the grain size distribution and on the continued
mathematical study of sediment transport and fluid mechanics.
Developments Durin 9 t950's
Studies by Einstein (1950), Einstein and Barbarasso (1952), and Einstein and Chien (1953) involved the relation of sediment trans- port to stream characteristics. These papers, however, dealt with predicting the volume of sediment transport rather than with deposition.
Papers by Bagnold (1954, 1956) dealt specifi- cally with the transport mechanics of sediments, and these papers provided the theoretical basis for the interpretation of the textures of sedi- ments. Papers by Chien (1956), Sundborg (1956), Vanoni and Brooks (1957), and Brooks (1958) discussed in detail the relations of stream mechanics and sediment transport. This work in fluid mechanics was not applied specifi- cally to textures of the deposited sediments.
Shapes of grain size distribution curves of sedi- ments from both modern and ancient environ- ments were described by Sindowski (1958).
He referenced the pioneer studies by Doeglas (1946), but deviated from that work in that he used log-probability plots of the grain size in- formation. Sindowski (1958, p. 239-240) em- pirically classified size distribution curves ac- cording to seven different depositional types:
(1) relict, (2) strand, (3) tidal flat, (4) shelf, (5) tidal inlet, (6) minor tidal channel, and (7) fluvial. Many examples are provided in his paper from more than 5000 analyzed samples.
Sindowski's work, which generally has been overlooked in this country, provides the first careful study of the relation of sediment textures from known depositional environments to the shapes of grain size curves. It allows the envi- ronmental identification of many types of sands from their textures. Sindowski, however, did not try to relate the shapes of the grain size curves to transport and depositional processes that formed them. This step could not be made without close study of the fluid mechanics of sediment transport and deposition, as was devel- oped by Bagnold (1956) and other workers.
The first step in the correlation of curve shapes with processes was published by A. John Moss ( 1962, 1963).
Developments During the 1960's The two papers by Moss represent a major contribution toward an understanding of the re- lation of grain size distributions to depositional processes. Moss used shape and size of grains to distinguish subpopulations produced by the three means of sediment transport described by Inman (1949) and Bagnold (1956): (1) sur-
1076 GLENN S. VISHER face creep, (2) saltation, and (3) suspension.
He found that these three populations could be intermixed in the same sample. He discussed at length the transportation of elastic particles and mechanisms of entrapment of particles at the sedimentary interface. Moss also provided in- sight into the roll of shape and size in sediment lamination and mixing, and into the mechanisms by which fine or coarse-grained tails are incor- porated into size distribution curves of sedi- ments deposited from a traction carpet of sal- tating sand grains. His data illustrated the sub- division of three sub-populations, and showed that the position of truncation, sorting, and mean size of these populations were different in different samples. The most exactingly selected particles are the ones transported and deposited from the dense traction carpet of saltating grains. Breaks or truncations occur between the population of particles finer or coarser grained than those found in the saltation population or fraction. The fine particles transported in sus- pension usually have an upper size range of about .07 to .1 ram, but may be coarser. This size provides an indication of velocity of free current clear of the bed (Moss, 1963, p. 340).
The coarser grained particles appear to be transported into position at the depositional in- terface by sliding or rolling. This necessitates transport over a bed of low grain roughness;
consequently, these particles are always coarser than those transported hy saltation. The upper size limit of saltation depends on the nature of the current and on the characteristics of the bed (Moss, 1963, p. 306).
Work on truncation points illustrated by log- probability plots was presented by Fuller (1961). He suggested that the break between saltation and rolling popolations in many in- stances occurred near 2 phi, or the point of junction between the Impact and Stokes laws of particle settling (Fuller, 1961, p. 260). Spencer (1963, p. 190) suggested from analysis of data presented by Krumbein and Aberdeen (1937) that : (1) all elastic sediments are mixtures of three or less log-normally distributed popula- tions; and (2) sorting is a measure of the mix- ing of these populations. Intermixture of these populations caused the variation in mean and sorting values present within the group of re- lated samples from Barataria Bay, Louisiana.
Different populations in log-probability plots were shown by Visher (1965a) in a study of flu- vial sedimentation units in Oklahoma. This study using a factor analysis approach sug- gested that flow regime may control the range of grain size of the saltation and suspension populations and the approximate position of
truncation between the two populations.
Klovan (1966) applied a factor analysis to the same data studied by Spencer (1963). He found that the degree of mixing of the two fundamen- tal populations was environmentally sensitive.
The environments separated by Klovan (1966, p. 123) primarily reflected sedimentary process and included: ( I ) surf energy dominant; (2) current energy dominant ; and (3) gravitational energy dominant. This illustrated the close asso- ciation of process to the mixing of suspension and saltation populations in Barataria Bay.
Other lines of textural evidence for environ- mental identification have been pursued during the last ten years; the most significant are the studies by Folk and Ward (1957), Mason and Folk (1958), Harris (1959), and Friedman (1961, 1967). These authors have used the sta- tistical measures of mean, standard deviation, skewness, and kurtosis to separate beach, dune, aeolian flat, and fluvial environments. This ap- proach has been moderately successful in mod- ern environments but less successful in inter- preting the genesis of ancient sediments. Work by Passega and others (1957: 1967) has led to the development of C/M plots. By using a num- ber of samples it is possible to distinguish sus- pension, traction, graded suspension, and other sedimentary processes. Analysis of many sam- ples by use of C/M plots when combined with other methods of textural analysis should add additional insight into the genesis of individual sand units.
R E L A T I O N OF S E D I M E N T T R A N S P O R T TO G R A I N SIZE D I S T R I B U T I O N S
The three modes of sediment transport, sus- pension, saltation, and surface creep, have been studied in some detail from a theoretical and mathematical viewpoint. Some data are avail- able on the grain size ranges attributable to in- dividual modes of transport.
Transport by Suspension
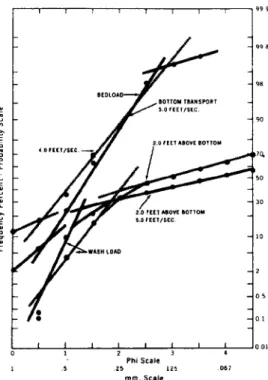
True suspension caused by turbulence where there is no vertical change in grain size occurs in the very fine grained sand range, typically less than .1 mm (Lane, 1938). Other studies sug- gest a size of .0375 mm (U. S. Waterways Ex- periment Station, 1939). The true value must de- pend upon the intensity of the turbulence and possibly could be coarser than .1 ram. The prob- lem is complicated by the interchange of sus- pension and bedload transport in certain grain sizes. As shown in figure 1, this results in a graded suspension, with coarser suspension sed- iments increasing in concentration toward the
1 1 1 r I I T ] 9 9 9~
9 g B
9 8 BEDLOAO
BOTTOM TRANSPORT 5.0 F r E T / S i C .
9 0
2.0 ~EET ASOV( BOTTOM
¢ 0 9 0 .
t 50
7 3o
2.0 f E E l ABOVE BOTTOM t . o ~ K T / S t C
l 0
2
O ~
0 l
I I I I I I I
l 2 3 4
P h i Scale
.5 . Z 5 125 0 6 7
r n r n . Scale
FiG. I.--Mississippi River sediment samples, U.S.
Waterways Experiment Station. The strong size gradation within 2 ft of the river bed is illustrated.
bed (U. S. Waterways Experiment Station, 1939) 2
The size of a sediment particle that may be held in suspension is dependent upon turbu- lence; consequently, the break or truncation point between suspension and bedload transport may be highly variable and reflect physical con- (litions at the time of deposition. In true suspen- sion no variation in concentration of sediments exists from the surface to the depositional in- terface. Therefore, some of this material is available for deposition with coarser material at the sediment-water interface. A graded suspen- sion increases in grain size downward towards the bed, allowing an interchange with the bed- load. Mixing between these two populations is common in a sedimentary deposit. Most sedi- mentary laminae contain some of the .1 mm and smaller size fraction, which is directly deposited from the suspension mode of transport. This size material was easily recognized as a sep- arate population in log-probability plots of some Recent sediments (Visher, 1967a, 1967b).
*The term graded suspension has been used by a number of writers, but with little consistency. It is used here to indicate coarse materials ( > .1 mm) which are part o5 the suspension or "clay" population.
Saltatlon Transport
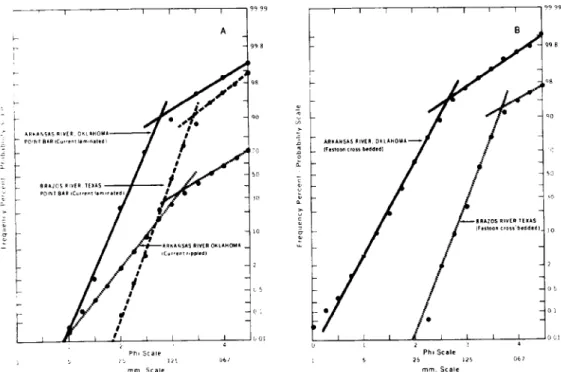
Very little information is available on the grain size distribution of the moving bed layer, or traction carpet. The maximum size that moves in this layer is unknown; but from stud- ies of the U. S. W a t e r w a y s Experiment Station (1939), grains from .75 to 1.0 mm have been sampled moving within 2 ft of the bottom (fig. 1). Grains of this size must be deposited by an interaction between the traction carpet and the graded suspension. Log-probability plots show that grains of this size are the coarse end of a single population, and previous studies (Visher, 1965a) indicate these to be a part of a saltation population.
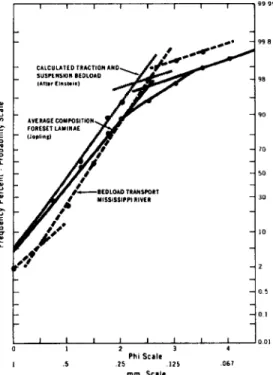
Figure 2 shows a striking similarity between the shapes of the log-probability curves of both the bedload samples from the Mississippi River (U. S. Waterways E x p e r i m e n t Station, 1939) and samples from fore-set beds of a model delta (Jopling, 1966). ]opling (1966) shows a com- parison to a theoretical distribution from a heavy fluid zone using Einstein's (1950) bed- load transport formula. The close agreement suggests that the Recent bedload sample, the grain size distribution from a deposited lamina, and the theoretical distribution from a moving grain layer are all measures of the same funda- mental distribution. The distributions shown in
¢¢
c e n. e
e
SUBP[N$1O N BtOLOAO l a t t e r (Instec.)
F O R E S t T L A M I f l A ( ( J o p t i e l l
MISS~$SlPPIRIVER
O ] 2 3 4
Phi Scale
l .5 .25 . ] 2 5 . 0 6 7
ram. Scale
FIG. 2.--Curves illustrate the similarity between cal- culated bedload, sediment lamina, and bedload samples.
1078 G L E N N S. V I S H E R figure 2 all contain two or three populations and
are similar to log-probability plots of fluvial de- posits described by Visher (1965a).
There appears to be a similar size distribution in the moving bed layer or traction carpet and in the resulting depositional laminae. This pro- vides the opportunity to reconstruct from the grain size distribution the physical forces pro- ducing a lamina. More study of the conditions responsible for the development and character- istics of the traction carpet are needed, but from preliminary data the concentration and ve- locity of the traction carpet appears to be di- rectly interpretable. "]-'he upper flow regime pro- duces a different shaped log-probability plot than does lower flow regime conditions (Visher, 1965a).
Surface Creep Tra))sport
Most grain size distributions show a coarse- grained population with a different mean and degree of sorting than the other two popula- tions. Certain fluvial deposits, however, do not
99.9
99 --
RELATION OF P R O B A B I L I T Y PLOT TO CUMULATIVE FREQUENCY AND - T O THE FREQUENCY HISTOGRAM
90
50 --
show this population, and the saltation popula- tion includes the coarsest material in the distri- bution. The reason for this is unknown, but prob ably it is related to removal of part of the coarsest fractions and to the strong shear at the depositional interface in deposits formed by continuous currents.
A N A L Y S I S O F G R A I N S I Z E C U R V E S
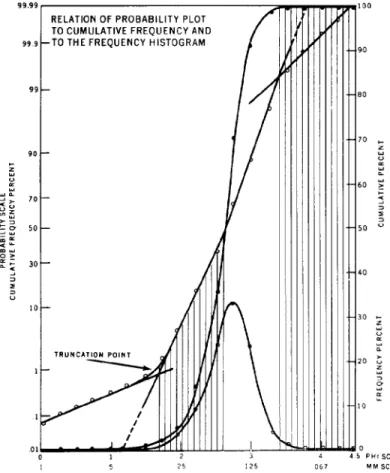
The comparison of grain size curves and the interpretation of separate populations is aided by the use of log-probability plots. Figure 3 shows three different methods of plotting a grain size distribution. One curve shows the log of the grain size with frequency percent, an- other with the cumulative frequency percent, and the third with the cumulative frequency percent--probability. This last type of plot, with a few simple assumptions, is believed to be mean- ingful with regard to depositionaI processes.
The first two curves are difficult to read and in- terpret, and change in slope, amount of mixing, truncation points, and other parameters cannot
99.99
30 - -
'° i
J
• • - J ~ ~ " I I l l l l E t
I 2 3 4 4 5 PHt SCALE
5 25 125 067 MM SCALE
FIG. 3.--Comparisons of grain size distribution curves. The log-probability curve shows multiple curve segments and truncation points.
be easily observed or compared. The striking as- pect of the log probability plot is that: (1) it normally exhibits two or three straight line seg- ments; and (2) the "tails" of the simple " S "
shaped cumulative frequency curves appear as straight lines, allowing for easy comparisons and measurements. These straight line segments have been observed in nearly 2000 grain size distributions. T h e consistency of the position of truncation points, slopes, anti other characteris- tics suggests that meaningful relationships are reflected by log-probability plots.
The most important aspect in analysis of tex- tural patterns is the recognition of straight line curve segments. Ii1 figure 3 four such segments occur on the log-probability curve, each defined by at least four control points. The interpreta- tion of this distribution is that it represents four separate log-normal populations. Each pop- ulation is truncated and joined with the next
population to form a single distribution. This means that grain size distributions do not follow a simple log-normal law, but are composed of several log-normal populations each with a differ- ent mean and standard deviation. These sep- arate populations are readily identifiable on the log-probability plot, but are very difficult to pre- cisely define on the other two curves (fig. 3).
Using the fluid mechanics concepts summa- rized in the previous section, and the work by Moss on the different populations, the following interpretation and assumptions have been devel- oped. Figure 4 illustrates the analysis of a sin- gle sample from the foreshore of a beach. A suspension population has been defined which represents less than 1 percent of the sample.
Note that the point where it is truncated and joined to the next coarser distribution is close to 100 microns. This is precisely the point where fluvial hydrologists report marked
co
~SS
._J
I I
EXAMPLE SHOWING FOUR TRUNCATED LOG NORMAL POPULATIONS FROM LOWER SWASH ZONE
~WASH-BACKW SEPARATION
9° I- ,ONEOFM,X,NO\
B 2 PHI B R E A K ~ . i
TRACTION POPULATION
¢
LOAD BREAK
l 2 3
5 .250 .125
SALTATIO N POPULATION A '
~ J SUSPENSION POPULATION
- - 99 B
- 90 SALTATION
POPULATION A
- 50
- - 1 0
--0.1
4 PHI SCALE I
.067 MM SCALE
FIG. 4.--Relation of sediment transport dynamics to populations and truncation points in a grain size distribution.
1080 G L E N N S. V I S H E R changes in the size distribution of the wash load
or material transported dominantly in suspen- sion (Lane, 1938).
T h e grain size distribution curve (fig. 4) shows two very well sorted saltation populations which differ only slightly as to mean-size and sorting. The high degree of sorting of these two populations suggests very exactingly selected grains that logically would be deposited from the moving grain layer or traction carpet of saltat- ing grains. This particular sample is from the foreshore of a beach where swash and back- wash represent two differing transport condi- tions and presumably produce two separate sal- ration populations in opposite flow directions.
Such a result emphasizes that small changes in current velocity can modify a single detrital population.
The truncation of the saltation populations occurs near 2 phi, or 250 microns. This break has been attributed by some workers as the junction between the Stokes and Impact Law formulae (Fuller, 1961). This might be inter- preted as the size where inertial forces cause rolling or sliding of particles rather than sara- tion. The coarser straight line segment repre- sents traction load or surface creep.
Inasmuch as the evidence suggests that grain size distributions are in reality mixtures of one or more log-normal "populations," an analysis of the number, degree of mixing, size range, percentage, and degree of sorting of each popu- lation should characterize a grain size distribu- tion. If it is assumed that each transportation process (surface creep, saltation, and suspen- sion) is reflected in a separate log-normal popu- lation within a single grain size distribution, the proportion of each population should he related to the relative importance of the corresponding process in the formation of the whole distribu- tion. In addition, the sorting, size range, degree of mixing, and the points of truncation of these populations can provide insight into provenance, currents, waves, and rates of deposition.
An analysis of more than 1500 samples has shown that these parameters v a r y in a predict- able and systematic manner, and that they have significance in terms of transport and deposition.
C t t A R A C T E R I S T I C C U R V E S H A P E S F R O M MODERN E N V I R O N M E N T S
Sampling Procedures
Samples collected from known depositional environments were analyzed in light of the con- siderations outlined above. Sampled areas in- cluded a wide range of environments, physical conditions, and provenance areas. The samples were collected to provide factual information on
the association of specific sedimentary environ- ments with certain types of grain size distribu- tions. More than 500 samples from modern ma- rine environments were collected to determine whether there was a genetic association of curve shapes with environment or depositional processes. A t each sample locality information was obtained on the physical aspects of the depositional environment, including tidal infor- mation, wave conditions, provenance, and geo- morphology of the depositional site. Special em- phasis was placed on sampling many different geographic areas, and presumably differing provenances and physical conditions. In every instance effort was made to collect samples rep- resentative of conditions at the time of the sam- pling. Most samples were from the uppermost bedding unit, and rarely did a sample extend more than a few centimeters below the deposi- tional interface.
Beach and Shallow Marine Samples Samples were collected along profiles across the strand line from the dune to several hun- dred yards offshore at more than 30 locali- ties from Grand Isle, Louisiana to Cape H a t - teras, North Carolina (fig. 5). In addition, sam- ples were taken from beaches along the Gulf Coast from Brownsville, Texas, to Cameron, Louisiana. T h e nature of sampling is illustrated in figure 6 for each sample locality. T h r e e to 25 samples were collected at each locality, and spe- cific information on the physical and geo- morphic conditions was recorded (fig. 6).
Analysis of the size data from these samples showed that there were several different funda- mental log-probability curve shapes. The sam- ples could be classified into those deposited by:
(1) beach processes; (2) aeolian processes;
(3) wave action; and (4) breaking waves.
Each of these four shows characteristic log- probability plots.
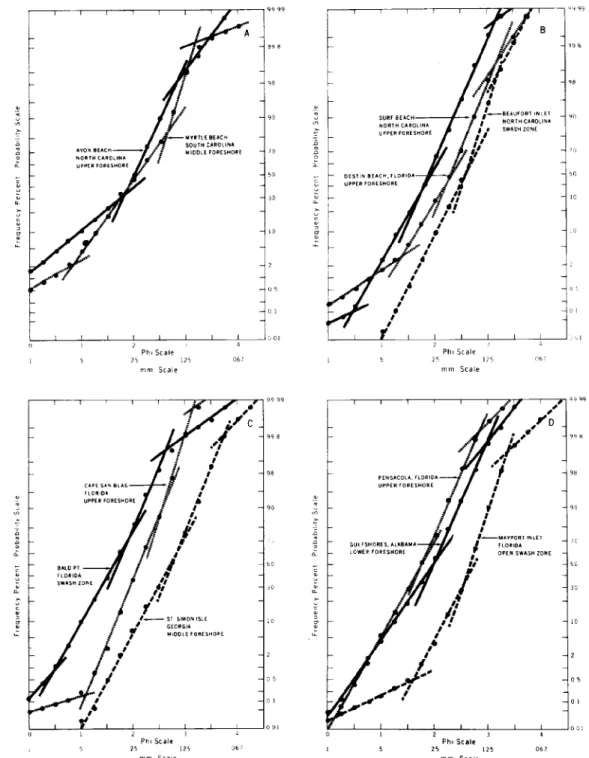
Beach
F i g u r e 7 illustrates the characteristics of foreshore sands from 11 different beaches, :from a wide range of physical and provenance condi- tions. Each size distribution is plotted in identi- cal fashion, and all show three or four popula- tions, with two saltation populations. Many differences appear, however, and the position of truncation points is highly variable. At Myrtle Beach (fig. 7A) the 2-phi break occurs at 1.0 phi, and at Pensacola Beach (fig. 7D) no 2-phi break is present. The break in the saltation popu- lations ranges from about 15 percent to near 80 percent. Also slopes, or sorting, of the various populations are highly variable.
1081
ARK.
M I S S .
#
TENN. , ~ N.C.
ALA, GA.
S.C.
FOLLY B EDISTO INLET FOREST B.
ST SIMONS ISLE.
JEKYLL ISLE B.
AMELIA ISLE S.
NASSAU SOUND MAYPORF ISLE PONTE VERDA B, CRESCENT B.
AVON BEACH CAPE HATTERAS ATLANTIC SOUND PAMLICO SOUND BEAUFORT INLET ATLANTIC B.
SURF B LONG B, KURE B.
NYRTLE 8.
SAMPLE LOCATIONS
FZG. 5.--Recent sediment samp]e localities.
5 FEET v LOWER . f
/ 9g FORESHORe,Jr" 99
S H O R E - P R O F I L E >= ~ 90 j r 90
TIDE GOING OUT ~ PREDOM ~ perD^M
SHELL 50 SH~L~ " 50
= ou.E . I
o ' , - . o ; 1 °
PHI SCALE ] PHI SCALE ~ ,0
; . ~.,go ~.~,E~T N , , I / I" , f , ~o,,
. : I ' / " I - # I I PREOOM. / Jso ~ 2 I A
-~ : " t :lso ~ ~ t9o | SHELL ,T ~ PHISCALE
--~ : PREDOM. 7 ~ ~ PNEOOM. / :1 I / ~ ~S0 I
:SHELL / 11o ~ S.ELL / ~lsol I ~ ~ I
o
~ I / I .~ I I :I I ~ -I,o l . . ~
: " !,X. 1' ~ Lz__..,.¢... 1 '° I " ~,
" < ' / , , , 1 ° " ~ - - - - ' '1, I .-Io., , , ~
o l 2 ~ 4 == -,10.11 . . .
I'"'
SCALE ; ; ;;' /
'PHi2SCA3LE 4 - ~ HIGH TIDE- I --SEA LEVEL-- " ' ; ' . , " ~ c - ~ I- ~ ~ - " - ' ~ F ~ _ ~
FIG. 6.--Shore profile and sample distribution. Grain size curves illustrate effects of environnlent on texture.
1082 (;1.EA3/ N. U L 9 H E l q
,g
L2
SOUTH CAROLINA UIODLEFORESMORE
I l I I I
4 Ph, Scale
25 ~25 o61
m m Scale
50 30
I3
2 05 01
SURF BEACH-- NORTH CAROLINA UPPER FCRESHORE
£
DESTIN BEACH, FLORIDA 4
/
/
5
e
. / ~ B e * u r ORt dNLET NORTH CAROLiN A
e swash ZONE
I O I 4
P h l Scale
25 125 ,~7
m m Scale
/
Bt 98
C*PE S*~ BLAS
FLORIDA C ~ ~ #
I 90
m • , m
//"
BALD FT
/ o
/ :, 5
FLORID A 50
2 SWASH zo~z
f c
~ ST SIMON ISLE I o
• MbOOlt fO~ESHO¢~
# ¢
le 2
/
# Ol#
~
~ - - M A y p O R T"#,,,,"' 1
INLET~90
;(;FLORIOA OFEN SWASH ZONE
1 2 3 : 0 1 2 3 4
Phi S c a l e P h i S c a l e
5 25 125 0~7 1 5 25 125 067
m m Scale m m Scale
FIG. 7.--Examples of beach foreshore sands. Sands formed by differing wave and provenance conditions are included. All curves have a similar shape.
T h e similarity of each of these sands is in the development of two saltation populations. T h e reason for this is believed to be related to swash and backwash in the foreshore zone, but other possibilities might include m i x i n g from separate provenances or shape of particles of different size. T h e s e samples are related only by their oc- c u r r e n c e on the foreshore, and it is improbable t h a t the same break would occur in all samples nnless it is related to a specific process devel- oped on the foreshore. In the h u n d r e d s of ana- lyzed samples this p a r t i c n l a r curve shape is al- ways associated with the foreshore of a beach.
Dune Saints
O f the more t h a n 100 dune samples analyzed, 12 are shown in figure 8. T h e samples are from dune ridges a d j a c e n t to beaches. This location inflnenccs the general shape of size distributions for these samples, m a k i n g them a highly selec- tive group of wind blown sand deposits. How- ever, certain characteristics are developed that can be associated with wind processes, and these characteristics serve to distinguish them from samples from o t h e r e n v i r o n m e n t s closely asso- ciated with beaches.
O f special significance is that the two popula- tions found in the saltation r a n g e of the beach foreshore h a v e been resorted into one popula- tion. A single saltation population is developed in all of the dune samples, and in each case it represents nearly 98 percent of the distribution.
The sorting of this single popnlation, as indi- cated by the slopes of the curves, is excellent, and generally better t h a n for beach samples.
Also the t r u n c a t i o n of the coarse traction popn- lation occurs between 1.0 and 2.0 phi in all sam- ples. T h e p e r c e n t a g e of the traction population was found to be very small, n e v e r more than 2 percent. T h e presence of a suspension popula- tion and the t r u n c a t i o n of the coarse popnlatio~l account for the positive skewness c h a r a c t e r i s t i c of dune deposits. All these characteristics serve to differentiate dune sands from all o t h e r rood ern sands the w r i t e r has analyzed.
T h e importance of saltation in wind t r a n s p o r t of sediment has long been emphasized, and the dominance of this population in the samples an- alyzed suggests a genetic relationship. The gen- eral lack of competence of wind processes to move a coarse population by surface creep (Bagnold, 1941), accounts for the small per- centage of material in the coarse population. Fi- nally, the addition of 1 to 2 percent in the sus- pension population above that present in the beach foreshore samples suggests t h a t unidirec- tional winds are like fluvial transport, and that the suspension materials are incorporated into the sediment at the depositional interface.
Marine Sands from Wave Zone More variability occnrs in the shapes of the log-probability curves of m a r i n e sands t h a n in those previously described. T h e 12 samples plot- ted on figure 9, however, were selected from more t h a n 100 samples of sediments from the lower tidal flat to a w a t e r depth of 17 feet. T h e basic similarity of all these samples is t h a t they are from the wave zone, and t h a t the deposi- tional i n t e r f a c e was wave rippled at nearly every sample locality. In each instance t h r e e different populations are developed, and each sample contains a variable a m o u n t of silt and mud. All show a poorly sorted coarse population which remains a f t e r the shell material is re- mox, ed by an acid leach.
Characteristics of these c u r v e s include: (1) a poorly sorted coarse sliding or rolling popula- t i o n ; ( 2 ) a very well sorted saltation population with a size r a n g e from approximately 2.0 to 3.5 phi; and ( 3 ) a variable p e r c e n t a g e of the sus- pension population. T h e a m o u n t of the suspen- sion population appears to be related to the p r o x i m i t y of the depositional site to a sonrce of fine elastics. T h e samples with the largest pro- portion of this fraction came from either the Sea Island area, Georgia, where a n u m b e r of rivers d r a i n i n g the coastal m a r s h e s and plain e n t e r the sea, or from the Mississippi Delta area. O t h e r samples f a r t h e r from a elastic source, for example A v o n Beach n e a r Cape H a t t e r a s , N o r t h Carolina (fig. 9A) and Gulf- shores, A l a b a m a (fig. 9C), h a v e a v e r y small f r a c t i o n of the suspension population. The rela- tions, however, are complicated by local physi- cal conditions, such as b r e a k e r height, shoreline geometry, and sedimentation rates.
Certain characteristics of m a r i n e sediments suggest a correlation to wave processes. T h e os- cillation which produces wave ripples may cause w i n n o w i n g t h a t produces the excellent sorting and the n a r r o w size range of the saltation popu- lation. The lack of s t r o n g c u r r e n t s p r e v e n t s the removal of the coarse bedload population or its t r a n s p o r t by saltation. T h e fine suspension pop- ulation is related to the a m o u n t of the mate- rial in suspension and to the a m o u n t of win- n o w i n g at the sediment w a t e r interface.
Marine Sands front Zone of Breaking Waves
T h e final type of g r a i n size distribution from the near shore zone is a product of deposition in the s u r f zone. T w e l v e samples from this zone are illustrated in figure 10. The samples are c h a r a c t e r i z e d by relatively high percentages of material in the coarse sliding and rolling popu- lation. The percentage of this material is depen-
1084 G L E N N S. V I S H E R
SIORGIA I I P M y R 1 L [ e [ A C H ~ IOUIH CAROLINA
P
#
A T L A N T I C I E A C H ~ / J NORTH CAROLINA
f
, I
÷,'
IST> SINON5 I R K GEOflIGA
/'
I1
I I ISURFBKACH ~ I
NORTH CAROLINA I I I I
t
7 ] 4
Phi Scale
25 125 067
mm Scale
] 2 3 i
Phi Scale
55 25 125 067
t u r n Scale
D 22
m
Uot" Io '
98 9S
~ eONetMTRATE
¢!"g ... ,,o.,o, ~
- 9 oso ~ so
A l l LIA ISLE
M(xiCO 8EACH - ~ ' - ~
F LDRIOA ; ~ F LORiO A
L~ DestIN OEAcH 4 30
' 71 I" ' ...
FLORIDa ~ ~ !
I o ~ paid AMI C i t Y - - I l0
~ FLORIDA ] J -
;~7 i , / ] - ,
i # - 0 5
' "
I# _-
#
o o l 1 I I I I 1 I o o l
u I 2 ~ 4 o i 2 3 4
Phi Scale Phi Scale
I 5 25 I25 D67 1 5 25 i25 O67
mnn Scale rnm Scale
I:lc. 8.--Examples from beach dune ridges. The similarity of curve shapes is evident, but variation in mean and maximum grain sizes and amounts o£ individual populations are illustrated.
NORTN e k n o t mA J
I I S O w i l l . dl pth)
I
/ -
~ O R ] N CAROLINA I I z O' wattr etl~t h ) 4 r ( ~ l , t , nppltd
- / J I
GEORGIA lOWER TIDAL FLAT (Wavi.ppledl
o
L~
Y g
# I
PAMLICO SOUt~O ,1~
HoRrH CKROtmK I
~10' ware, depth1
# -- I I I
I FeaLy BE ~ C H ' ~ l . l L ~ SOUTH CAROLINA
I
i
SOUTH CAROLINA (1S 0 ws~r eepml 4*a*. ~,p¢odl
] 2 3 4
Ph0 S c a l e
5 22 12~ o6~
m m S c a l e
1 ? 3 4
Phn S c a l e
5 25 175 o67
m m S c a l e
L~
g s
d l
!
MEJlON E[ACH FLORIDA (G ~" ml(er deplhl
I I l i I
2 Ptl, S c a l e
2 5 12~
m r n S c a l e
~o
70 .~
&
so
I • g 2
~o ~
GEORGIA /
TIDAL FLAT I
( * * r e r,ppl.d) /
SOUTH CAROLINA I11 O' re#tit dot~3
I I I i I I
2 3 4
P h i S c a l e
25 ) 2 5 067
m m S c a l e
FzG, 9 . - - W a v e zone sand distributions. Similarity in the general form of these distributions can be seen. The variation in water depth does not appear to affect the grain size curve shape.
1086 G L E N A 7 S. V I S H E R
I 5
SURT~(ACM
NOnTH C l R C L [ N k ( l 5 ' w a t * , O e O ~ l
LONGGEACH NORTH CAROLINA (2 0" * l i e . deptE) I m . " l . = ~ " ~ ]
~ 9 9 8
g
c
I I I I
B ;
# 4
MYRTLE BEACH ' •
$CUTHCIkROLINA I 2 0 " w m t e r d e o t h l p
SOUIH CAROLINA (2 5 * a t e r d e p t h l (Plu.eezonel
SOUTH CAROLINA (I 5 ' w D t e f d e p t h ) I P l u . | t l o n e }
2 ] 4 D I 2 3 4
P h i S c a L e P h , S c a l e
25 125 0 6 7 1 5 2 5 125 06~
m m S c a l e m m S c a l e
g8
qO
: 50
g
.o
g 2
2 g
t l . S ' w ~ t , , deekh) (Pio~eg zo.e)
~NOIAN REACH-- FLORIDA 12 S ' w a M r d e p t h l t e l u . | e ~ H ~
• • FtO~LOA
4m$ (5 D' w a l e r d e p l h l
!
g g 8
(] 5' water cieolhl (Plunie zonel
# l
f
eLOmDA 1 5 5 ' w a ~ r d e p t h ] IAFeakerroet)
II :T'wat~r dep1~) lores1 of bar ~fl b r u k e r Eon|)
0 l 2 ) 4 0 I 2 3 4
P h i S c a l e P h i S c a l e
1 .S .25 125 .067 l 5 2 5 125 0 6 7
r n m S c a l e m r n . S c a l e
~IG. 10.--Examples of sands from the s u r f zone. All samples show a high concentration of the coarser popu- lation. Comparison with beach sands (fig. 7) indicates the coarser" population is more poorly sorted.
dent upon the source area and wave conditions, hut ranges from several percent to 80 percent of the grain size distribution. The saltation popula- tion is added to this coarse material, but mixing occurs between the two populations. The fine end of the saltation population is truncated, and little suspension population is present.
These characteristics appear to be consistent with the processes of waves interacting with strong currents. Breaking waves keep the depo- sitional interface agitated, and suspension mate- rio1 is winnowed out and transported seaward hy currents. The traction carpet is of an inter- mittent nature, depending on the position of the breaker and on the direction and magnitude of the currents. These combine to allow mixing be- tween the saltation and the sliding or rolling populations.
Mississippi Delhz Samples
Nature of samples.--A group of 30 samples was taken from a series of short 2-3 ft cores col- lected by James Coleman aml Sherwood Gagli- ano of the Coastal Studies Institute of Loui- siana State University. These cores were taken in the area of the Southeast Pass of the Missis- sippi River for the study of sedimentary struc- tures. The sampling and textural analysis were performed by the wrRer to determine the rela- tionship of specific structures and environments to the shapes of log-probability curves.
E~zT.iro~,ments sampled amt mTturc of site dish'i- butions.--The size distributions for this group of samples appear to be fundamentally different from those described for the beach and near- shore environments, but some similarities exist.
Three examples from each of four environ- ments are illustrated in figure 11. These in- chnte: (1) strand-line deposits (fig. l l A ) ; (2) distriln~tary month bar (fig. l l B ) ; (3) natural levee (fig. l l C ) ; and (43 channel deposits (fig.
l i D ) .
Distributary month bar samples are similar to the shallow marine sands previously described, but they contain an appreciable amount of the suspension population (fig. 11B). These samples are from shallow water (less than 6 ft), but wave energy is not snmeient to remove the sus- pension population. The amount of this frac- tion is likely to be related to the high load of suspension material in transport in the waters of the Mississippi River.
The deposits from the natural levee (fig.
l l C ) along the distrilmtary are different from those developed in other environments. The curves show a single population, with a size range and sorting characteristic of suspension transported detritus. Nattmal levee deposits are
formed by the rapid fallout of suspension mate- rial along the flanks of the distributary. This is a product of rapid change in current velocity at the channel margin, and may account for the single population. Similar distributions were recognized by Klovan (1966) in the area of rapid sediment fallout in the Barataria Bay area, Louisiana.
Strand line deposits (fig. l l A ) show the dual saltation populations characteristic of foreshore beach deposits. The m a j o r difference lies in the presence of a considerable silt and mud suspen- sion population. This is to be expected close to the mouth of the Mississippi River with its high suspension load, and also because of the mini- mum wave energy developed along strand lines associated with the delta.
The distributary channel deposits show two m a j o r populations, one related to suspension and the other to saItation (fig. l l D ) . The salta- tion population has a size range of nearly 2 phi, and it is truncated at 3.0 phi in one sample and near 3.75 phi in the other. The percentage of the suspension population ranges from 50 to 80 percent. These two samples possibly reflect dif- fering current velocities.
Altamaha River Estuary Samples Nature of samples.--A series of 86 samples of the bottom sediment was collected from the A1- tamaha River Estuary. The distribution of sam- ple stations is shown in figure 12. At most lo- calities current, wave, tidal, depth, salinity, and turbidity measurements were taken at the time of sampling. The em, ironments sampled in- cluded: (1) marine tidal delta; (2) shoal area seaward of inlet: (3) wave-current zone: (4) tidal inlet: (5) low energy tidal channel and tidal river; and (6) major tidal channel above the zone of the salt wedge. In adddition to these environments two sample stations (nos. 10 and 55) were occupied over a 12-hour tidal cycle, with sampling carried out at 2-hour intervals.
These 12-hour sample stations provided a mea- sure of the response to high and low velocity conditions. In most instances the sample was from the upper few centimeters of the hod : con- sequent]y it represented the physical conditions for a short period of time prior to sampling. In areas of strong velocity changes over short pe- riods of time, the sample represented an aver- age of the prior transport conditions. This is a characteristic aspect of each environment, and the individual samples develop characteristic size distribntions.
Characteristic size distributions.--Seleeted size distributions shown in figures 13 and 14 illus- trate different shaped log-probability curves.
1088 GI.EArN 5". V I S H E R
,y,
,5
T 1 I I ] I
,J
STRANO-LINE AIIP#~ -- E~9'
,#
.;](Y
,,Q
I pqo
STRAND L'N( O~----~,~,-i~ ttO
H i
:'
A } ' J~MO U TH eAR o S
L I ~ L ~ 00l
L 2 ~ 4
Phn S c a l e
z ~, 12~ e67 m m S c a l e
DISTRIBUIARY MOUTH BAR B
99 8
q e
./g~f #/
90. o •
SHJLLOW MAR~NZ , g .i. 70
qwove zo.,I •
I" 7 ~
,:....=., " i
/
/ / /
/ f . ~ 1 2
. . ¢ . / . e ' F ,
t 2 ~ , 4, loo
P h i S c a l e
25 125 067
ram. S c a l e
l I i [ i r
N A T U R A L L E V E E
c
g .
Phi Scale
25 125 06l
mm Scale
2
0 5
°'
f
ool
o
I I 1 I 1
DISTRIBUTAR¥ C H A N N E L
r i
D
MAJOR CHANNEL ~
ISt,on| (wr~ntl / ~
$~tAL LOW WATE lq
&DJACENT TO
NATURAL LEVEE (Weak cerrent )
#
/
J / , . 4 ' e , , , ,
I 2 3 4
P h i S c a l e
5 2 5 125 0 6 7
m m S c a l e
17 o
50
30
5
1
Ol
FZG. l l.--Sands from associated Mississippi River Delta environments. The shape of the grain size curves strongly reflect environmental conditions. Transport processes are indicated for each illustrated curve.
"]!
~ ~ -
• x ~ ' ' ~
! "
-o.~ n
• ~ • ~ "~ .,.~~! i.~ .... ,~i~~.~:ii~ '~~"~-~ ,~ :~ ,~ ..Jiii~ .j .... ~i ~
~ ¢ i / .• ii /-" ! ",.,i ¸ " ~ . ... ~(..:.::i ...
~3
<
?2
"..~
ca
©
¢.-,i I