Introduction
Martian aqueous history
The Martian crust is predominantly basaltic (e.g., Christensen et al., 2000 ), and magmatic minerals such as olivine and pyroxenes have been mapped globally (e.g., Koeppen and Hamilton, 2008 ; Mustard et al., 2005 ). Chloride, carbonate, and sulfate salts have been mapped globally, and detailed, localized studies have provided evidence for late Noachian–early Hesperian paleolakes (e.g., Murchie et al., 2009) and playas (e.g., Wray et al., 2010).
A case study: Gale crater
Identifying aqueous alteration using large spectral datasets
Amazonian terrains show little evidence of water changes (Ehlmann and Edwards, 2014), reflecting a transition to a drier climate on Mars. In this thesis, I developed analytical tools for measuring volatile elements in the large ChemCam dataset.
Thesis contents
Hydrogen has been detected in most targets observed by ChemCam (Schröder et al., 2015). As such, we can trace the variability to the greater H content of the base of the Murray Formation.
Characterization of Hydrogen in Basaltic Materials with Laser-
Introduction
Laboratory work has shown that quantifying the hydrogen content from this single line is challenging (Sobron et al., 2012). The first absolute quantification was then proposed by Rapin et al. 2017a), which only considered a linear calibration curve.
Samples and Methods
- Samples
- Mixtures
- Rock Samples
- LIBS Measurements
- Peak Fitting and Normalization of Spectra
- Independent Characterization
- ChemCam Data
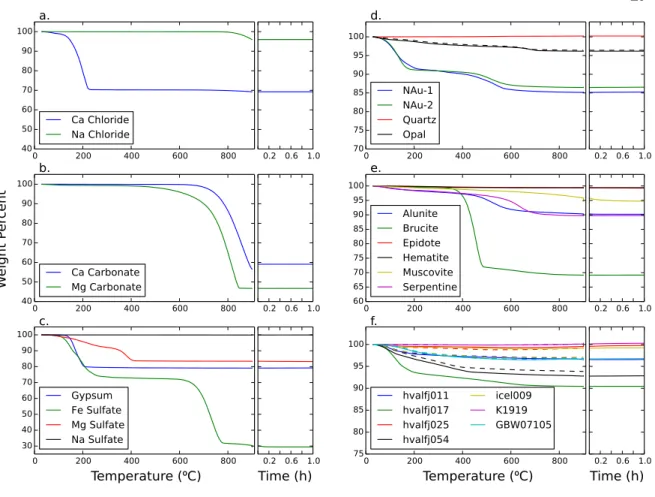
Therefore, we calculated the H2O weight percent for the basalt samples using the minimum value of the TGA curve. ChemCam collects images of targets in addition to LIBS spectra using RMI.
Results
- Thermogravimetric Analysis
- LIBS H Peak Versus H Content
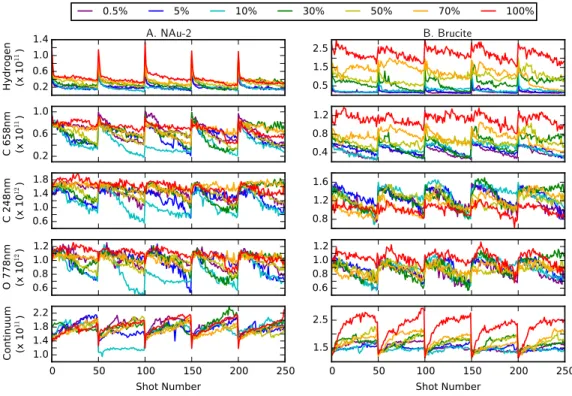
- Shot-To-Shot Behavior
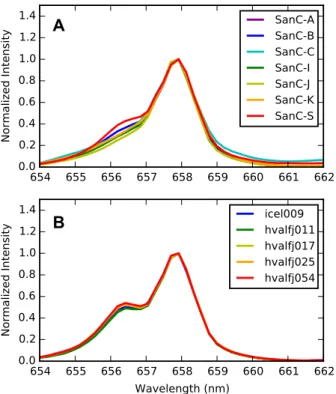
- LIBS H Line in Natural Samples
- Use of Calibrations to Determine H in ChemCam Spectra
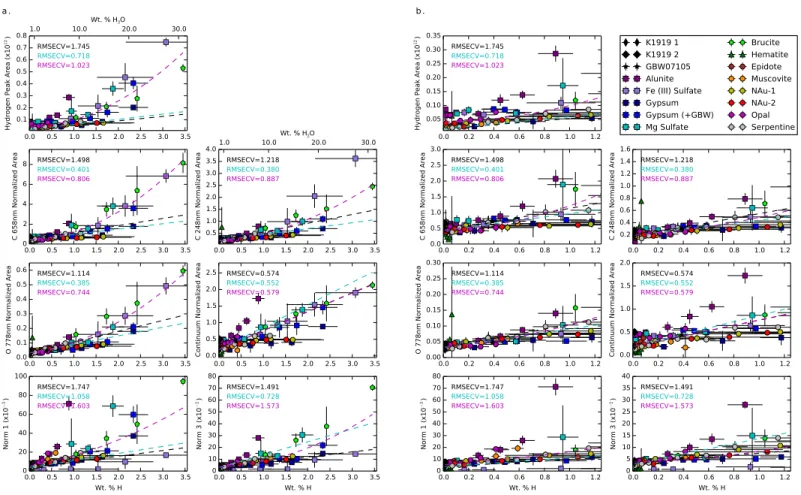
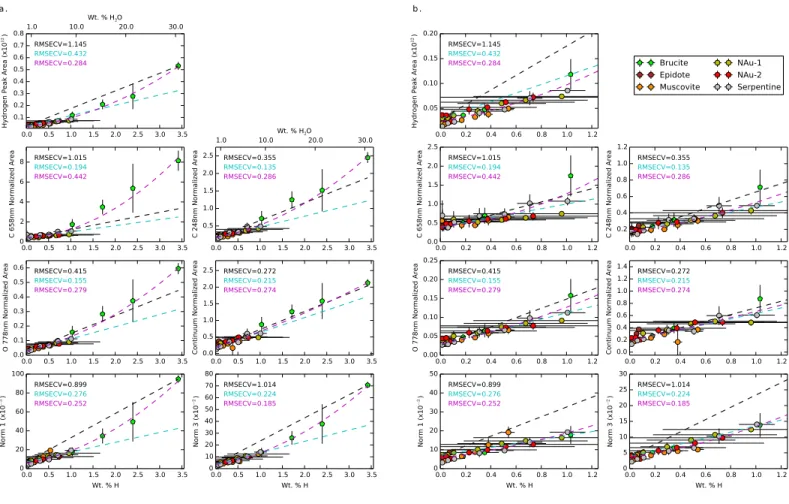
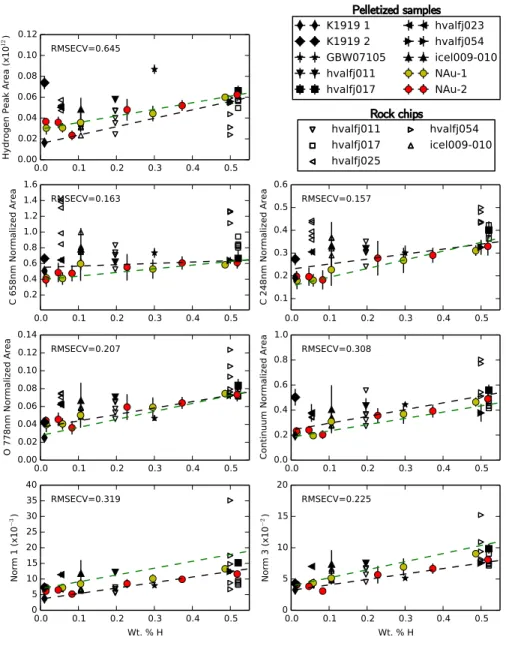
The normalized H-line area versus weight percentage H (loss above 150 °C) was also calculated for the natural crushed stone and powders and compared to the linear fit from Figure 5 (Figure 11). The peak area of hydrogen emission versus weight percent hydrogen (calculated based on temperatures > 150 °C) for the basalt samples and the nontronite mixtures.
Discussion
- Normalized H Peak Area Calibration Curves
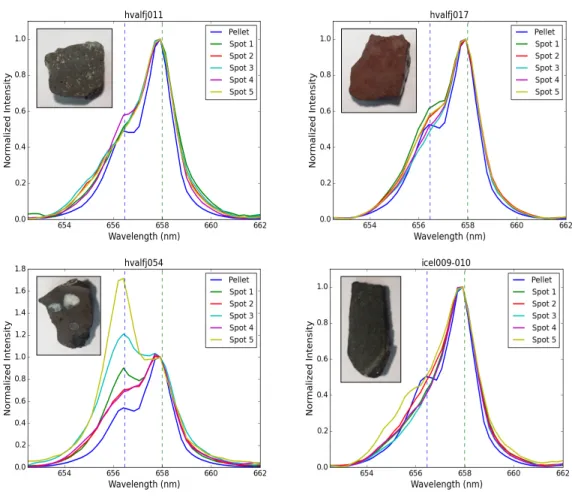
- Physical Matrix Effects and Pellets Versus Natural Rocks
- Application to ChemCam and Future Applications
The mean and standard deviation of the hydrogen values are shown in the upper right corner. This may be due to dehydration of the sample by the laser or due to simple cavity effects (Rapin et al., 2017b). It is difficult to understand the cause of the larger FWHM for the rock chip samples since they have more cohesion.
The box extends from the lower to upper quartile values of the data, with a line at the median. The box extends from the lower to upper quartile values of the data, with a line at the median.
Conclusions
Comparison of samples with low measured mass percent H to determine the detection limit of the H peak, including Na chloride (0 wt% H), Ca carbonate (0.01 wt% H). ChemCam activities and discoveries during the nominal mission of the Mars Science Laboratory in Gale Crater on Mars. Laser-induced degradation spectroscopy of soils and rocks: Effect of sample temperature, moisture and roughness.
Evolved gas analyzes of sedimentary rocks and eolian sediment at Gale Crater, Mars: Results of Curiosity rover sample analysis on Mars instrument from Yellowknife Bay to Namib Dune. Here, we applied the recent improved laboratory calibrations of H by Rapin et al. 2018) to quantify the bulk H content at the base of the Murray Formation.
Methods
- Statistics
- Chemistry
- Uncertainties
- Comparison to other instruments
- Carriers of enrichment
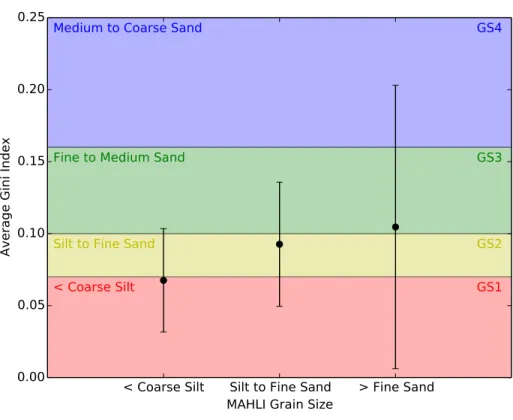
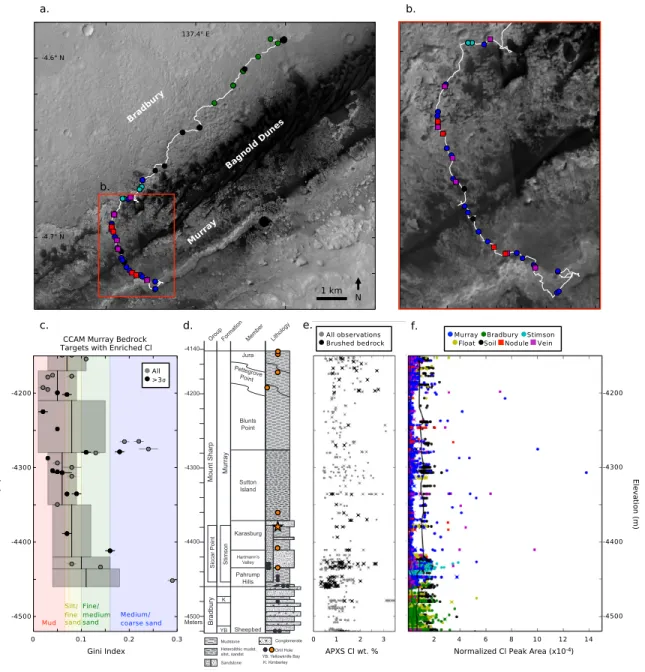
Colors in (b) indicate Gini index approximate grain size classes, when available (from Rivera-Hernández et al., 2019). Phyllosilicate interlayer water (the lower temperature 100-300 C emission observed by SAM) and bound OH (the higher temperature 650-800 C emission observed by SAM) likely contribute to ChemCam measured H in the Murray Formation (Sutter et al., 2017). In this region, distinct alteration halos have been observed that crosscut the Murray/Stimson contact (Frydenvang et al., 2017).
In the case of the Sutton Island/Blunts Point transition, this may be due to changing water depth or shoreline location (Lanza et al., 2019). We also applied our methods to previously identified hematite exposures in Gale Crater (Fraeman et al., 2013).
Mars Science Laboratory Observations of Chloride Salts in Gale
Methodology
- Mineralogy
- Quantification of chlorine and halite
- Emplacement models and implications
The site detection of CRISM-type hematite is in Valles Marineris (Roach et al., 2010; Viviano-Beck et al., 2014). 3 of the 25 images that did not meet our success criteria were flagged by Roach et al. Hematite occurs irregularly in kaolinite layers above Fe/Mg smectite layers (Figure 5; Ehlmann et al., 2009).
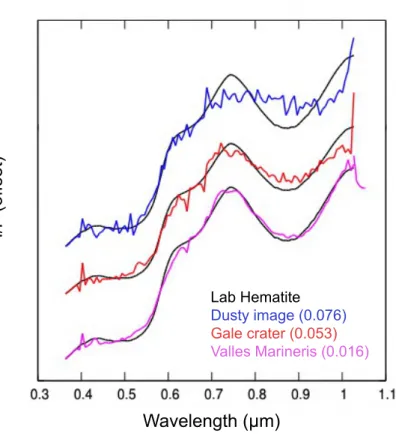
Regardless of the end piece used as a “test spectrum” in target transformation, the modeled fit will have absorptions with wavelength centers true to the data set (Amador et al., 2018). Orbital mapping using the TES instrument previously detected coarse-grained (> ~5–10 µm diameter particles) gray (specular) hematite in Meridiani Planum and Iani Chaos (Christensen et al., 2000; Glotch and Rogers, 2007).
A search for sedimentary iron formations on Mars using
Survey Methods
- Compact Reconnaissance Imaging Spectrometer for Mars
- Factor Analysis and Target Transformation
- Candidate Sedimentary, Stratified Outcrops
Iron oxides have four characteristic absorptions in the visible part of the spectrum, caused by electronic ligand field transitions and charge transfers. The combined analysis of eigenvectors together with the associated eigenvalues provides a good indication of the number of independent components in a set of mixed spectra, and whether the eigenvectors represent true variation or spectral noise. Factor analysis differs from principal components analysis (PCA) because it is based on a generative model and focuses on the off-diagonal elements of the covariance matrix.
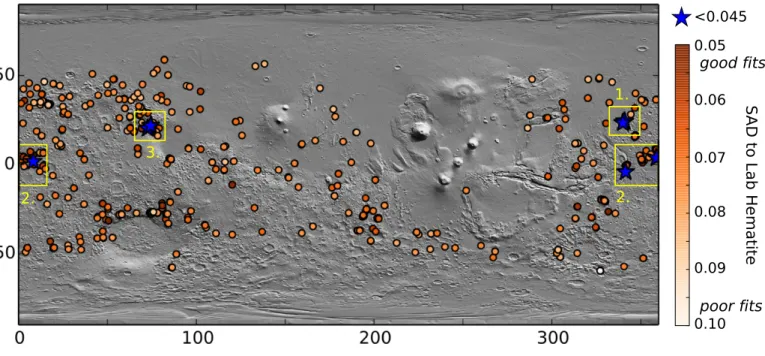
In practice, target transformation is a linear least-squares fit of the significant eigenvectors to an endmember test spectrum. By visual inspection of the target transformation fits, we selected a cutoff of SAD < 0.045 as a threshold for detection.
Validation
We further narrow our search to only Noachian and Hesperian age terrains (Tanaka et al., 2014) to coincide with the time when iron formations formed on the early Earth and because this is the time period when Mars may have been lost most of its atmosphere and has experienced climate change. The SAD for the modeled fit with hematite at Gale does not meet our defined detection threshold, indicating that it may be conservative and miss small outcrops such as Vera Rubin Ridge. To test whether our methods were simply detecting the presence of Martian dust, we applied the wavelength (μm).
To test the effectiveness of our methods in comparison with previous techniques, we applied factor analysis to 65 of the images studied by Roach et al. These false negatives are likely due to differences in sampling - we apply our methods to 1 out of every 3 pixels in every 3 rows, so small exposures can be missed.
Results
- Global Distribution
- Mawrth Vallis
- Iani Chaos and Meridiani Plaum
- Nili Fossae
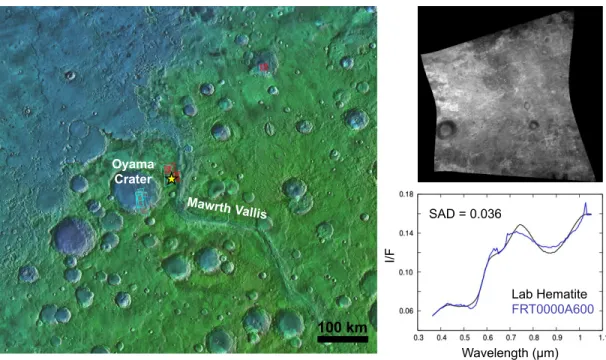
Mawrth Vallis region of interest with images searched in red and images meeting the detection threshold (SAD < 0.045) shown in blue. In addition, some candidate outliers are located in nearby chaos sites, most notably Iani Chaos. Iani Chaos and Meridiani Planum region of interest with searched images shown in red and images meeting the detection threshold (SAD < 0.045) shown in blue.
We find good modeled matches for laboratory hematite in 5 of the 27 CRISM images we examined in the region. Nili Fossae region of interest with searched images shown in red and images meeting the detection threshold (SAD < 0.045) shown in blue.
Discussion
- Evaluation of Methods
- Regions of Interest
- Global Distribution and Implications
Later work with OMEGA and CRISM showed that finer-grained (~10 nm to ~5 µm) red hematite is also present in the chaos regions and the areas around Meridiani (Bibring et al., 2007). Detailed studies of the geologic settings of the Chaos Regions, Meridiani, and Valles Marineri interior layered deposits led to the idea that hematite was deposited by secondary diagenetic processes associated with regional groundwater upwelling (e.g., Roach et al., 2010). Haematite has previously been detected using CRISM and OMEGA at Mawrth Vallis within Al-rich and sometimes the underlying Fe/Mg phyllosilicate layers (Wray et al., 2008; . McKeown et al., 2009; Bishop et al., 2013).
Mawrth Vallis has experienced a complex water history, and the observed hematite may record subsequent diagenetic processes such as intense leaching (Greenberger et al., 2012). If the first alternative is true, despite the negative outcome, our study yields a significant result that refutes a previous hypothesis (Bridges et al., 2008; Burns et al., 1993; Fallacaro and Calvin, 2006; Schaefer, 1996) and implying an oxidized atmosphere on early Mars.
Conclusions
Reconstructing past depositional and diagenetic processes through quantitative stratigraphic analysis of the Martian sedimentary rocks. I tested the robustness of the analytical methods developed in the laboratory by applying them to the Mars-ChemCam data to study H and Cl. Our work implies that hematite was not previously missed due to the underutilization of the CRISM visible wavelengths; rather, may be crystalline iron oxides.
Deciphering the evolution of Mars' climate and waters will require even higher resolution orbital mineralogical data to constrain the timing of aqueous mineral formation and its relationship to other geological events. Future missions like Mars 2020, including sample returns, could provide crucial fine-scale details needed to decipher the evolution of Mars' climate and watery history.
Summary, Implications, and Outstanding Questions
Methodologies for large spectral datasets
Measuring H was not straightforward in the natural samples and predicted future challenges with the Mars ChemCam data. Roughness, grain size, and sample cohesion all affect the expression of the H peak, including peak height, shape, and width. In the future, laboratory studies should measure and quantify the impact of physical matrix effects.
138 In addition, I adapted and applied semi-automated statistical methods to search for specific minerals in the large, noisy CRISM data set. Factor analysis and measure transformation methods have previously worked well for fitting narrow VNIR absorptions (Thomas and Bandfield, 2017), but it was uncertain whether the same methods would work for the broad absorptions of the visible.
Gale crater’s environmental history
The CRISM S dataset is subject to less detector noise than the CRISM L dataset and is useful for mapping igneous minerals such as olivine and pyroxene as well as Fe mineralogy such as hematite. Future global studies enabled by factor analysis and target transformation methods may reveal new discoveries regarding the composition of Mars. I also applied analytical LIBS methods developed for measuring Cl to report the distribution of chloride salts at Gale Crater.
One of the motivating challenges I raised was to disentangle primary from post-depositional fluids to inform our understanding of past environments at Gale: as seen from our H and Cl studies, this is an ongoing challenge. Our work identifying multiple intervals of elevated H implies a rich history of water-rock interaction at Gale.
The fate of Fe and aqueous alteration on Mars
If these phases are primary, both imply that Curiosity measured an interval characterized by increased salinity, potentially due to changes in water depth or shoreline location (Lanza et al., 2019). Akaganeite and jarosite are both measured by CheMin (Rampe et al., in preparation) and are consistent with ChemCam measurements of elevated FeOT and H. Chaos terranes and in the internal deposits of Valles Marineris strata (e.g., Christensen et al., 2000; Roach et al., 2010; Hurowitz et al., 2010; McLennan et al., 2005; Tosca and McLennan , 2006).
In Mawrth Vallis, hematite is mainly associated with Al-rich and sometimes Fe/Mg-rich phyllosilicate layers (e.g., Bishop et al., 2013; Wray et al., 2008) and likely formed by leaching area intensive. We searched for hematite only in candidate sedimentary, layered outcrops (representing ~20% of available CRISM images).
Synthesis
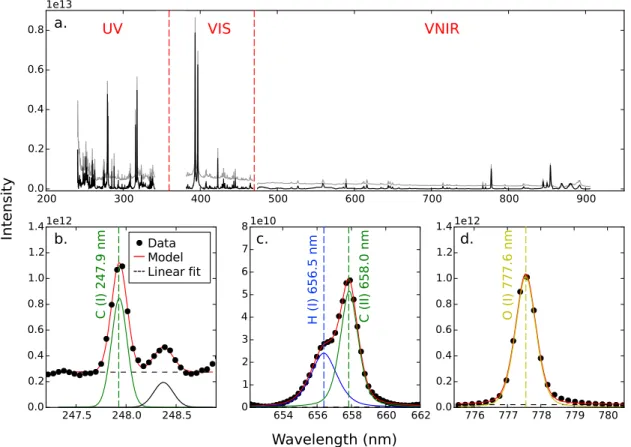
- Example laboratory spectrum
- Thermogravimetric analysis
- LIBS H peaks
- Hydrogen peak area versus weight percent
- Hydrogen peak area versus weight percent, bound OH
- Shot-to-shot variation
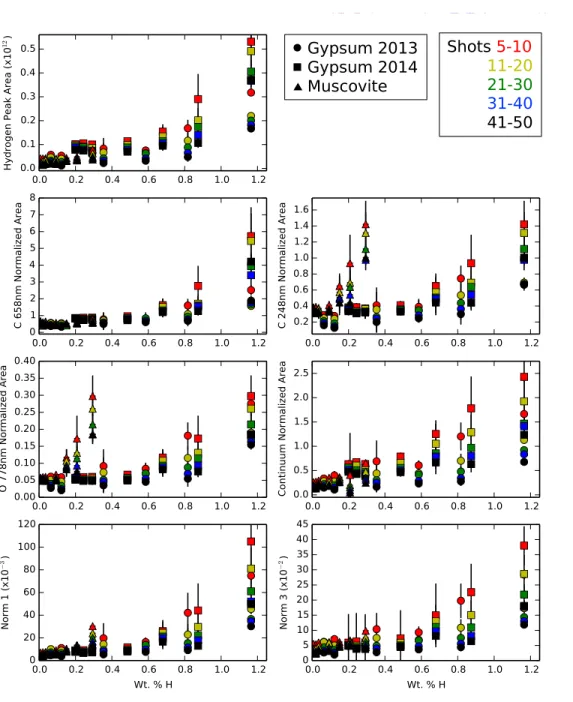
- Calibration curve variation with shot range
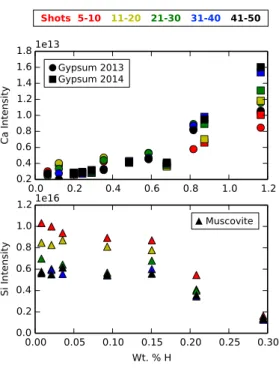
- Ca and Si emission
- LIBS H peaks of natural samples
- Physical matrix comparison
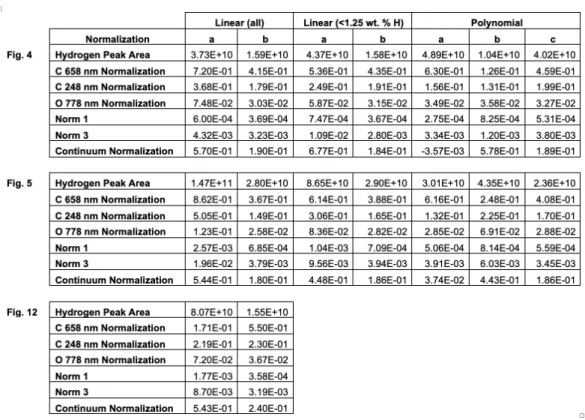
- Calibration curves for natural samples
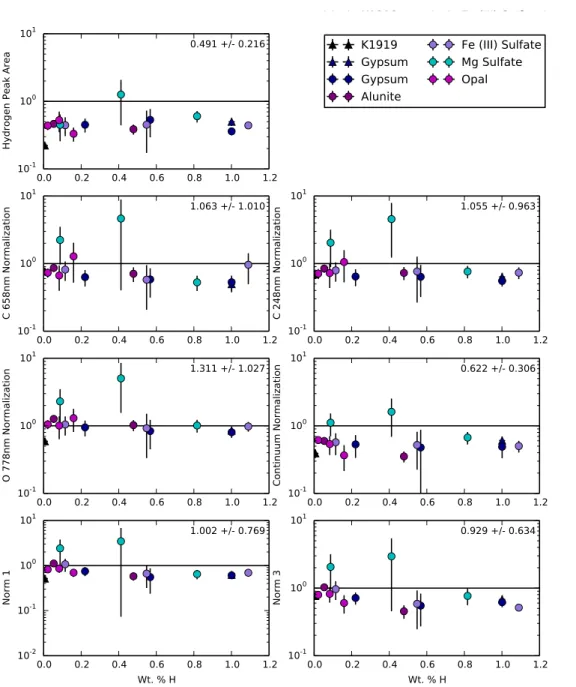
- Peak area ratios
- ChemCam vein H distribution
- ChemCam bedrock H distribution
In the future, a global search of all CRISM images may find hematite in other geologic settings and help resolve open questions regarding iron formations on early Mars. What ancient phyllosilicates in Mawrth Vallis can tell us about possible habitability on early Mars. Detection of crystalline hematite mineralization on Mars with a thermal emission spectrometer: Evidence for near-surface water.
Variable Redox Conditions in Gale Crater as Indicated by Manganese Abundance along the Curiosity Traverse. Identification and refinement of Martian surface mineralogy using factor analysis and target transformation of near-infrared.
H boxplots
Stratigraphy, H, Gini, and composition comparison
Major oxide chemistry
Principal components analysis
Example target images
Cl in Gale crater summary
Images of targets containing chlorides
Cl versus Na 2 O, CaO, and MgO
Potential emplacement scenarios
Validation examples
Region of interest: Mawrth Vallis
Region of interest: Iani Chaos and Meridiani Planum adjacent
Region of interest: Nili Fossae