Although it makes up only a small fraction of the cosmic ray flux, and of the solar system. The abundances of the chemical elements in the solar system as compiled by Anders and Ebihara (1982). A schematic graph of the nuclides adapted from Norman and Schramm (1979) showing the pathways of the r-process and the s-process.
The light diagonal lines are intended to represent the beta decay of the results of r-process nucleosynthesis. 124Te and 130Xe cannot be produced by the r-process because they are protected from the beta decay of the r-process pathway by 124Sn and 13C>re, respectively. The proton-rich nuclei on the left side of the valley of beta stability cannot be produced by either the r or the s process.
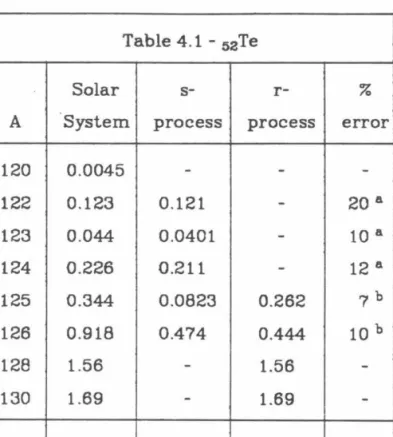
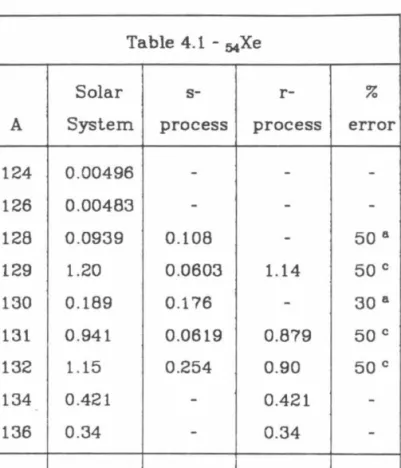
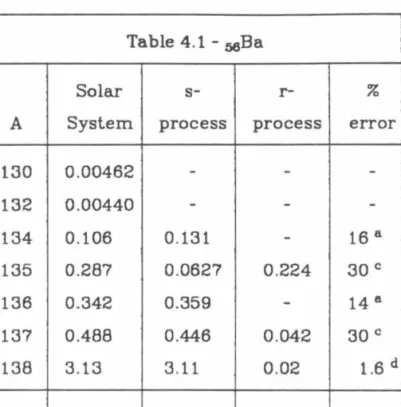
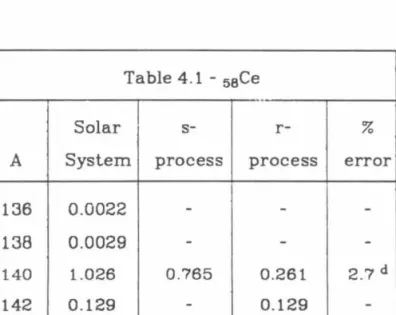
The validity of the process model s can be tested by examining it. the ability to reproduce known abundances of isotopes only s. A decomposition of the solar system material into r and s process contributions using the solar system abundances of Anders and Ebihara (1982) and the s process of Kappeler et al.
ATOMIC NUMBER
Finrt. Pass Analysis
In the first pass at data analysis, no attempt was made to be selective, but instead as many events as possible were converted from their raw form, such as telemetry from the satellite. Convert the wire patterns of the instrument hodoscopes into trajectories using known dimensions for the wire and hodoscope spacing. Those events that have inconsistencies in the thread patterns that prevent reliable trajectory construction are classified separately from the good trajectory events for future consideration.
Converts raw ion chamber pulse heights, from the pseudologarithmic pulse height analyzers (PHA), to sigaal in femto-coulombs. Normalizes both ion and Cerenkov signals to signal per unit path length using trajectory information and measurements made before launch of the thickness of the Cerenkov beams. These estimates are based on the fact that the ratio of the Cerenkov signal to the ion signal is.
For 54% of the time period reported here, ZC alonoe was also used to select high loading events. Due to the subsequent criteria of the ion chamber and the Cerenkov arrangement and the distance of the threshold from the actual charge region, this distinction is irrelevant for this analysis.
High Charge Subset
Observation of the iron peak position showed that the ion chamber time variation was less than 0.2/'~. Both the ion chamber and the photomultiplier tube reaction were monitored on a daily basis for the duration of the flight. The agreement criteria were based on the location of the tube with respect to the particle's position at the mid-plane of the Cerenkov box.
Only a rough determination of location was used: whether the tube was in the same quadrant (or half) of the radiator as the particle. Histograms of the ratio of individual Cerenkov photomultiplier tubes to the average of all eight tubes. The bottom histogram is the same for tubes in the opposite X-half of the Cerenkov box (the "longest" tubes).
Crossplot of the ion chamber charge estimate versus the Cerenkov charge estimate for two days of data in the iron and sub-iron charge range. Crossplot of the relationship between ZC and ZI as a function of ZC for two days of iron data. Schematic diagram of the selected "tree" used to categorize events based on interactions.
Histogram showing the effect of the two-module agreement criterion on the high-charge, high-stiffness data set. Histogram and cross-plot against ZC of the agreement between Cerenkov and ion chamber charge estimates (ZDEL) for single-radiator events in Figure 3.9. For events on the low side of the ZDEL distribution, ZC should still be a valid cost estimate.
However, examination of the single radiator events separately reveals no significant difference between this and the two radiator events for the particles in the Sn-Ce region. The width and number of events classified as interactions are similar to those of the two module high cutoff events (Figure 3.6). Such effects, while not insignificant from iron (2=26) to tin (Z=50), should be insignificant in the relative amounts of the.
Furthermore, all questionable trajectory events (58 in the Sn-Ce region) previously included in the dataset were eliminated here. The results for the relative abundances of the even elements did not differ significantly between the two methods.
DISCUSSION
- Overview
- Preferential Acceleration
- Cosmic Ray Propagation
- Summary
To separate the contributions of the s- and r-processes in the solar abundances, we must decompose them according to the scheme discussed in Chapter I. A histogram of the abundances of the even charge elements in the 50Sn to 58Ce region. The s-process (left) and r-process (right) components of the solar system in the region 50Sn - 58Ce using Kappeler et al.
As a result, the sum of the r-process and the s-process is not necessarily equal to the value of the solar system. 1971) since, for a number of cores, the cross sections were equal to the values derived from: from the uN - N table in Kappeler et al. A further complication for determining the abundances of cosmic ray sources arises from the possible effects of preferential acceleration.
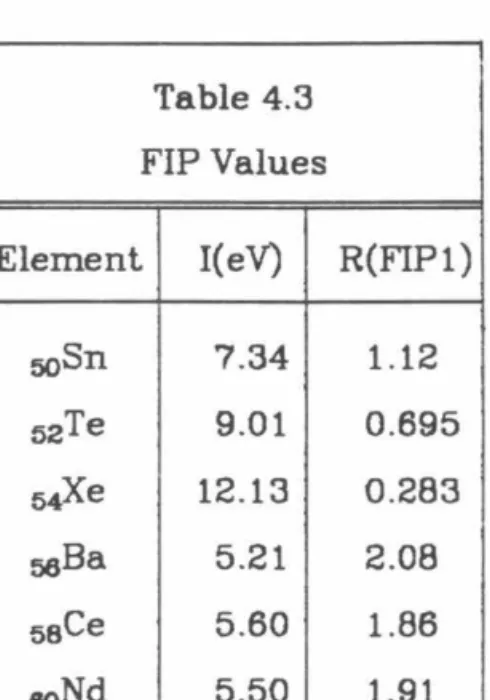
Plot of the ratio of cosmic ray source abundances to solar system abundances as a function of the element's first ionization potential. Details of Brewster, Freier and Waddington's calculation can be found in their article. The number in parentheses is the fraction of observed abundance assumed to be surviving prt-mar.
Comparison of the data with the results of propagation of a Solar System-type source, a pure s-process source, and a pure r-process source derived from abundances by Anders and Ebihara (1982) and the s-process by Kappeler et al. Comparison of the data with the results of propagation of a Solar System-type source, a pure s-process source and a pure r-process source derived from abundances by Anders and Ebihara (1982) and the s-process by Kappeler et al. Since we will only be concerned with the relative abundances of the elements in this region, the added factor of 0.5 is inconsistent.
Contributions to x2 for each element as a function of the mixing parameter f discussed in the text. Contributions to x2 for each element as a function of the mixing parameter f discussed in the text. We cannot choose between FIP and no FIP cases based on the current data.
The ledge-cliff structure seen in Figure 4.2 is a function of the magic number isotope cross sections along the process path s. 1968, "A New Table of the Abundance of Elements in the Solar System," in Origin and Distribution of the EleTnents, ed.