Article 1
Toward evidence-based Local Food Policy: an agroecological
2assessment of urban agriculture in Rome.
3Davide Marino 1, Francesca Curcio 1,*, Francesca Benedetta Felici 1, Giampiero Mazzocchi 2 4
1 Dept. of Biosciences and Territory, University of Molise; 86100 Campobasso, Italy; [email protected] , 5
[email protected], [email protected]. 6
2 Dept. of Agricultural Policies and Bio-Economics, Council for Agricultural Research and the Analysis of 7
Agricultural Economics, 00187 Rome, Italy; [email protected] 8
* Correspondence: [email protected] 9
Abstract: Recent crises have highlighted the vulnerabilities of global supply chains and, conse- 10 quently, a profound need for food system transformation. In this scenario, Local Food Policy and 11 agroecology arise as two different but converging paradigms capable of fostering an inclusive and 12 sustainable transition of the food systems, especially in the urban contexts. The purpose of this pa- 13 per is to strengthen the relationship between these two paradigms by proposing agroecological as- 14 sessment as a tool for formulating evidence-based Local Food Policies. Considering the city-region 15 food system of Rome (Italy) as a reference context, the paper proposes an adaptation of the TAPE 16 model on a sample of 20 farms to analyze urban agriculture and understand the extent to which it 17 contributes to the transformation of the food system. Data processing shows that, in the city-region 18 context of Rome, agroecological principles are not fully adopted by the majority of farms. In addi- 19 tion, farms with the highest agroecological level are those driven mainly by social factors and have 20 a lower propensity for innovation. This could be read as a constraining aspect because it hinders 21 and slows down the transformation process of food systems. However, these data turn out to be 22 essential to the implementation of Local Food Policy and in identifying pathways toward sustaina- 23
bility. 24
Keywords: food-policy; agroecology; assessment; urban agriculture. 25 26
Citation: To be added by editorial staff during production.
Academic Editor: Firstname Last- name
Received: date Revised: date Accepted: date Published: date
Copyright: © 2023 by the authors.
Submitted for possible open access publication under the terms and conditions of the Creative Commons Attribution (CC BY) license (https://creativecommons.org/license s/by/4.0/).
1. Introduction 27
Recent crises, such as the Covid-19 pandemic, the Russian-Ukrainian conflict, the cli- 28
mate crisis, and growing food insecurity, have highlighted the vulnerabilities of global 29 supply chains and, consequently, a profound need for food system transformation. 30
Over the last decades, the concept of Local Food Policy and agroecology have gained 31 increasing relevance in the international scientific audience due to the emerging global 32
challenges facing our planet (climate, biodiversity, hunger, inequalities). They are pro- 33 gressively more accepted as sets of knowledge and practices that can convert entire food 34 systems by bringing together the environmental, economic, and social dimensions of sus- 35 tainability and adopting a bottom-up approach based on the local knowledge and partic- 36
ipation. 37
Agroecology recognizes the interrelationships between people, agriculture and na- 38 ture and the empowerment of farmers [1]. On the other side, Local Food Policies promote 39 the systemic approach and the inclusion of food issues within all policy areas, including 40
environment, health, and social inclusion [2]. Finally, both paradigms attempt to chal- 41
lenge the cultural and structural power dynamics existing in the current food system by 42 reinforcing the self-organization of food producers and consumers. 43
The goal of this article is to demonstrate the potential of the link between these two 44
paradigms to transform food systems toward sustainability. In particular, the article 45
Land 2023, 12, x. https://doi.org/10.3390/xxxxx www.mdpi.com/journal/ijerph
ASUS
2023-11-23 23:33:40
--- The words "Local Food Policy" should be changed to lowercase. This applies to any word in the paper that is not an abbreviation.
ASUS
2023-11-23 23:34:50
---
What does "TAPE" stand for? The author s
hould specify it at the beginning.
Land 2023, 12, x FOR PEER REVIEW 2 of 16
proposes an agroecological assessment methodology applied to urban agriculture in the 46
city-region food system of Rome (Italy). The research provides an adaptation of the Per- 47
formance Assessment Tool in Agroecology (TAPE) developed by FAO in 2019. The survey 48 was given to a sample of 20 farms adhering to ‚Alveare che dice Sì‛ - a short food supply 49
chain organization in Rome. 50
The results of the application of this methodology aim to inform the degree of agroe- 51
cological transition of the selected farms, with particular attention to the relationship be- 52
tween city and countryside. The findings are noted to be relevant to the formulation and 53 evaluation of the Local Food Policy of the city of Rome, demonstrating that agroecological 54
assessments might be essential to formulate evidence-based food policies and transform 55
the food system. 56
This article is structured in three parts. The first part presents the theoretical frame- 57 work (1) of the analysis, first presenting the paradigms of Local Food Policy and agroe- 58 cology in separate sections, and then focusing on the synergies between these two prac- 59
tices. In this section, the research will also present the city-region food system of Rome, 60 which is the case study. This is followed by a second part dedicated to the explanation of 61 the methodology (2), that is the agroecological assessment adapted from the TAPE frame- 62 work [3]. In the third section, the results (3) deriving from the application of the method- 63
ology to the sample of farms will be presented. Finally, some discussions and conclusions 64
will be outlined. 65
1.1. Theoretical framework 66
1.1.1. Local Food Policy 67
Local Food Policies (or Urban Food Policies) are defined as processes through which 68
cities envision change in their food systems and in how they strive to achieve this change 69 [4] (p. 6). Specifically, Local Food Policies are characterized by a strong systemic and cross- 70 sectoral approach, which considers the interconnections between the social, environmen- 71 tal and economic dimensions. In attempting to transform the food system, Food Policies 72
aim to bring about changes in the various sectors, such as education, health, social ser- 73
vices, public procurement, economic development, land use and agriculture. 74 Moreover, in the empirical contexts in which Food Policies were implemented, new 75
governance dynamics occurred, such as participatory processes involving actors from 76
civil society, public institutions, and private sector. 77
According to Sonnino [5], Urban Food Policies in Europe and North America are dis- 78 tinguished by four key characteristics, representing a significant change from the past. 79 First, they are characterized by a systemic vision, which means embedding food issues in 80
all policy areas. Second, they promote a concept of "new localism", since they emphasize 81 the territorial dimension and considers the ‚city-region food system‛. Some scholars and 82 practitioners [6] identify in the city-region food system a new "geographic entity" denot- 83 ing a target area which goes beyond the administrative boundaries of the city and includes 84
ecological and social connections with the surrounding area. Third, they foster a type of 85
participatory governance that promotes community capacity-building and new govern- 86 ance dynamics, for example through Food Councils [7]. Finally, "trans-local" networks are 87 emerging – such as the Milan Urban Food Policy Pact (MUFPP)-, capable of extending the 88
relevance of Food Policy both geographically and politically. 89 Finally, we can say that Urban Food Policies aim to democratize and transform food 90 systems by empowering citizens and facilitating their participation in food policy devel- 91
opment and implementation. 92
1.1.2. Agroecology 93
Over the last 20 years, the concept of agroecology has gained increasing relevance in 94 the international scientific audience. It is becoming a basis for converting entire agri- 95
food systems by bringing together the several of sustainability [8] and adopting a bottom- 96 ASUS
2023-11-23 23:38:12
--- The problem gap in the introduction is not optimal. Ideally, there needs to be an
explanation that compares normal conditions with the existing situation.
For example, the local food policy implemented for the case study in Rome with the concept of local food at the global level.
ASUS
2023-11-23 23:40:35
--- The theoretical framework is a separate section to the introduction. The theoretical framework is created into a new chapter or outside the introduction. You may consider the reviewer's directions.
Land 2023, 12, x FOR PEER REVIEW 3 of 16
up approach based on the knowledge and natural resources of local communities for ag- 97
ricultural production (Nicholls and Altieri, 2018). Agroecology recognizes the interrela- 98
tionships between people, agriculture and nature and the empowerment of farmers [1], 99 due to its multidimensional nature: as a science, as an innovative agricultural practice and 100 as a grassroots socio-political movement of small-scale producers [9]. 101 Agroecology is rooted in practices, ecological farming projects, and phenomena of 102 resistance to the spread of industrial agriculture by indigenous farmers in Latin America 103 [10, 11, 12]. In 1928, Bensin [13] used this expression to refer to the application of the prin- 104 ciples and concepts of ecology to agriculture. Starting in the 1970s, in response to the ho- 105 mologation dictated by the Green Revolution, agroecology began to take on connotations 106 of an ideological nature, advocating an ecological view of agriculture through the inclu- 107 sion of the concept of agroecosystem, understood as a harmonious combination of natural 108 and artificial ecosystems. In the 1980s, attention was focused on the concept of ‚sustaina- 109 bility‛ related to the agricultural sector, as a model capable of protecting natural resources 110
[14]. 111
In the 1990s, agroecology began to take on a social character in connection with crit- 112 ical reflection on food consumption patterns [15], focusing on the interrelationships be- 113 tween production, distribution, and consumption. In 2007, Gliessman redefined agroecol- 114 ogy as a science that applies ecological concepts and principles to the design and manage- 115 ment of sustainable agri-food systems [16]. Several sets of agroecological principles have 116 been produced in the scientific literature [17, 18, 19, 20, 21, 22], the most recent including 117 those formulated by CIDSE [23], FAO [24] and INKOTA [25]. 118 The implementation of these principles is useful not only to reduce the use of non- 119 renewable resources [26], but also to activate endogenous development dynamics. In this 120 context, agroecology proposes the foundations for defining new areas such as the food- 121 shed and alternative food networks [27, 28], both of which address the sustainability of 122 food systems. In 2018, the FAO, recognised agroecology as a significant approach to 123 achieving the sustainability goals of agricultural and food systems, intercepting the 10 124 elements as a guide for policymakers, farmers and other stakeholders involved in plan- 125 ning, managing and monitoring the agroecological transition [24]. 126 In 2019, a high-level expert group defined the 13 principles of agroecology (HLPE, 127 2019) needed to operationalize the agroecological approach in the Performance Assess- 128 ment Tool in Agroecology (TAPE) methodology including: reuse of waste; reduction of 129 input use; soil health, animal health and welfare; biodiversity; synergy; economic diversi- 130 fication; knowledge co-creation (interaction between local knowledge and global science); 131 social values and dietary regimes; fairness; connectedness; land and natural resource 132
management; and participation (Figure 1). 133
134
Land 2023, 12, x FOR PEER REVIEW 4 of 16
135 Figure 1. The correspondence within the 10 FAO elements, the 13 HLPE principles and the 5 136
Gliessman levels. Source: [29]. 137
1.1.3. Synergies between Food Policy and Agroecology 138
According to Gliessman [16], the agroecological transformation of the agri-food sys- 139
tem passes through a process consisting of five steps: 140
1. increasing input use efficiency; 141
2. replacing conventional inputs and practices with agroecological alternatives; 142 3. redesign the agroecosystem on the basis of a new set of ecological processes; 143 4. restoring a more direct connection between producers and consumers; 144 5. building a new global food system based on participation, locality, equity and justice, 145 where only the last three steps are recognized as having real transformative capacity. 146 Considering these steps, agroecology offers a new multidisciplinary approach to 147 transform food systems at territorial level, considering the interconnections between di- 148 mensions (i.e. social and economic) and sectors (i.e. production and consume). According 149 to the agroecological approach, urban contexts and urban-rural relations assume a central 150 role and become places of interest for all activists and researchers engaged in issues per- 151 taining to agrarian issues and agroecological transitions [30, 31, 32, 33]. 152 Therein lies the convergence between food policy and agroecology: both aim at an 153 inclusive and sustainable transformation of the food system, reconsidering the intercon- 154 nection between social, environmental and economic dimensions (See Table 1). Not only 155 that, but they also take into account a territorial approach, based on local knowledge and 156 participation, countering asymmetric power dynamics in the food system. However, 157 while the former provides suitable governance tools to support the transition (i.e. Food 158 Policy Councils, participatory decision-making processes), the latter offers ecological 159 principles to make food production and consumption more sustainable. 160 In empirical contexts, experiences in the field of urban agroecology [34] and farmers' 161 participation in Local Food Policies for food system have converged and marked the rise 162 of a new research agenda aimed at linking food sovereignty and urban movements. 163 Specifically, urban agroecology, understood as the expansion of urban agriculture, 164 promises to overcome the unsustainable link between rural and urban-periurban activi- 165 ties [35]. This activity is considered central to both agroecology practices and Food Policy 166
implementation. 167
Thus, considering the convergence of these two practices in transform the city-region 168 food system, this article aims to demonstrate how one can be functional to the other, par- 169 ticularly in the assessment and formulation of evidence-based policies. 170 171
Land 2023, 12, x FOR PEER REVIEW 5 of 16
Table 1. Convergences between Local Food Policy and Agroecology. Source: [36]. 172 Food Policy principles Gliessman’s model principles
1. Promoting healthy and balanced diets Equity, justice
2.Accessibility to healthy diets Equity, justice
3. Recognizing the value of food sustainability Participation, democracy 4. Developing short supply chains and diversifica-
tion
Equity, justice, democracy
5. Waste reduction Equity, justice
6. Adequate income levels for producers Equity, justice, participation 7. Promoting the sustainable use of resources Participation 8. Promoting specific territorial and landscape fea-
tures
Participation, democracy 9. Strengthening urban-rural linkages Participation, democracy 10. Participatory and shared governance Democracy, participation, equity, justice
1.1.4. The city-region food system of Rome 173
Through a series of fragmented processes, the city of Rome has always been charac- 174 terized by strong links between the urban population and local agriculture, until recent 175 decades, when long industrialized food chains have become increasingly dominant [37], 176 breaking down that traditional link between city and countryside. The weak commitment 177 of the public sector, however, failed to stop the strong will of informal groups and organ- 178 izations engaged in the attempt to create collective democratic dynamics for the transfor- 179 mation of the local food system [38]. There is a lot of excitement in the Roman context with 180 rapidly growing initiatives aimed not only at supporting conscious actions in line with 181 the 2030 Agenda for Sustainable Development, but also aimed at building coordination 182 between the different actors in the urban food system. In fact, the bottom-up process of 183 the city's Food Policy, which involves a wide range of actors willing to build more resilient 184 and sustainable development models, is being carried out. The proposal for a Food Policy 185 for Rome stems from the desire of the promoting committee to bring together people and 186
realities active in different spheres. 187
In 2019, the Terra! Association and Lands Onlus launched 'A Food Policy for Rome' 188 [39], an analysis and mapping of the Roman food system that aimed to highlight its criti- 189 calities and prospects, presenting the institutions with 10 operational principles to initiate 190 a food policy aimed at sustainability, the protection of local producers and the right to 191 food. This event marked the beginning of a formal dialogue between the municipality and 192 the group that culminated in the unanimous approval of the Capitoline Assembly in 2021 193 of Resolution 38/2021 laying the foundations for a food policy. Resolution 38 consists of 194 the same principles outlined in the proposal and includes a commitment by the munici- 195
pality to: 196
the formulation of a strategic document of the Food Plan with vision, principles and 197
guidelines (Art. 2); 198
the establishment of the Food Council (Art. 3); 199
the establishment of a technical office for the implementation of the Rome Food Pol- 200
icy (Art. 4). 201
On 23 February 2022, the provisional Food Council took office, chaired by the Presi- 202 dent of the Environment Commission of the City Council, which initiated the creation of 203 7 working tables related to the 10 operational objectives (Figure 2) of the proposal docu- 204 ment well depicted by Marino and Mazzocchi [39] in the article 'The Evolution of Food 205
Policy in Rome: Which Scenarios?’. 206
207 208
Land 2023, 12, x FOR PEER REVIEW 6 of 16
209 Figure 2. Connections between the working tables of the Food Council and the objectives envisaged 210
in Resolution 38/2021. Source: [40]. 211
As we can see from Figure 2, the Table 2 'Access to resources, local production and 212 agroecology' is of considerable weight since it is simultaneously connected to several Food 213 Policy objectives. Therefore, Food Policy aims to use the agroecological approach to sup- 214 port innovation in local food systems through the involvement of different actors. 215 Turning our attention to the agricultural side, on the other hand, the municipality of 216 Rome, the largest agricultural municipality in Italy, has a millenary agricultural and food 217 history with 45% of the area consisting of agricultural land. The relationship between the 218 city and its Agro, Roman productions, markets, operators, companies, and gastronomic 219
traditions represent identity elements of the city [41]. 220
The strong pressure of urbanization between 1990 and 2000 caused a 42% reduction 221 in the utilised agricultural area (UAA); this trend was reversed between 2000 and 2010, 222 with an increase in UAA of 14% [40] and a further increase of 5.72% between 2010 and 223 2020. To date, a very important aspect that characterizes agriculture in our country and 224 which is also reflected at the regional and municipal level is represented by a dichotomy 225 regarding the size of farms and the UAA [42, 43], i.e. fewer but larger farms. The latest 226 agricultural census [44] draws attention to the ongoing process of concentration of agri- 227
cultural entrepreneurship. 228
The report confirms that the average size of farms has doubled over the period 1982- 229 2020 in terms of UAA (from 5.1 to 11.1 average hectares per farm) and SAT (from 7.1 to 230 14.5 average hectares per farm). Shifting our gaze to the territorial boundaries of the Mu- 231 nicipality of Rome, through an elaboration of regional data from 2020 and 2010 and mu- 232 nicipal data from 2010 (Figure 2), it was possible to calculate an estimate of the municipal 233 data in 2020 of the number of farms and UAA by UAA classes (from 0 to 19.99 hectares 234
and from 20 to over 100 hectares). 235
The estimated data tell us that there are 1,966.62 farms in 2020 with a decrease of 236 25.96% compared to 2010. Similarly, the UAA of small farms in 2020 is 7,353.24 with a 237 percentage change of -8.34 compared to 2010, while the UAA of large farms is 40,344.35 238 with a positive percentage change of 10.23. In relation to the distribution of holdings by 239 classes of utilized agricultural area, holdings between 0 and 19.99 hectares occupy 15.42% 240 of the UAA compared to 84.58% of large holdings (> 20 and over 100 hectares). This shows 241 that there is a strong prevalence of large farms (Figure 3), which are smaller in number 242
but hold a high percentage of the UAA. 243
244
245
Land 2023, 12, x FOR PEER REVIEW 7 of 16
100%
90%
80%
70%
60%
50%
40%
30%
20%
10%
0%
Small farms <20 ha Large farms >20 ha
451
547.10
35,249.70 40,344.35
2,205
1,419.52
8,021.90
7,353.24
Number of farms Number of farms 2010-2020
UAA UAA
2010-2010
Figure 3. Comparison of agricultural enterprises and utilized agricultural area (UAA) in Rome in 2010 and estimation for 2020 (% and VA)1.
246 247 248
Similarly, according to the latest ISPRA report [45], Rome is the city that consumes 249 more soil on average than other cities, over 90 hectares, since 2006. In 2021, the city lost 250 95 hectares of previously natural or semi-natural soil and more than half of the soil con- 251 sumption can be traced back to a form of transition classified as building site areas. In the 252 same year, Rome also consumed soil for new built-up areas and for the expansion of 253
quarry areas and paved areas for car parks or yards. 254
The observation of soil consumption is necessary because it is a phenomenon that 255 generates negative effects on climate change such as the loss of ecosystem functions, the 256 increase of extreme phenomena and the modification of albedo and consequent positive 257 forcing (heat islands). In a scenario like the one in Rome where there is a lot of land con- 258 sumption and land is increasingly concentrated in a few hands, the agro-ecological tran- 259 sition of urban and peri-urban agriculture acquires full relevance with respect to the im- 260
plementation of food policy. 261
In essence, as part of a transformative process of the urban food system, the agroeco- 262 logical approach would lead to the reorganization of the material flows, social and eco- 263 nomic relations of the city-region food system context. In this sense, in this paper we 264 found it interesting to understand and analyze a sample of companies representative of 265 the Roman territory in order to verify the existence or absence of complementarities be- 266 tween the agroecological model and food policy. Furthermore, the data show us that the 267 implementation of agro-ecological principles by companies is certainly essential, but in 268 order to increase the significant impact on the entire ecosystem, a greater involvement of 269
large companies that hold more UAA would be inevitable. 270
2. Materials and Methods 271
To investigate agroecological transition at the farm level, the FAO has developed the 272 TAPE framework, launched in 2019 [3]. The TAPE (Tool for Agroecology Performance 273 Evaluation) model as a performance evaluation method in agroecology is based on several 274 existing evaluation frameworks. TAPE is a comprehensive tool that aims to measure the 275 multidimensional performance of agroecological systems across different dimensions of 276
1 The decision to classify farms into 2 categories (small size up to 19.99 hectares and large size > 20 hectares) is related to the characterization of the Italian agricultural sector.
Land 2023, 12, x FOR PEER REVIEW 8 of 16
sustainability, in different contexts and at different scales, with the aim of supporting spe- 277 cific policy development in this regard. It uses a household and farm scale approach, but 278 also captures information and provides results at the territorial level [3]. 279 TAPE is based on the analytical framework called MESMIS (The Evaluation of Nat- 280 ural Resource Management Systems) [46], a reference evaluation framework generally 281 used in Latin America, which provides principles and guidelines for the quantification 282 and integration of context-specific indicators through a multi-stakeholder participatory 283 process. In our work, TAPE is the basic methodological tool from which we started to 284 carry out the agroecological analysis on the Roman territory. 285 Considering that the TAPE model was created to measure the multi-dimensional per- 286 formance of developing countries’ agroecological systems across the different dimensions 287 of sustainability, this work envisaged a re-adaptation of it to the western context and more 288 specifically to the territorial food system of the city of Rome. The research considered a 289 sample of 20 farms belonging to the ‚Alveare che dice sì!‛ (from here on ‚hives‛, as ‚al- 290
veare‛ translates in ‚hive‛). 291
It is a short food supply chain experience, comparable to a Solidarity Purchasing 292 Group, in which there are no intermediary relationships. Producers and consumers meet 293 in presence for the selling, thus favoring direct relationships. The choice of farms was 294 made considering that they belong to an innovative type of short food supply chain in 295 which environmental, relational, social, and economic objectives should be fully inte- 296 grated. Our hypothesis is that these farms’ features contain elements from which valid 297 principles can be extracted to guide the agroecological transition of the Roman agro-food 298
system. 299
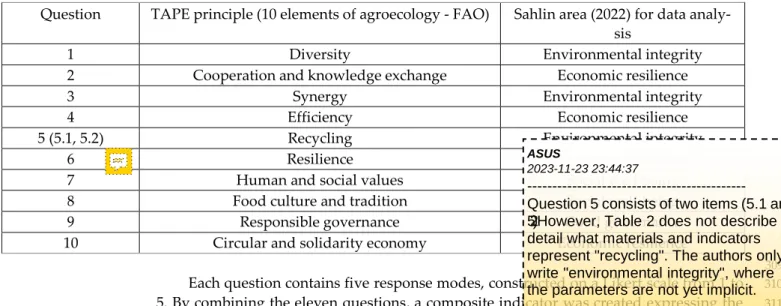
The questionnaire was administered in the period September-October 2022, to farms 300 and processing companies in the Lazio area that fall within one of three hives: ‚Marconi 301 Roma‛, ‚Roma Monteverde‛, and ‚Roma bio appetito Spinaceto‛. The structure of the 302 questionnaire was organized in 3 sections: a farm descriptive section, an agroecological 303 section; a section on the importance of participation in the hive. In the second section, 304 eleven questions were asked, corresponding to the ten agroecological principles of TAPE 305 [3] and covering the four areas identified by Sahlin et al [47] (see Table 2). 306 307
Table 2. Questions, TAPE principles, and areas for data analysis considered for the questionnaire. 308 Question TAPE principle (10 elements of agroecology - FAO) Sahlin area (2022) for data analy-
sis
1 Diversity Environmental integrity
2 Cooperation and knowledge exchange Economic resilience
3 Synergy Environmental integrity
4 Efficiency Economic resilience
5 (5.1, 5.2) Recycling Environmental integrity
6 Resilience Economic resilience
7 Human and social values Social well-being
8 Food culture and tradition Social well-being
9 Responsible governance Good governance
10 Circular and solidarity economy Economic resilience
309 Each question contains five response modes, constructed on a Likert scale from 1 to 310 5. By combining the eleven questions, a composite indicator was created expressing the 311 agro-ecological gradient of the farm, which can range from 10 to 50 or from 0 to 100 when 312 expressed as a percentage. Based on the data obtained from the administration of the 313 questionnaire to the farms that are part of the ‚Alveare che dice sì!‛, it was possible to 314
investigate: 315
ASUS
2023-11-23 23:44:37
---
Question 5 consists of two items (5.1 and 5.2). However, Table 2 does not describe in detail what materials and indicators represent "recycling". The authors only write "environmental integrity", where the parameters are not yet implicit.
Land 2023, 12, x FOR PEER REVIEW 9 of 16
1. whether the agro-ecological model is found in farm management activities, i.e., 316
in peri-urban agriculture; 317
2. whether participation in the ‚hives‛ has induced changes in an agro-ecological 318
sense; 319
3. analysing the agro-ecological characteristics of farms in the Roman context, to 320 extract principles that can inspire and guide the directions of the food policy process. 321
3. Results 322
3.1. Farms structure 323
A total of 19 farms completed the questionnaire. Of these, 11 are sole proprietorships, 324 i.e. consisting of a single working partner, 6 are simple agricultural companies and only 325 one is a corporation. The average farm size expressed in TFA (Total Farm Area) is 31.4 326 hectares. Of these, 78.3% are Utilized Agricultural Area (UAA). It should be noted that, 327 among the farms considered, one has a TFA of 250 hectares, without which the average 328
would be 19.2 hectares. 329
As for the distribution of UAA, the first quartile is found at 2.65 hectares, the second 330 quartile at 7.5 hectares, and the third quartile at 25.5 hectares, thus highlighting the fact 331 that the sample is characterized by the presence of half of the farms with a size close to 332 the Italian average (8.4 hectares). It is observed a concentration of farms in the smaller size 333 classes: 40% have a UAA between 0 and 5 hectares, and the 30% between 5 and 20 hectares. 334 The larger farms (more than 20 hectares) concentrate almost 85% of the productive areas. 335 The distribution of holdings by type of land ownership is characterized by private 336 ownership in about half of the cases, while the other half is evenly distributed between 337 mixed ownership-rental and rent-only modes. Apart from a causal link between type of 338 ownership and farm size, which would have to be demonstrated, the UAA ranges from 339 11.7 hectares for rental, 26.9 for mixed modes and 33.4 in the case of land ownership. In 340 60% of cases, the farms have a production orientation based on vegetable crops (mixed 341 herbaceous and/or arboreal), and mainly market fresh products, but also processed prod- 342 ucts such as oil and products in oil, jams, fruit juices, bakery products, and wine. 343 The 20% are specialized in animal production with the production and marketing of 344 dairy products and processed meat (mainly pork and beef). The remaining 20% of the 345 farms have a mixed orientation with cultivation and breeding, and mainly market fresh 346 products of vegetable and animal origin, processed meat, cheese and oil. Only 20% of the 347 sampled farms produce PDO-PGI products. The 60% of the farms have adopted 'non-con- 348 ventional' production models (organic or biodynamic) while the remaining 40% adopt 349 conventional farming model. However, it should be noted that in the first group, non- 350 certified forms or Participatory Guarantee Systems prevail; in average, these farms have 351 an extension of less than 20 hectares. Smaller farms, having few financial resources to pay 352 for certification, and relying on trust (typical of direct sales), prefer to not have an organic 353 certification [48]. In terms of work units, the average is 3.8, of which about two thirds are 354
family members. 355
Thus, the farms in the sample are characterized by a marked prevalence of family 356 farming: in fact, about half of them employ only family workers, while in cases where 357 salaried labor is present, this exceeds family labor in percentage terms on one farm. In all 358 other cases where wage labor is employed, this amounts to about 41% of the total labor 359 units. The degree of multifunctionality, despite the farms fall fully under peri-urban agri- 360 culture [49], is modest: only the 26% has a complementary activity to primary production, 361 mainly focused on agritourism as supplementary source of revenue and internal re-utili- 362
zation of farm products. 363
3.2. Agroecological gradients 364
Table 3 gives the results of the questionnaire with respect to the ten agro-ecological 365 dimensions consistent with the TAPE theoretical reference model. Summing up, for each 366
Land 2023, 12, x FOR PEER REVIEW 10 of 16
question, the frequencies of the answers with the highest agroecological gradient (me- 367 dium-high and high), it emerges that the principles of Synergy and Food Culture and Tra- 368 dition are the ones most pursued by the farms surveyed (63% in both cases). Next come 369 Human and Social Values (58%), Cooperation and Knowledge Sharing, Efficiency, Re- 370 sponsible Governance and Circular and Solidarity Economy (53%). The lowest values, ob- 371 tained by summing the frequencies of the two response modes with the lowest agro-eco- 372 logical gradient (medium-low and low), are consistently achieved by the principle of Re- 373 newables (74%, only one company has significant renewable energy production). Not 374 very positive results also for the Recycling and Resilience principle (both 37%). 375 Table 3. Frequencies (expressed in %) of the five response modes for each principle. The agro-eco- 376 logical gradient is expressed by the colouring of the histograms, from the lightest (low gradient) to 377
the darkest (high gradient). 378
Diversification Recycle_Renewable Energy
40% 26% 26%
21% 21%
100%
68%
50%
5% 0% 5% 0%
0%
20%
5%
0%
Cooperation and Knowledge Sharing Resilience
50% 42% 40%
26% 26%
21%
16% 21% 21%
0%
20% 11% 16%
0% 0%
Synergy Human and Social Values
50% 42%
16% 21% 21%
0%
0%
40% 32%
26%
20% 16% 16%
11%
0%
Efficiency Food Culture and Tradition
50%
21% 16%
11%
0%
47%
5%
40% 32% 32%
26%
20%
5% 5%
0%
Recycle_Water Responsible Governance
40%
21% 21% 21% 21%
20% 16%
50% 42%
21% 16%
11% 11%
0% 0%
Circular and solidarity economy
Land 2023, 12, x FOR PEER REVIEW 11 of 16
379 On the basis of the response patterns recorded by each farm with respect to the ten 380 agro-ecological principles, it has been possible to obtain a synthetic indicator that assigns 381 a score on a gradient from 0 to 100. Subsequently, the farms were ranked on three levels 382 (low, medium and high), through a subdivision into tertiles. The results show a distribu- 383 tion of tertiles with the first level from 28.8% to 48.7%, the second from 48.8 to 60.0% and 384
the third from 60.1 to 100 (see Table 4). 385
Table 4. Tertiles, number of farms and agro-ecological level classification. 386
Tertiles N. of farms Agro-ecological level
28.8% - 48.7% 6 Low
48.8% - 60.0% 7 Medium
60.01% - 100% 6 High
387 Following the subdivision of the farms by low, medium and high agro-ecological 388 level, the average level for each agro-ecological principle of the farms belonging to the 389
same level was calculated (see Figure 4). 390
391
392 Figure 4. Synthetic gradients for each agroecological principle, per agroecological level classifica- 393
tion. 394
3.3. Farm strategies 395
An element little explored in the international literature is whether the path towards 396 agroecological principles leads to changes in business strategy. Or, in other words, 397 whether agroecology can represent a business strategy of adaptation to new market con- 398 ditions and new consumer needs, especially in urban areas. To this end, an indicator was 399
40% 26% 26%
21%
20% 16%
11%
0%
ASUS
2023-11-23 23:46:21
---
The source for tables and figures must be stated even though it is the output or
calculation result of the author's analysis.
Land 2023, 12, x FOR PEER REVIEW 12 of 16
first developed to summarize the motivations that led the companies to join the food short 400 supply chain of the ‚Alveare che dice sì‛. The questionnaire was structured to distinguish 401
between social and more strictly economic motivations. 402
In particular, the following reasons were considered strictly economic: guaranteeing 403 fair remuneration; improve market access. The motivations of a social nature are: social 404 commitment towards communities; desire to promote greater access to quality products; 405 desire to make consumers aware of their products and their approach. Considering the 406 entire sample, the motivations that pushed the farms to join the short supply chain system 407 under study are more of a social nature (desire to make the consumer aware of their prod- 408 ucts and their approach; desire to encourage greater access to quality products). 409 The least prevalent motivation is that relating to the search for fair remuneration. 410 Based on the prevalence of economic or social motivations, or a balance between the two, 411 farms have been classified into "Economic drivers", "Social drivers" and "Mixed drivers". 412 Figure 5 shows that higher agroecological level are correlated with a prevalence of social 413 drivers, while low and medium agroecological levels are more balanced and characterized 414
by a mix of motivations both economic and social. 415
416
100%
90%
80%
70%
60%
50%
40%
30%
20%
10%
0%
High Low Medium
Social drivers Mixed drivers Economic drivers
417 Figure 5. Correlation between agroecological level (High, Low and Medium) and the drivers to be 418 part of the "Alveare che dice sì" short food supply chain. 419
Another important aspect in order to explore the farms’ strategies in relation to join- 420 ing the ‚Alveare che dice sì‛ is the degree of innovation. For all surveyed farms, joining 421 the new sales channel has generated changes in business management and planning mod- 422 els. The most widespread innovation is corporate investments to access the short supply 423 chain, packaging and digital innovation. Much less widespread have been the develop- 424 ment of new production processes and, in no case, systems to guarantee better working 425 conditions for the workforce employed. However, also in this case it was possible to build 426 a synthetic indicator based on the innovations made with respect to a potential list, in 427 order to compare it with the agroecological level. Based on the responses received, four 428 innovation levels were created: Weak (only 1 innovation introduced), Medium-Weak (2 429 innovations introduced), Medium-Strong (3 innovations introduced), Strong (4 innova- 430 tions introduced). 11 farms have a Weak innovation level, 5 have a Medium-Weak level, 431 2 have a Medium-High level, and only one has a High level. 432 Figure 6 highlights that there is no direct correlation between a high agroecological 433 level and the innovation gradient introduced into the farm. On the contrary, it is found 434 that the only farm with a innovation gradient classified as Strong, falls into the low agroe- 435
cological level classification. 436
437
Land 2023, 12, x FOR PEER REVIEW 13 of 16
100%
90%
80%
70%
60%
50%
40%
30%
Strong
Medium-Strong Medium-Weak Weak
20%
10%
0%
High Low Medium
438 Figure 6. Correlation between agroecological level (High, Low and Medium) and the gradient of 439 innovations (from Weak to Strong) adopted to be part of the "Alveare che dice sì" short food supply 440
chain. 441
Finally, the degree of innovation and the drivers have been correlated (See Figure 7). 442 Also, in this case an inverse relationship is highlighted between propensity for innovation 443 and social motivations, while increasing the economic-mercantile component also in- 444 creases - albeit in the context of a generally low propensity for innovation - the degree of 445
innovation. 446
447
100%
90%
80%
70%
60%
50%
40%
30%
Strong
Medium-Strong Medium-Weak Weak
20%
10%
0%
Economic drivers Mixed drivers Social drivers
448 Figure 7. Correlation between degree of innovation and the drivers to be part of the "Alveare che 449
dice sì" short food supply chain. 450
4. Discussion and conclusions 451
The objective of this research work was to evaluate the potential relationship between 452 local food policies and agroecology through the application of an agroecological assess- 453
ment methodology. 454
ASUS
2023-11-23 23:50:36
--- I suggest dividing the discussion and conclusion sections separately. Apart from that, the discussion chapter is still weak.
The discussion should be
supplemented by a comparison of past publications with current empirical findings. Also, the conclusion chapter
Land 2023, 12, x FOR PEER REVIEW 14 of 16
Specifically, Gliessman's 5 levels start from transformations in agricultural produc- 455 tion to a broad food system transition, going in the same direction as local food policies. 456 Throughout the article, the agroecological level of a panel of peri-urban farms around 457 the city of Rome was measured. The research aimed to investigate in what type of farms 458 agroecological principles are most widespread and how agroecology matches up with 459
their business strategy. 460
The choice of a panel of farms working on proximity relationships (urban - rural link- 461 ages) is even more important because these relationships (which have always existed) to- 462 day are articulated in innovative and transformative ways and because they are at the core 463 of local food policies. The tool employed provides evidences for local food policy formu- 464 lation and evaluation, in the light of the fully integrated multiscale systems approach from 465 farm to region to globe that is necessary to enhance agroecology [29]. 466 Regarding the agroecological gradient of the farms, it appears that farms are evenly 467 distributed across the three levels (High, Low and Medium). Also, some agroecological 468 principles are pursued more than others (as, for example, Cooperation and Knowledge 469 Sharing, and Sinergy). About the drivers (Social, Economic or Mixed) of the farms to be 470 part of the "Alveare che dice Sì" short food supply chain, the results show that higher 471 agroecological levels are correlated with a prevalence of social drivers, while low and me- 472 dium agroecological levels are more balanced and characterized by a mix of both eco- 473
nomic and social drivers. 474
Regarding the innovations (from Weak to Strong) adopted by the farms to be part of 475 the short food supply chain, there is no direct correlation between a high agroecological 476 level, and the gradient of innovation introduced on the farm. On the contrary, it is found 477 that the only farm with an innovation gradient classified as strong falls into the low agroe- 478 cological level classification. About the connection between innovation and drivers, we 479 observe an inverse relationship between propensity to innovate and social motivations, 480 while increasing the economic-mercantile component also increases the degree of innova- 481 tion - albeit in the context of a general low propensity to innovate. 482 In a nutshell, farms with the highest agroecological level, have a less "economistic" 483 approach and are mainly driven by social factors. These farms have a lower propensity to 484 innovate than those motivated by economic drivers and low agroecological level. We ob- 485 serve a kind of polarization between economic and social motivations of farms, with the 486 former being more innovative and the latter characterized by a higher agroecological 487 level. Returning to theoretical assumptions, this agroecological analysis can inform the 488 Rome Food Policy on urban agriculture farms to shed light on their motivations and de- 489
gree of innovation. 490
Also considering these data against the context of urban and peri-urban agriculture 491 in Rome, we observe that there is a negative variation in the number of small farms and 492 most of the arable land belongs to large farms. From a Food Policy point of view, it may 493 be necessary to introduce tools to promote agroecology towards small farms, because not 494 all of them (as the research shows) have a sufficient agroecological level, but also towards 495 large farms since they are more prone to innovation and represent most of the urban and 496 peri-urban agriculture. In conclusion, the research emphasizes the importance that agroe- 497 cological transition should be promoted through a local food policy at all levels and 498 should not only go through drivers related to social factors but is supposed to be inte- 499 grated into the business strategies of farms of any size. 500 501 Author Contributions: Conceptualization, D.M.; methodology, D.M.; data curation, G.M., and 502 F.B.F.; writing—original draft preparation, F.C and F.B.F; writing—review and editing, F.C.; super- 503 vision, G.M. and D.M. All authors have read and agreed to the published version of the manuscript. 504
Funding: this research did not receive external funding. 505
Institutional Review Board Statement: Not applicable. 506
Land 2023, 12, x FOR PEER REVIEW 15 of 16
Informed Consent Statement: Informed consent was obtained from all subjects involved in the 507
study. 508
Data Availability Statement: Not applicable. 509
Acknowledgments: The authors are especially grateful for the cooperation provided by the ‘Alveare 510
che dice Sì’. 511
Conflicts of Interest: The authors declare no conflict of interest. 512
References 513
1. Anderson, C. R., Maughan, C., & Pimbert, M. P. Transformative agroecology learning in Europe: Building consciousness, skills 514 and collective capacity for food sovereignty. Agriculture and Human Values, 2018, 36: 531–547. 515 2. Hawkes, C., & Parsons, K. Brief 1: Tackling food systems challenges: the role of food policy. 2019. 516 3. FAO. TAPE Tool for Agroecology Performance Evaluation 2019 – Process of development and guidelines for application. Test 517
version, 2019, Rome. 518
4. Moragues, A., Morgan, K., Moschitz, H., Neimane, I., Nilsson, H., Pinto, M., Rohracher, H., Ruiz, R., Thuswald, M., Tisenkopfs, 519 T., and Halliday, J. Urban Food Strategies: the rough guide to sustainable food systems, Document developed in the framework 520
of the FP7 project FOODLINKS, 2013. 521
5. Sonnino, R. Urban food geographies in the global North. A RENEWED READING OF THE FOOD-CITY RELATIONSHIP, 2017, 522
39. 523
6. Blay-Palmer, A., Santini, G., Dubbeling, M., Renting, H., Taguchi, M., & Giordano, T. Validating the city region food system 524 approach: Enacting inclusive, transformational city region food systems. Sustainability, 2018, 10.5: 1680. 525 7. Gupta, C., Campbell, D., Munden-Dixon, K., Sowerwine, J., Capps, S., Feenstra, G., & Kim, J. V. S. Food policy councils and 526 local governments: Creating effective collaboration for food systems change. Journal of Agriculture, Food Systems, and Com- 527
munity Development, 2018, 8.B: 11-28. 528
8. Gliessman, S.R. Transforming food and agriculture systems with agroecology. Agriculture and human values, 2020, 37.3: 547- 529
548. 530
9. Toledo, V. M. La agroecología en Latinoamérica: tres revoluciones, una misma transformación. Agroecología, 2011, 6: 37-46. 531 10. Guzmán, E. S. La participación en la construcción histórica latinoamericana de la agroecología y sus niveles de territorialidad. 532
Política Y Sociedad, Madrid, 2015, 52 (2): 351–370. 533
11. Altieri, M.A., and Toledo, V.M. The agroecological revolution in Latin America: rescuing nature, ensuring food sovereignty and 534
empowering peasants. Journal of peasant studies, 2011, 38.3: 587-612. 535
12. Holt-Giménez, E. Campesino a campesino: voices from Latin America's farmer to farmer movement for sustainable agriculture. 536
Food first books, 2006. 537
13. BENSIN, B. M. Agroecological characteristics description and classification of the local corn varieties. 1928. 538 14. Belliggiano, A.; & Conti, M. L'agroecologia come formula di sostenibilità e recupero dei saperi locali. Perspectives on rural 539
development, 2019, 2019.3: 375-400. 540
15. Wezel, A.; Bellon, S.; Doré, T.; Francis, C.; Vallod, D.; David, C. Agroecology as a science, a movement and a practice. A review. 541
Agronomy for sustainable development, 2009, 29.4: 503-515. 542
16. Gliessman, S.R. Agroecology: The Ecology of Sustainable Food Systems, 2007, CRC Press, Boca Raton, Florida. 543 17. Reijntjes, C.; Haverkort, B.; Waters-Bayer, A. Farming for the future: an introduction to low-external imput and sustainible 544
agriculture. Leusden, NL: Ileia, 1992, 1992. 545
18. Altieri, M.A. Agroecology: the science of sustainable agriculture. Westview Press, 1995, Boulder, USA. 546 19. Altieri, M.A.; Nicholls, C.I. Agroecology and the Search for a Truly Sustainable Agriculture. Mexico: United Nations Environ- 547
ment Programme. 2005. 548
20. Stassart, P.M.; Baret, P.V.; Grégoire, J.C.; Hance, T.; Mormont, M., Reheul, D.; Stilmant, D.; Vanloqueren, G.; Vissser, M. L’agroé- 549 cologie: trajectoire et potentiel. Pour une transition vers des systèmes alimentaires durables. In: Agroécologie. Éducagri éditions, 550
2012. p. 25-51. 551
21. Dumont, B.; Fortun-Lamothe, L.; Jouven, M.; Thomas, M.; Tichit, M. Prospects from agroecology and industrial ecology for 552
animal production in the 21st century. animal, 2013, 7(6), 1028-1043. 553
22. Nicholls, C.I.; Altieri, M.A.; Vazquez, L. Agroecology: principles for the conversion and redesign of farming systems. J Ecosys 554
Ecograph S, 2016, 5: 010. 555
23. CIDSE. The principles of agroecology. towards just, resilient and sustainable food systems. 2018. https://www.cidse.org/publi- 556
cations/just-food/food-and-climate/the-principles-of-agroecology.html. 557
24. FAO. Los 10 elementos de la agroecología guía para la transición hacia sistemas alimentarios y agrícolas sostenibles. 2018. 558
http://www.fao.org/3/i90 37es/I9037ES.pdf. 559
25. INKOTA. Strengthening agroecology. For a fundamental transformation of agri-food systems. Position paper directed at the 560
German Federal Government. 2019. https://webshop.inkota.de/node/1565. 561
ASUS
2023-11-23 23:54:24
--- The existing references are good.
To increase the interest of readers with similar concentrations and work, it is best to add several publications from leading journals that are relevant to discussing the topic. In addition, the publication year of previous papers cited needs to be updated based on recent
developments.
Land 2023, 12, x FOR PEER REVIEW 16 of 16
26. Pretty, J. Agricultural sustainability: concepts, principles and evidence. Philosophical Transactions of the Royal Society B: Bio- 562
logical Sciences, 2008, 363.1491: 447-465. London. 563
27. PAÜL, V., MCKENZIE F.H. Peri-urban farmland conservation and development of alternative food networks: Insights from a 564 case-study area in metropolitan Barcelona (Catalonia, Spain). Land use policy, 2013, 30.1: 94-105. 565 28. RENTING, H., MARSDEN, T.K., BANKS, J. Understanding alternative food networks: exploring the role of short food supply 566
chains in rural development. Environment and planning A, 2003, 35.3: 393-411. 567
29. Ewert F., Baatz R., Finger R. Agroecology for a Sustainable Agriculture and Food System: From Local Solutions to Large-Scale 568 Adoption. Annu. Rev. Resour. Econ. 2023. 15:351–81. DOI: https://doi.org/10.1146/annurev-resource-102422-090105. 569 30. Tornaghi, C. Urban agriculture in the food-disabling city:(Re) defining urban food justice, reimagining a politics of empower- 570
ment. Antipode, 2017, 49.3: 781-801. 571
31. Vaarst, M., Escudero, A. G., Chappell, M. J., Brinkley, C., Nijbroek, R., Arraes, N. A., ... & Halberg, N. Exploring the concept of 572 agroecological food systems in a city-region context. Agroecology and Sustainable Food Systems, 2018, 42.6: 686-711. 573 32. Dyck, B. V., Maughan, N., Vankeerberghen, A., & Visser, M. Why we need urban agroecology. Urban agriculture magazine, 574
2017, 33: 5-6. 575
33. Weissman, E. Brooklyn's agrarian questions. Renewable Agriculture and Food Systems, 2015, 30.1: 92-102. 576 34. AA.VV. 2017. Urban agroecology. A thematic issue of the Urban Agriculture Magazine, No. 33. https://www.ruaf.org/ua-mag- 577
azine-no-33-urban-agroecology. 578
35. Juncos, M. A. Assessing Agroecological Principles at the Intervale in Burlington, Vermont: A Case Study and Multimethod 579 Research with a Participatory Approach in a Peri-Urban Socioecological System. 2021. 580 36. Marino, D.; & Viganò, L. Agroecologia e politiche del cibo: connessioni e sinergie nella ricerca di un processo di trasformativo 581 dei food system. In: Agroecologia circolare. Dal campo alla tavola. Coltivare Biodiversità e innovazione. ReteAmbiente srl, 2021. 582
p. 85-91. 583
37. Cavallo, A.; Di Donato, B.; Marino, D. Mapping and assessing urban agriculture in Rome. Agriculture and Agricultural Science 584
Procedia, 2016, 8: 774-783. 585
38. Ledant, C. Urban Agroecology in Rome. Urban Agriculture Magazine, 2017, 33. November. 586 39. Lands Onlus, Terra Onlus, Una Food Policy per Roma, 2019. https://www.politichelocalicibo.it/wp-content/up- 587
loads/2019/10/Una-Food-Policy-per-Roma.pdf. 588
40. Marino, D., & Mazzocchi, G. L’evoluzione della Food Policy a Roma: quali scenari?. Re| Cibo, 2022, 1.1. 589 41. Cannata, G., Cavallo A. Ripensare Roma e il suo sistema agroalimentare, in Rapporti Collana Ateneo, Unversitas Mercatorum, 590
Giapeto Editore, 2021. 591
42. Cavallo, A., Di Donato, B., Guadagno, R., & Marino, D. The agriculture in Mediterranean urban phenomenon: Rome food- 592 scapes as an infrastructure. In: Finding Spaces for Productive Cities. In: Proceedings of the 6th AESOP Sustainable Food Plan- 593
ning Conference.-AESOP/VHL. 2014. p. 213-230. 594
43. Cavallo A., Marino D. Assessing the connections between farming, food, and landscape planning in the development of sus- 595 tainable urban policies: the case of Rome. In: Proceedings of international conference on ‚changing cities‛: spatial, morpholog- 596
ical, formal & socio-economic dimensions. Grafima, Thessaloniki. 2013. 597
44. ISTAT. 7° Censimento generale dell’agricoltura, Istat, Roma, 2022. 598
45. Munafò, M. (a cura di), 2022. Consumo di suolo, dinamiche territoriali e servizi ecosistemici. Edizione 2022. Report SNPA 32/22. 599 46. López-Ridaura, S., Masera, O., & Astier, M. Evaluating the sustainability of complex socio-environmental systems. The MESMIS 600
framework. Ecological indicators, 2002, 2.1-2: 135-148. 601
47. Resare Sahlin, K., Carolus, J., von Greyerz, K., Ekqvist, I., & Röös, E. Delivering ‚less but better‛ meat in practice—a case study 602 of a farm in agroecological transition. Agronomy for Sustainable Development, 2022, 42.2: 24. 603 48. Cuéllar-Padilla, M., and Ganuza-Fernandez E. We don’t want to be officially certified! Reasons and implications of the partici- 604
patory guarantee systems. Sustainability, 2018, 10.4: 1142. 605
49. Marino, D., Mastronardi, L., Giannelli, A., Giaccio, V. and Mazzocchi, G. Territorialisation dynamics for Italian farms adhering 606 to Alternative Food Networks. Bulletin of Geography. Socio-economic Series, 2018, 40: 113-131. 607
![Table 1. Convergences between Local Food Policy and Agroecology. Source: [36]. 172 Food Policy principles Gliessman’s model principles](https://thumb-ap.123doks.com/thumbv2/123dok/11880953.0/10.893.119.839.159.436/convergences-policy-agroecology-source-policy-principles-gliessman-principles.webp)