Meanwhile, the risk profile will determine the effect of any behavioral bias on the bearish and bullish markets. This study initially argues that the risk profile will cause a significant difference in behavioral biases in bullish and bearish markets. The impact of a different risk profile will be greater in bullish and bearish conditions.
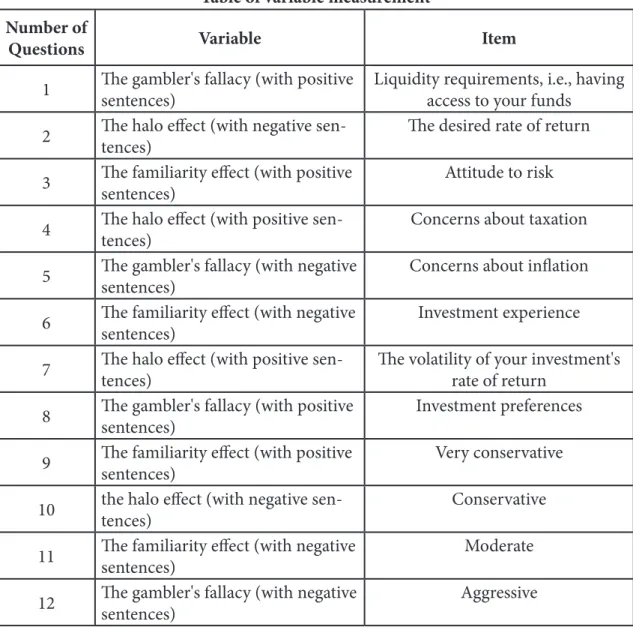
This study indicates differences in player error behavior in each risk profile category (ie very conservative, conservative, moderate and aggressive). Each category tested the mean value of each behavioral bias statement to find different behavioral biases based on the investor's risk profile.
Results
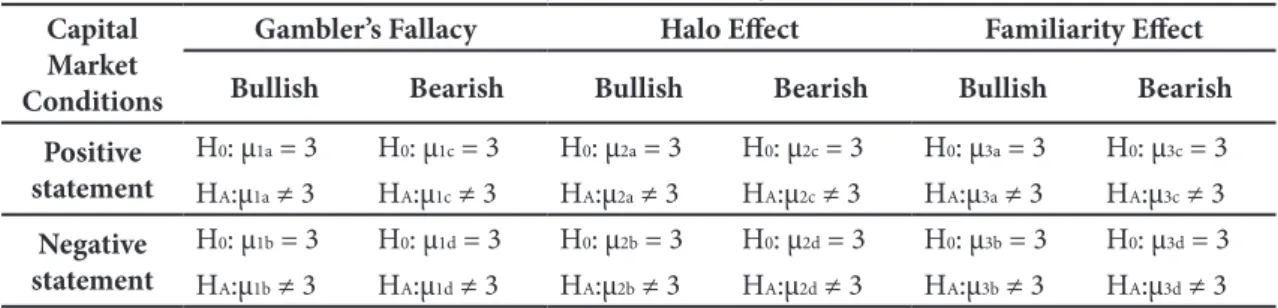
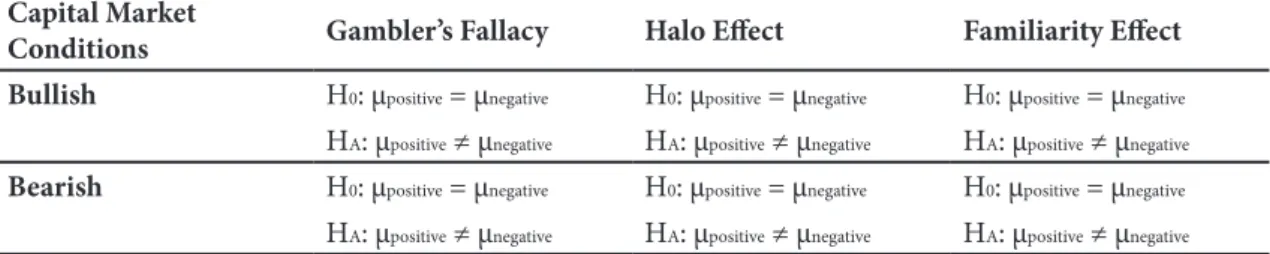
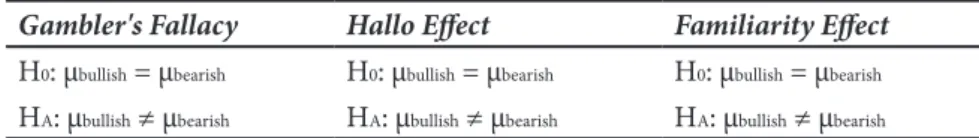
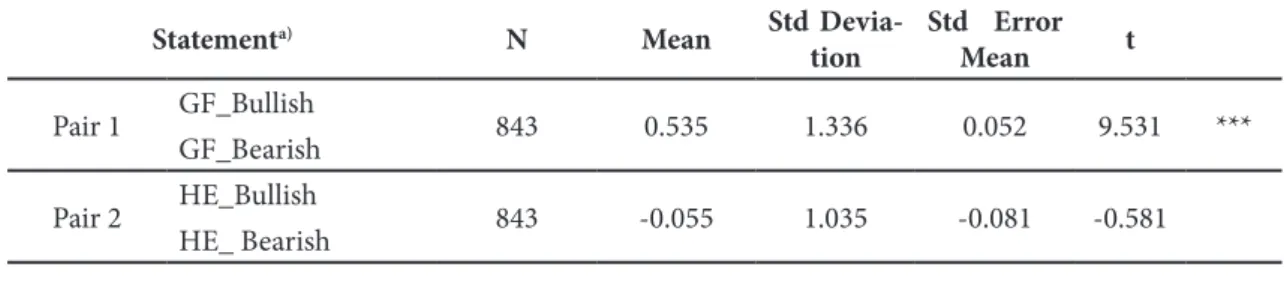
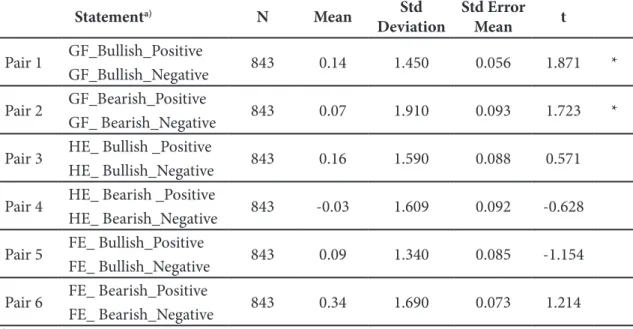
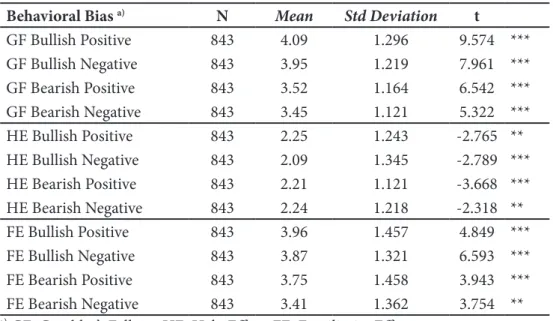
Suppose test statistics > tcritical, at α = 0.05, and it can be stated that there was a difference in the bullish and bearish markets, which would imply that the behavioral bias occurred in one of the capital markets' conditions (either bullish or bearish). Moreover, it showed that the gambler's fallacy and the familiarity effect would differ in bullish and bearish markets. Meanwhile, the halo effect group had no difference in behavioral bias between bullish and bearish statements.
In pairs 1 and 2, there was a significant mean difference between bullish and bearish markets for the gambler's fallacy. In pairs 3 and 4, there was no significant difference between the halo effect in bullish and bearish markets for a positive or negative statement. The survey results for the familiarity effect in bullish and bearish markets for four risk profile categories are shown in Table 9.
This study showed that the mean difference between bullish and bearish markets was positive, indicating that the familiarity effect was stronger in bullish than bearish markets. The very conservative, conservative and moderate categories had a greater difference between the bullish and bearish markets than the aggressive category. At the same time, bullish and bearish differences were lowest and most significant in the aggressive category.
Still, the behavioral bias in bullish and bearish markets was not too wide, indicating that aggressive investors tended to invest without considering bullish and bearish markets.
Discussion
Second, investors did not experience the halo effect in uptrends and downtrends (Djojopranoto & Mahadwartha, 2016). However, the results of the present study showed that investors partially experienced the halo effect when investing in bullish markets. According to Kumar et al. 2020), the halo effect can be eliminated by having experience, appropriate training and investor objectivity.
In this study, the halo effect has little impact on bullish investors. These findings indicated that investors had sufficient experience and awareness to avoid the halo effect. In their research, Gong and Du (2020) state that investor awareness of the halo effect can significantly reduce this behavioral bias during capital market transactions, both in bull and bear markets.
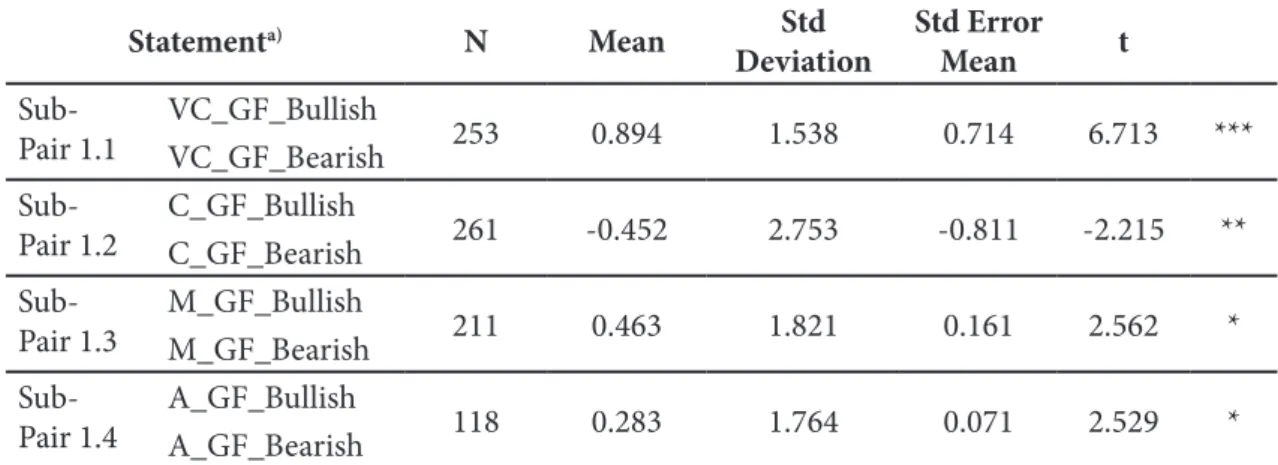
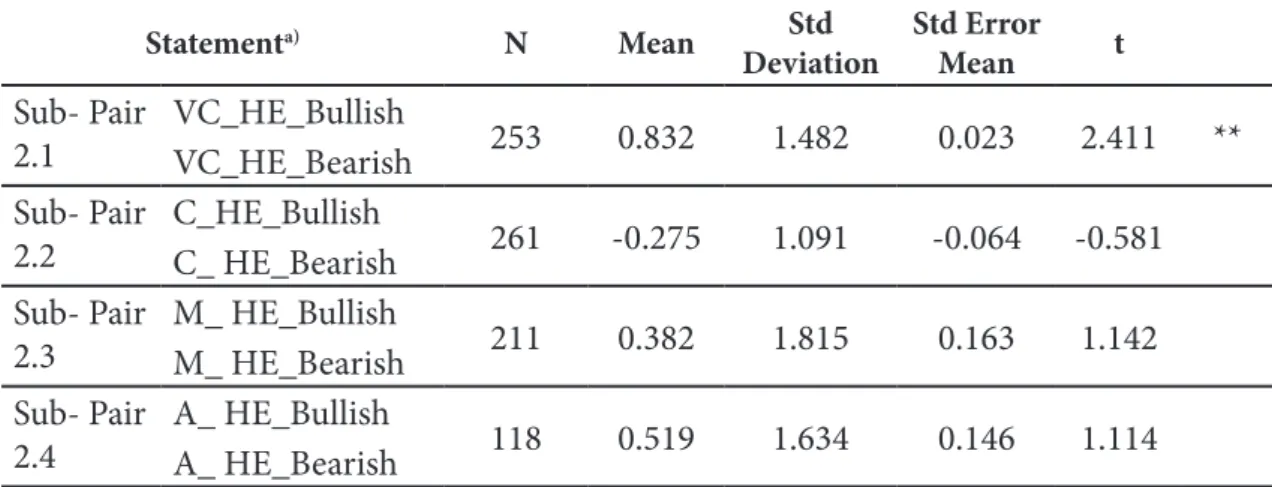
The results of this study contradict Yustina and Gudona (2017) and Tuyon and Ahmad (2016) regarding the halo effect on investors. The findings are consistent and show no difference for the halo effect in bull and bear markets, even with positive or negative statements. In terms of risk profile, the research findings showed that differences in the halo effect occurred only in the very conservative group, which was higher in bull markets than in bear markets.
For the other three risk profiles, there was no difference in the halo effect in bull and bear markets.
Conclusion
Bullish markets are believed to yield more significant profits and thus trigger a greater familiarity effect than bearish ones. Investors who experience the familiarity effect tend to concentrate their portfolios on the stocks they understand (X. Gong & Du, 2020), ignoring optimal portfolio diversification. In line with the prospect theory, investors in bullish markets tend to be more optimistic about the domestic capital markets and risk aversion (Hanna, 2018; Khalil et al., 2016; Madaan & . Singh, 2019).
Conversely, in bear markets, investors tend to be more aggressive, which allows investors to take risks by buying international stocks or stocks they have never known before, so that the familiarity effect that occurs is less ( Leal, 2018; Wahyu . & . & . Rahayu, 2017; Wijayanti et al., 2019). Findings regarding investor risk profile groups showed that the very conservative group experienced a higher familiarity effect than the conservative, moderate, and aggressive groups (Leal, 2018). Furthermore, when ranked by the mean difference between bull and bear markets, all investor groups experienced a more substantial familiarity effect in bull markets than in bear markets (X. Gong & Du, 2020).
Meanwhile, the familiarity effect occurs among investors who invest in bullish and bearish markets, with a more substantial magnitude in bullish than bearish. Overall, the behavioral biases prevalent among Indonesian investors are the gambler's fallacy and the familiarity effect. The limited ability to process information causes information asymmetry, which causes a representational bias characterized by the gambler's fallacy and the familiarity effect.
The highly conservative investor group tends to consistently experience the gambler's error and familiarity effect biases, while the conservative group experiences the gambler's fallacy bias in bear markets.
Limitation
Some investors tend to take transactional positions in bullish markets; intelligent investors should take the opposite position to achieve higher profits until the market reaches a saturation point. In bullish markets, investors feel familiar with the trend (the familiarity effect), so it is likely to increase the number of transactions and allow other investors to take profits more quickly. The present study has implications for investors' investment behavior in capital markets by proving that capital market conditions are highly influential when investing, especially in bullish markets.
Due to bullish markets, investors are biased in processing information, so they cannot make a rational analysis. When capital market conditions pick up, investors will feel more confident and overly optimistic; this is likely to trigger information asymmetry. This study is a reference for investors and capital markets in Indonesia because it proved that investors are prone to information processing biases and cannot make rational analysis when trading in uptrend and downtrend conditions.
The results of this research have implications for every investor with different risk profiles for investors in both bullish and bearish market conditions in Indonesia's capital markets. Bias occurs when investors obtain and process information such that the analysis performed is irrational and causes irrational behavior. In addition, this study is also expected to provide an overview and become study material for future researchers to conduct more in-depth research on similar topics, to bring more benefits to Indonesia's capital markets.
For future research, it is recommended to conduct research on representative models of the development of investors' decisions related to the cycles of Indonesian capital markets.
The impact of heuristic and herding biases on portfolio construction and performance: the case of Greece. 2018). Is the crowd sensitive to distance? – how investment decisions differ per type of investor. 2018). An up-down approach to identifying bull and bear market states. He, C., Mau, K., & Xu, M. (2021). Trade shocks and corporate hiring decisions: Evidence from job postings of Chinese firms in the trade war.
The effect of representativeness bias on investment decision-making The effect of representativeness bias on investment decision-making. An Empirical Investigation of Behavioral Determinants of Perceived Investment Performance: Evidence from the Karachi Stock Exchange. The size effect and stock behavior in expansion and contraction phases, empirical evidence from the Indonesian stock market.
Behavioral Finance in an Age of Artificial Intelligence: Longitudinal Case Study of Robo-Advisors in Investment Decisions. Investigative study of herd behavior of investors during bullish and bearish market: A case of Pakistan stock market. Attitudinal determinants of herding behavior adoption: An applied study in Egyptian exchange.
Pengaruh pembingkaian informasi terhadap respons investor terhadap kondisi pasar bullish dan bearish: sebuah eksperimen
Appendix
Moderate When evaluating your responses to the Investor Profile Questionnaire, your investment style suggests that you have some understanding of investment markets and their behavior. You don't want to see all your capital eroded by tax and inflation, and you're prepared to take a little short-term risk to achieve long-term capital growth. Your priority is consistent capital growth with some income to smooth out any volatility in your returns.
However, your general understanding of the investment market allows you to be comfortable with some short-term risks. This means that you want to have a moderate investment approach and that the most suitable investment strategy would include 60% income and 40%. Aggressive Judging by your responses to the Investor Profile Questionnaire, your investment style would indicate that you may be willing to sacrifice your investment capital in pursuit of the highest long-term capital growth investment.
You are most interested in maximizing the value of your investment(s) through long-term capital growth, although you do not want to make unbalanced investment decisions. You are comfortable with short-term volatility in your portfolio to maximize the potential for long-term capital growth. You have a good understanding of the behavior of investment markets and are interested in reducing your taxable income.
This indicates that you want to have an aggressive investment approach and the most appropriate investment strategy would involve 100% growth.