Eastern Illinois University
The Keep
Masters Theses Student Theses & Publications
2000
The Role of the Administrator in Creating an Inclusive Environment
Vicki S. Rasmussen
Eastern Illinois University
This research is a product of the graduate program inSpecial Educationat Eastern Illinois University.Find out moreabout the program.
This is brought to you for free and open access by the Student Theses & Publications at The Keep. It has been accepted for inclusion in Masters Theses by an authorized administrator of The Keep. For more information, please contact[email protected].
Recommended Citation
Rasmussen, Vicki S., "The Role of the Administrator in Creating an Inclusive Environment" (2000).Masters Theses. 1489.
https://thekeep.eiu.edu/theses/1489
THESIS/FIELD EXPERIENCE PAPER REPRODUCTION CERTIFICATE
TO: Graduate Degree Candidates (who have written formal theses) SUBJECT: Permission to Reproduce Theses
The University Library is receiving a number of request from other institutions asking permission to reproduce dissertations for inclusion in their library holdings. Although no copyright laws are involved, we feel that professional courtesy demands that permission be obtained from the author before we allow these to be copied.
PLEASE SIGN ONE OF THE FOLLOWING STATEMENTS:
Booth Library of Eastern Illinois University has my permission to lend my thesis to a reputable college or university for the purpose of copying it for inclusion in that institution's library or research holdings.
Author's Signature I Date
I respectfully request Booth Library of Eastern Illinois University NOT allow my thesis to be reproduced because:
Author's Signature Date
thes1s4 form
The Role of the Administrator
In Creating an Inclusive Environment BY
Vicki S. Rasmussen Eastern Illinois University
SUBMITTED IN PARTIAL FULFILLMENT OF THE REQUIREMENTS FOR THE DEGREE OF MASTER OF SCIENCE IN SPECIAL EDUCATION IN THE GRADUATE SCHOOL, EASTERN ILLINOIS
UNIVERSITY CHARLESTON, ILLINOIS
2000
I HEREBY RECOMMENDTHIS THESIS_ BE ACCEPTED AS
FULFILLING THIS PART OF THE GRADUATE DEGREE CITED ABOVE
4 • 13 ·
2.DODDATE
The Role of the Administrator In Creating an Inclusive Environment
Vicki S. Rasmussen Eastern Illinois University
I
Abstract
The role the administrator plays in the development of an inclusive environment was investigated by conducting a review of literature and conducting a study of administrative views of inclusion in one East Central Illinois school district. Results showed that the success of the implementation of an inclusive school environment depended upon the role that the
administrator was willing to play. Traits common to
administrators who were successful in fostering inclusion along with problems that may be encountered are discussed. Case studies are reviewed, collected data analyzed, and
recommendations for future practice are presented.
3
Table of Contents
Introduction ... 7
Review of Literature ... 8
Least Restrictive Environment and Inclusion ... 10
Inclusion ... 11
Planning for Inclusion ... 13
Implementing Inclusion ... 14
Problems Related to Inclusion ... 17
Benefits of Inclusion ... 20
Method ... 22
Subjects and Setting ... 22
Instrumentation ... 23
Procedures ... 26
Data Analysis ... 27
Results ... 28
School Demographics ... 28
Demographics of Principals ... 29
Leadership Style and Definition of Inclusion ... 31
Leadership Statements ... 32
Terms Selected as Essential to Administrators
Definition of Inclusion ... 35
Ratings on Statements of School Inclusiveness ... 40
Ratings of Educational Practices ... 42
Mean Ratings of Extent of Use of Educational Practices by Grade Level.. ... 43
Mean Ratings of Perceived Effectiveness of Educational Practices by Grade Level.. ... 48
Results of t-tests for the Extent of Use and Perceived Effectiveness of Educational Practices ... 53
Discussion ... 55
Definitions and Populations ... 56
Attitudes of Principals Towards Inclusion ... 58
Leadership Approaches of Principals ... 59
Limitations ... 59
Implications for Practice and Future Research ... 59
References ... 61
s
List of Tables
Table Page
1. School Demographics ... 28 2. Principal Demographics ... 30 3. Leadership Statements ... 32 4. Terms Selected as Essential to Administrators'
Definition of Inclusion ... 35 5. Ratings on Statements of School Inclusiveness ... .40 6. Mean Ratings of Extent of Use of Educational Practices
By Grade Level. ... 43 7. Mean Ratings of Perceived Effectiveness of Educational
Practices by Grade Level.. ... .48 8. Results of t-tests for the Extent of Use and Perceived
Effectiveness of Educational Practices ... 53
List of Appendices
Appendix Page
A. Survey ... 64 B. Cover Letter ... 72
CHAPTER ONE Introduction
Educating all students in the same classroom has caused heated debates between educators, parents, and students.
Administrators have been faced with problems of trying to please all parties involved. The success of an inclusive school
environment depended upon the role that the administrator was willing to play. This study attempted to identify traits that were common among administrators who were successful in
implementing inclusion within their school environment.
This study was similar to a study performed by Barnett &
Monda-Amaya (1998) who searched for administrative trends throughout the state of Illinois. Implications of this study showed that training in inclusive education is needed for all teachers, community support of inclusion is needed, and further research is needed concerning the benefits to regular and special education students in terms of academic achievement and social skill development.
CHAPTER TWQ Review of Literature
The Individuals with Disabilities Education Act (IDEA) mandates that all students be educated in the least restrictive environment. Questions arise as to the exact meaning of least restrictive environment and how this may affect the structure of the school environment when an inclusive setting is
implemented. The purpose of this chapter was to review the various definitions of inclusion, considerations of administrators when planning and implementing inclusion; to describe
leadership behaviors of administrators who were successful in implementing an inclusive school setting and the problems and benefits of effectively implementing inclusion.
While Barnett & Monda-Amaya (1998) performed their
research over the entire state of Illinois, this study was confined to a specific East Central Illinois school district in order to
compare an individual school district trend with larger individual state trends. This study contributed to the knowledge base of education by building on an understanding of inclusive practices
in individual school districts, as well as helpinq principals in individual school districts prepare for inclusion. While, generalization of these findings is not possible for all school districts, the results may be helpful to rural school districts throughout the United States because of the predominance of rural schools that did participate in the study.
This paper will explore the following statements and questions:
9
1. The attitudes and knowledge concerning the implementation of inclusionary practices of
principals in an individual East Central Illinois school district will be no different from the attitudes and knowledge of principals across the state of Illinois.
2. What "attitudes" do principals have toward inclusive education?
3. How do principals define "inclusion" and to which populations of students do they apply that
definition?
4. What leadership approaches do principals most
commonly exhibit? Does leadership approach influence how they define and react to the philosophy of inclusion?
5. What is the extent of use and perceived
effectiveness of activities and educational practices that are viewed in the literature as important for successful inclusive programs, (and how are they related to the roles of the principals)?
(Questions 3,4,5 &6 are taken from Barnett & Monda-Amaya, 1998).
Least Restrictive Environment and Inclusion
Understanding what the law mandates as Least Restrictive Environment (LEA) is important in understanding the ongoing debate involving inclusion. Arnold & Dodge (1994) quotes IDEA which states:
Each public agency shall insure: (1) That to the maximum extent appropriate, handicapped children, including
children in public or private institutions or other care facilities, are educated with children who are not
handicapped, and (2) That special classes, separate schooling, or other removal of handicapped children
11
from the regular educational environment occurs only when the nature or severity of the handicap is such that education in regular classes with the use of supplementary aids and services cannot be achieved satisfactorily (p. 23).
"However, the LRE mandate does not require school districts to place students in their neighborhood schools, let alone in the regular classroom, in all situations" (DeMitchell & Kerns 1997, p.
4).
Inclusion
The confusion over the exact meaning of LEA causes many different definitions of inclusion. Smelter, Rasch, & Yudewitz (1994) states that "Inclusion involves keeping special education students in regular education classrooms and bringing support services to the child, rather than bringing the child to the
support services" (p. 35). This type of an inclusive environment requires regular education teachers and special education
teachers to work together to provide services to the child.
Other definitions of inclusion also exist which in turn may cause some problems because of the different views held on the different definitions. Full inclusion, some believe, requires that the special education student spend all of their time in the regular classroom and that the regular education teacher teach all of the children without the help of the special education teacher (Smelter, Rasch, & Yudewitz, 1994). Still others believe that full inclusion means to include all children with special needs, while inclusion means to include some children with special needs. Mainstreaming, yet another term for inclusion, to some means that the student with special needs would attend some classes in the regular education classroom for a part of the day and return to the special education classroom for the rest of the day. Pull out programs, called "exclusion", do not play a part in inclusion and seem to be the only area that all
inclusionists agree upon (Smelter et al, 1994).
Parker & Day (1994) states that "inclusion refers not just to the provision of special services to meet academic and social needs in the general education classroom, but also to the
opportunity to participate in all areas of school life such as clubs, sports teams, or special programs" (p. 84). This definition
involves educating the whole child.
Planning For Inclusion
The first step for the administrator in developing an
inclusive school environment is to create a plan for implementing the program (Roach, 1994; Guzman, 1997). Roach (1994)
suggests administrators create "an opportunity for staff and community dialogue" (p. 21). "Separate forums typically are held for parents and community members, teachers, and district administrators" (Roach, 1994, p. 21). The forums allow for
questions and discussions by all members of the community, and are better when left in an open format rather than a briefing session (Roach, 1994; Parker & Day, 1997).
Task forces, designed to "study the issue, create public dialogue, and develop a plan for implementation" (Roach, 1994, p. 22) have also been successful in some school districts.
Community leaders, parents, students, teachers, and
administrators all may serve on these task forces, or the task
force may be composed only of teachers who are connected with the local bargaining unit. The superintendent usually heads the task force regardless of who the members of the committee are (Roach, 1994).
Implementing Inclusion
Guzman (1997) conducted a study of six elementary
school principals who were considered to be successful in setting up and running an inclusive school system. She found several factors that were common to each principal. These factors included:
1. Each principal had established a system of communication that allowed staff members to disagree with policies and practices and to
make recommendations for changes.
2. Each principal was actively involved in the IEP development process.
3. Each principal was personally involved in dialogue with the parents of students with disabilities.
4. Each principal worked with staff to agree collaboratively on a building philosophy of inclusion.
5. Each principal established policies for addressing specific discipline issues arising from students with disabilities.
6. Each principal had followed a personal plan of professional development that included issues associated with inclusion.
7. Each principal demonstrated skills in data gathering: listening, observation, and interpretation.
8. Each principal demonstrated skills in problem solving: assessing needs, planning action collaboratively, timely implementation,
gathering feedback, and evaluating results. (p.
6-8)
Parker & Day (1997) suggest defining the mission of the school as an important factor needed in the leadership goals of
the school principal. "Goals that are widely shared and
personally meaningful encourage educators toward a cohesive effort to achieve the school's mission" (Parker & Day, 1997, p.
85). Parker & Day (1997) also suggest that the "principal as instructional leader" (p. 87), needs to communicate the mission of the school, manage the curriculum and instruction between current instructional practices, student needs, and legal
mandates, supervise teaching, monitor student progress, and promote an instructional climate.
Katsiyannis, Conderman, & Franks (1996) state that the principal plays an important role in the success of an inclusionary school environment. "By allocating the necessary resources, providing inservice training, scheduling time for collaborative planning and preparation, and designing systematic program evaluation, principals can ensure the improvement of educational and social benefits for all learners." (p. 85) "The principal's role is pivotal in expanding opportunities for more inclusionary
programming while ensuring that students with disabilities receive services that have been carefully planned by the
placement team to meet their individual needs" (Katsiyannis, 1996, 85).
Problems Related to Inclusion
17
Problems do exist with inclusion. Providing the needed support staff, providing a curriculum that meets the needs of the students, budgeting, and teacher training are just a few of the problems that exist that the administrator must address before implementing an inclusive environment (Chesley & Calaluce, 1998; Roach, 1994). Another problem is the tensions that may exist between special educators and regular educators in dealing with the growing number of students who are diagnosed with special needs (Mawdsley, 1995).
The large percentage of minority children who are placed in the special education program is yet another problem
administrators need to face (Shanker, 1995). "As a result, many members of minority groups are vocal supporters of inclusion"
(Shanker, 1995, p. 21), and administrators need to be aware of the voice of the community in order to deal with this problem.
Cost is a major factor in setting up the inclusive
environment. Mclauqhlin & Warren (1994) state that some students may get "shortchanged" in regular classrooms because of the added expense required to provide specialized services outside of the classroom. Still others claim that the number of special education teachers will be reduced in order to save
money. Saving transportation costs for transporting students with special needs to a school farther away than their
neighborhood school is yet another factor (Mclaughlin & Warren, 1994).
A study was conducted in a school district in Clark County, Ind., focused on the cost of educating students with special needs in an inclusive school compared with a traditional school.
The results of the study found that $4,096 was spent per student with special needs in the inclusive environment and $4,267 was spent per student with special needs in the traditional school (Mclaughlin & Warren, 1994; Mawdsley, 1995). These costs included "teacher and aide salaries and fringe benefits, travel materials, supplies, and equipment" (Mclaughlin & Warren, 1994, pg. 18).
The Minnesota Department of Education also studied the cost of educating students with special needs. The results of the study found that the cost of educating regular and special
education students together was $550 for special education students and $381 for regular education students. This cost was after subtracting state funds for both groups of students and federal funds for special education students (Mawdsley, 1995).
Stress on the part of educators and administrators is another problem administrators must deal with when
implementing an inclusive environment. Baines, Baines, &
Masterson (1994) report in a study of one school district in Texas, that "all teachers contended that mainstreaming had increased the amount of stress in their lives" (p. 63).
Fox & Ysseldyke (1997) in a study of a middle school that set up an inclusive environment found several areas where
problems could exist if school change is to be implemented. They offer the following suggestions:
1. Allocate sufficient resources to the process.
2. Provide the staff with active leadership from
20
people who believe in, or at least, are really open to inclusion.
3. Convince the staff, at all levels that inclusion is not just the responsibility of special education.
4. Establish mechanisms to more efficiently learn from the process as it unfolds.
5. Provide the staff with the necessary training to do the job.
6. Seek to establish a shared sense of vision.
7. Actively promote the social acceptance of the included student.
8. Actively involve parents. (p. 95-96) Benefits of Inclusion
Proponents of inclusion indicate that the benefits of developing an inclusive environment benefit both the regular education students as well as the special education students (Gameros 1995). "Students with disabilities will develop regular peer friendships, a positive self-concept, and a positive attitude toward school, and will be motivated to achieve academically.
Regular education students will accept their special peers, develop friendships with them and develop a positive self- concept" (p. 16).
21
CHAPTER TH REE Method
22
This study was a descriptive study using a survey to measure administrator's views of inclusion in one cooperative made up of a number of schools in various school districts. The results of this study were similar to the original study conducted by
Barnett and Monda-Amaya (1998). Questionnaires were sent to every principal in the East Central Illinois Educational
cooperative.
Subjects and Setting
Surveys were sent to all principals, one superintendent- principal, and one assistant principal in the East Central Illinois Educational cooperative. This cooperative involves many small rural Illinois communities consisting of mostly individuals of Caucasian descent. The communities are small, yet larger communities are within 2 to 4 hours of driving distance. A community college is located in one of the cities and a university is located within another.
Instrumentation
The survey instrument was divided into four sections.
General background information was elicited in the first section regarding the individual school and the principal. Questions were asked to determine the types of special programs in the school, the background and professional preparation of the principal, and characteristics of the school.
The second section addressed the leadership approach most commonly used by each principal. Four statements were
provided that summarized four common models of school leadership and the principals were asked to choose the one statement that most accurately reflected their style of school leadership. These statements were:
(a) Above all, I try to develop clear role definitions and practice hierarchical decision making so that the school can be run more efficiently. The goal is to have a formal set of policies and procedures to which every employee can be held responsible.
(b) Above all, I try to make sure that all employees are
24 highly motivated and satisfied with their work. The goal is to nurture employees and develop a shared understanding about the goals of the group as we make important decisions together.
(c) Above all, I try to reconcile the conflicting interests of various groups through bargaining and
medication. The goal is to fashion a consensus on major issues among competing groups in the school and community.
(d) Above all, I try to develop a school culture that shapes the behavior of employees in desirable ways.
The goal is to encourage everyone to share in
'bottom-up' decision making within the context of my vision and symbolic leadership (Barnett & Monda- Amaya,1998).
Section three provided the principals' choices to choose from when defining inclusion. A list of terms was provided and the principals were asked to choose 5 that they considered were most essential to their definition of inclusion. In the next section
25
principals selected from a list of eight categories of special needs populations identifying students to whom they felt their
definition of inclusion would apply. The following categories were presented for the principals to choose from: learning disabilities (LO), at-risk for school failure, behavior disorders (BO), educable mentally handicapped (EMH), trainable mentally handicapped (TMH), severely or profoundly handicapped (SPH), physically/health impaired (PHI), and culturally diverse (Barnett
& Monda-Amaya, 1998).
The principals responded on a 4-point Likert scale (O=not at all; 3=completely) to the following statements:
(a) their attitudes toward inclusion,
(b) the degree of inclusiveness of their school, (c) the extent to which their school was working
toward becoming inclusive,
( d) how well prepared their teachers were for implementing inclusion,
(e) whether they felt inclusion could work in their schools, and
26
(f) whether the school community was supportive of inclusion (Barnett & Monda-Amaya, 1998).
In the final section of the survey, principals rated the extent to which 21 programs, activities, and strategies were being used in their schools and the extent to which they perceived those practices to be effective for inclusion. The educational practices and brief definitions were provided, followed by two columns. In column A, principals indicated the extent to which the practice was used in their school (0 = never; 1 = occasionally used; 2 = frequently used; 3 = routinely) and in column B, they rated the extent to which they perceived that practice to be effective for inclusion (0 = not at all; 1 =slightly effective; 2 = moderately effective; 3 = extremely) (Barnett & Monda-Amaya, 1998).
Procedures
Packets were mailed to each principal. Each packet
contained a cover letter explaining the purpose of the study, the survey instrument, and a self-addressed stamped return
envelope. A 50°/o return rate was desired on the surveys because of the limitations on time. The surveys were coded to
protect each respondent's identity and to provide a means for follow-up to those who did not respond within the prescribed time. Lack of time did not allow for follow-up to be
implemented.
Data Analysis
Descriptive statistics (percentages, means, standard
deviation) were used to analyze the first three sections of the survey (demographic information, leadership approaches, and definitions of inclusion) and paired t-tests were used to analyze item-by-item (p<. 0001) the extent of use and perceived
effectiveness. Overall differences between ratings of extent of use and perceived effectiveness of the 21 educational practices were analyzed using mean ratings and standard deviations for each item on the subscales.
27
CHAPTER4 Results
28
Of the 75 surveys sent, 37(49°/o) were completed and returned (one survey was returned but not completed): 22 (59°/o) from elementary schools, 1 (4°/o) from junior high
schools, and 14 (0/o) from high schools. Principals characterized their schools as being 86°/o (32) rural, 7°/o (2) urban, and 8°/o(3) suburban. This data is not representative of the 1990 census data which stated that 4 7°/o of Illinois schools are rural, 14°/o are urban, and 39°/o are suburban (Barnett & Monda-amaya, 1998).
Demographic information of the schools is shown in Table 1.
TABLE 1
School Demographics
Student population
Grades Rural Urban
(no. of schools)
Suburban Average Enrolled (range) (table continues)
29 Table 1 (continued)
Student population
Grades Rural Urban Suburban Average
Enrolled
(no. of schools) (range)
Pre-K-8(1) 354
Other (18) (110-750)
Junior high 5-8 1 230
6-8 (1) 7-8
High School9-12 (8) 13 1 388
5-12 (1) (47-1055)
K-12 (2) 7-12 (3)
Demographics of Principals
The majority of the respondents 35(94°/o) were school principals, 1(3°/o) was an assistant principal, and 1(3°/o) was a Special Education Superintendents. Fifty-four percent of the
respondents were male while 46°/o were female. The average age of respondents was 4 7 years, with a range of 28 to 58 years. The average number of years in their present position was 7 years with a range from 1 to 27 years. Five of the
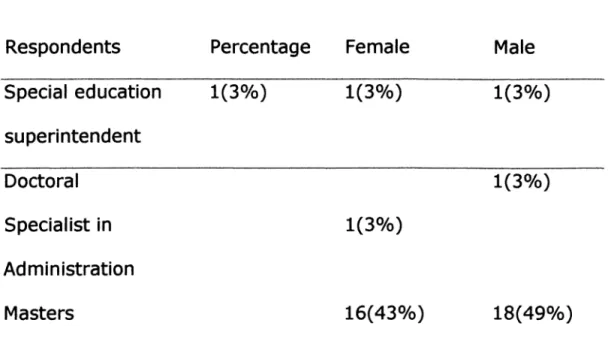
administrators had special education teaching experience. The average number of years in administration was 9 years, with a range of 1 to 27 years. One (3°/o) of the administrators held a doctoral degree, one (3°/o) held a specialist in administration degree, 35 (91°/o) held master's degrees, and one (3°/o) administrator did not answer the question. Demographics of principals is shown in table 2.
TABLE 2
Principal Demographics
Respondents Percentage Female Male
Principals 35(94°/o) 16( 43°/o) Assistant principals 1(3°/o)
18(49°/o) 1(3°/o) (table continues)
Table 2 (continued)
Respondents Percentage Female Male
Special education 1(3°/o) 1(3°/o) 1(3°/o) superintendent
Doctoral 1(3°/o)
Specialist in 1(3°/o)
Administration
Masters 16(43°/o) 18(49°/o)
Leadership Style and Definition of Inclusion
The administrators identified leadership style by choosing the statement that most accurately described their individual
approach to leadership. One principal chose the first statement, Above all, I try to develop clear role definitions and practice hierarchical decision making so that the school can be run more efficiently. The goal is to have a formal set of policies and
procedures to which every employee can be held responsible.
Twenty-six of the principals chose statement number 2, Above all, I try to make sure that all employees are highly motivated
and satisfied with their work. The goal is to nurture employees and develop a shared understanding about the goals of the group as we make important decisions together. Two principals chose the third statement, Above all, I try to reconcile the
conflicting interests of various groups through bargaining and medication. The goal is to fashion a consensus on major issues among competing groups in the school and community. Six principals chose the final statement, Above all, I try to develop a school culture that shapes the behavior of employees in
desirable ways. The goal is to encourage everyone to share in 'bottom-up' decision making within the context of my vision and
symbolic leadership. Leadership style is shown in Table 3.
Table 3
Leadership statements
Leadership statement Percentage
Above all, I try to develop clear role definitions 3°/o
and practice hierarchical decision making so (table continues)
Table 3 (continued)
Leadership statement
that the school can be run more efficiently.
The goal is to have a formal set of policies and procedures to which every employee can be held responsible.
Above all, I try to make sure that all
employees are highly motivated and satisfied with their work. The goal is to nurture
employees and develop a shared
understanding about the goals of the group as we make important decisions together.
Percentage
]QO/o
Above all, I try to reconcile the conflicting 5°/o interests of various groups through bargaining
33
and medication. The goal is to fashion a (table continues)
Table 3 (continued)
Leadership statement
consensus on major issues among competing groups in the school and community.
Percentage
Above all, I try to develop a school culture that 16°/o shapes the behavior of employees in desirable
ways. The goal is to encourage everyone to share in 'bottom-up' decision making within the context of my vision and symbolic
leadership.
No response
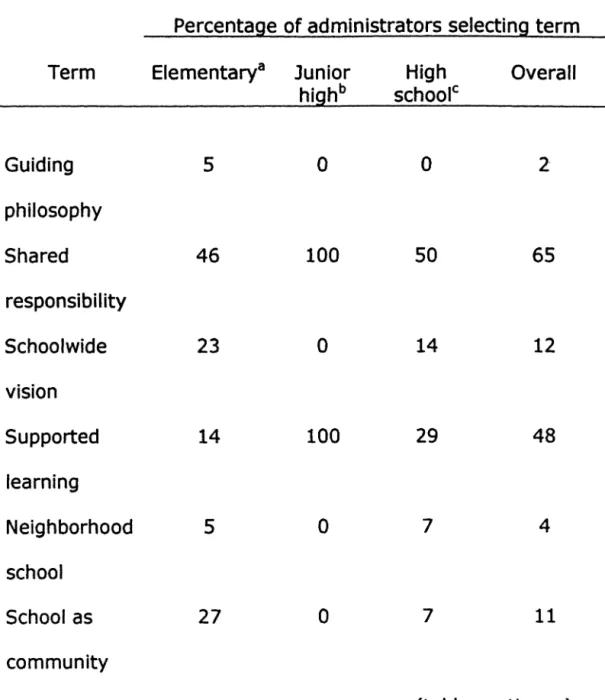
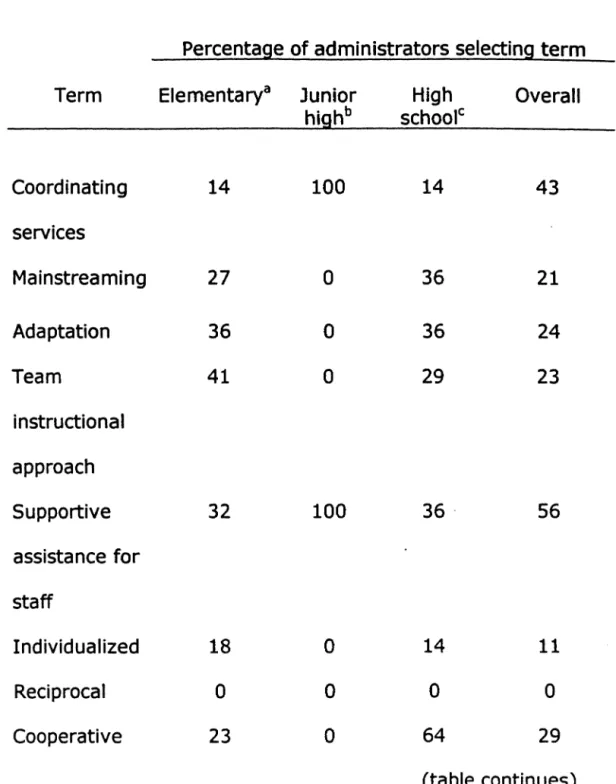
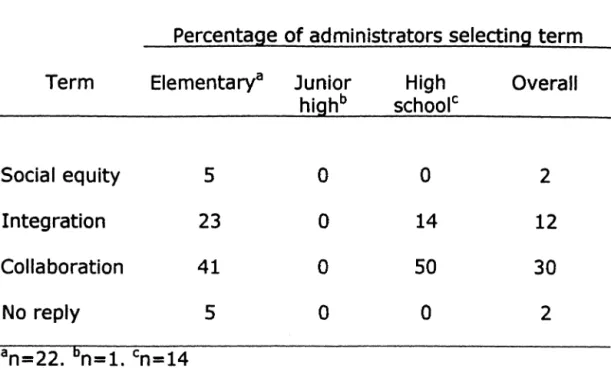
When choosing from a list of 22 descriptors of different definitions of inclusion, the principals were asked to choose 5 that best describe their individual definitions of inclusion. The results are presented in table 4.
TABLE 4
Terms Selected as Essential to Administrators' Definition of Inclusion
Term
Supportive environment Celebrating differences School
restructuring Combining best practices Administrative
mandate
Percentage of administrators selecting term Elementarya
50
18
5
27
0
Junior highb
0
0
0
100
0
High schoolc
57
0
0
43
0
Overall
36
6
2
57
0
(table continues)
Table 4 (continued)
Percentage of administrators selecting term Term Elementarya
Guiding 5
philosophy
Shared 46
responsibility
Schoolwide 23
vision
Supported 14
learning
Neighborhood 5
school
School as 27
community
Junior highb
0
100
0
100
0
0
High schoolc
0
50
14
29
7
7
Overall
2
65
12
48
4
11
(table continues)
Table 4 (continued)
Percentage of administrators selecting term Term Elementarya
Coordinating
14
services
Mainstreaming
27
Adaptation
36
Team
41
instructional approach
Supportive
32
assistance for staff
Individualized
18
Reciprocal
0
Cooperative
23
Junior highb
100
0 0 0
100
0 0 0
High schoolc
14
36 36 29
36
14 0 64
Overall
43
21 24 23
56
11 0 29
(table continues)
37
Table 4 (continued)
Percentage of administrators selecting term Term Elementarya Junior
highb
Socia I equity 5 0
Integration 23 0
Collaboration 41 0
No reply 5 0
an=22. 6n=l. cn=14
High schoolc
0 14 50 0
Overall
2 12 30 2
Overall the three items receiving the most responses were shared responsibility (65°/o), combining best practices (57°/o), and supportive assistance for staff (56°/o) .. Shared responsibility was also one of the top three overall choices of principals in the Barnett & Monda-Amaya ( 1998) study. Of the elementary respondents, 50°/o chose supportive environment as the top choice for their definition of inclusion. Other high responses were shared responsibility (46°/o), team instructional approach (41°/o), and collaboration (41°/o). Of the high school
39
respondents, 64°/o chose cooperative as their top choice for definition of inclusion. Other high responses were shared responsibility (50°/o), collaboration (50°/o) and combining best practices (43°/o). Because of only one respondent in the junior high school category, data is not sufficient to choose a definition of inclusion.
The principals also chose student populations to whom their definitions of inclusion would apply. Only three populations were perceived by principals as not to fit their definitions to be
included, TMH (n=9), SPH (n=4), and PHI (n=lS). Of students labeled as at risk (n=25), BO (n=27), LO (n=35), EMH (n=25), and culturally diverse (n=20), all were populations that the principal's definitions of inclusion would apply.
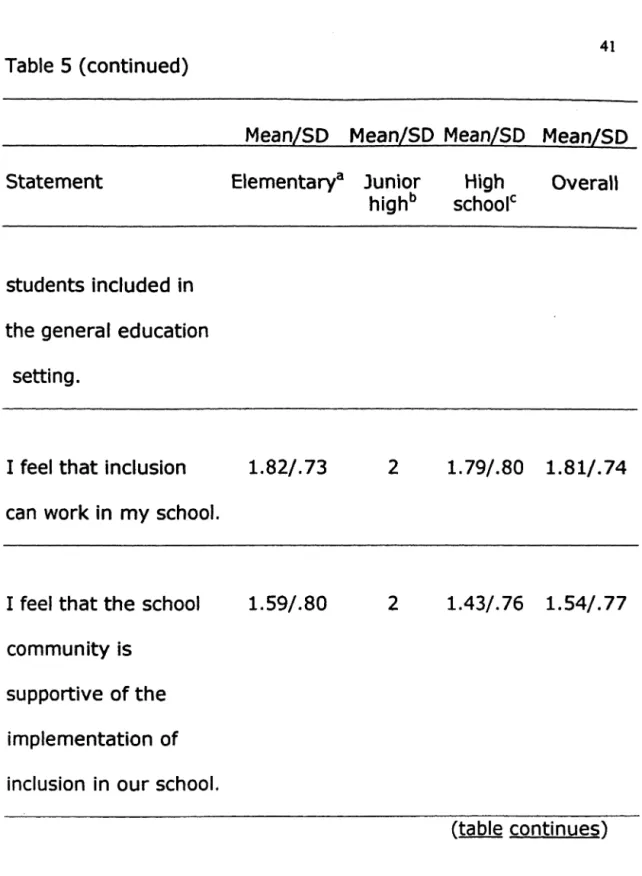
Principals indicated their agreement (0 = not at all, 3 = completely) to 6 statements rating school inclusiveness in the next section of the survey. Results are shown in table 5.
Table 5
Ratings on Statements of School Inclusiveness
Mean/SO Mean/SO Mean/SO Mean/SO
Statement Elementarya Junior High Overall
highb schoolc
All children should be 1.36/.79 1 1.29/.73 1.32/.75 educated in the
general education classroom.
How inclusive is your 1.59/.59 2 1.79/.58 1.68/.58 school?
The teachers in my 1.55/.80 2 1.64/.84 1.59/.80 school are prepared to
deliver educational services to general and
special education (table continues)
41
Table 5 (continued)
Mean/SO Mean/SO Mean/SO Mean/SO
Statement Elementarya Junior High Overall
highb schoolc
students included in the general education
setting.
I feel that inclusion 1.82/.73 2 1.79/.80 1.81/.74 can work in my school.
I feel that the school 1.59/.80 2 1.43/. 76 1. 54/. 77 community is
supportive of the implementation of inclusion in our school.
(table continues)
42
Table 5 (continued)
Mean/SO Mean/SO Mean/SO Mean/SO
Statement Elementarya Junior High Overall
highb schoolc
Note. Scale: O= not at all to 3=completely
Three elementary principals and two high school principals felt that their teachers were prepared to deliver educational services to the all students, agreeing with question 4. Only one
administrator felt that inclusion would not work in his/her school, rating question 5 with a 0. Only three elementary school
principals out of 22 elementary principals felt that the community supported inclusion in their schools.
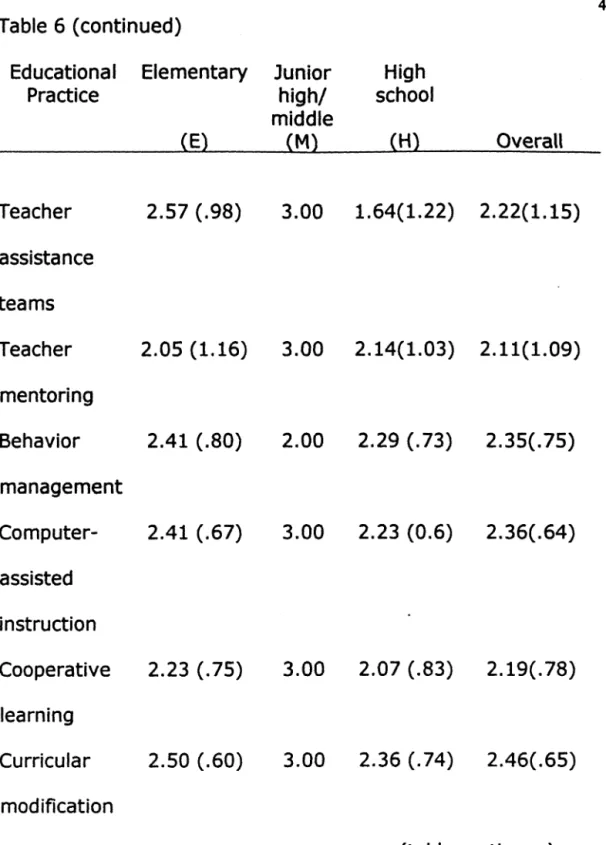
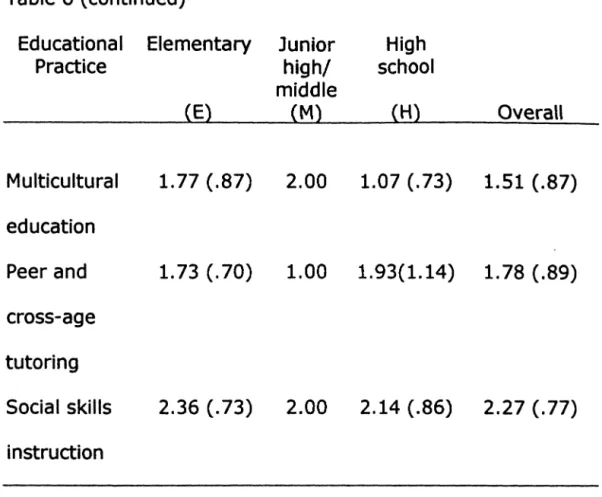
Ratings of Educational Practices
Twenty-one educational practices were rated by the
administrators based on 0 = never to 3 = routinely for column A for extent of use. Each of the 21 practices were evaluated for the mean of each column (overall) and mean and standard deviation for each practice by grade level.
When comparing the overall ratings of extent of use, two educational practices scored the highest by administrators:
curricular modification (2.46) and direct instruction (2.42), followed closely by computer-assisted instruction (2.36) and behavior management (2.35). Five educational practices scored lowest by administrators in extent of use: inservice on inclusion (1.19), interaction analysis (1.26), parent education support groups (1.06), modification of peer attitudes (1.54), and
multicultural education (1.51). Results for column A are shown in table 6.
Table 6
Mean Ratings of Extent of Use of Educational Practices by Grade Level
Mean/SO
Educational Elementary Junior High high/ school
Practice middle
(E) (M) (H) Overall
(table continues)
Table 6 (continued)
Educational Elementary Junior
Practice high/
middle
(E) (M)
Collaboration 2.45 (.67) 3.00 Co-teaching 1. 73 (.83) 2.00 Inservice on 1.33 (.80) 1.00 inclusion
Interaction 1.55 (1.00) .00 analysis
Parent 1.24 (1.04) 3.00 education
support groups
Parent/ 1.90 (1.14) 1.00 volunteer
participation
Peer coaching 1.38 (.97) 1.00
High school
(H)
2.43 (.65) .93 (.73) 1.00 (.68)
.93 (.83)
.62 (. 77)
1.08 (. 76)
1.00 (.91)
Overall
2.44 (.65) 1.43 (.87) 1.19 (.75)
1.26 (.98)
1.06 (1.03)
1.57 (1.07)
1.23(.96) (table continues)
Table 6 (continued)
Educational Elementary Junior
Practice high/
middle
(E) (M)
Teacher 2.57 (.98) 3.00 assistance
teams
Teacher 2.05 (1.16) 3.00 mentoring
Behavior 2.41 (.80) 2.00 management
Computer- 2.41 (.67) 3.00 assisted
instruction
Cooperative 2.23 (. 75) 3.00 learning
Curricular 2.50 (.60) 3.00 modification
High school
(H)
1.64(1.22)
2.14(1.03)
2.29 (.73)
2.23 (0.6)
2.07 (.83)
2.36 (. 74)
Overall
2.22(1.15)
2.11(1.09)
2.35(.75)
2.36(.64)
2.19(. 78)
2.46(.65)
(table continues)
45
Table 6 (continued)
Educational Elementary Junior
Practice high/
middle
(E) (M)
Curriculum- 2.23 (.69) 2.00 based
assessment
Direct 2.50 (.67) 3.00 instruction
Heterogeneous 2.23 (.97) .00 and/or multi-
age groupings
Learning 2.09 (. 75) 2.00 strategies
instruction
Modification of 1.95 (. 72) 2.00 peer attitudes
High school
(H)
1.64(1.08)
2.23 (.93)
2.00 (. 78)
1.43 (.94)
.86 (.66)
Overall
2.00 (.88)
2.42(. 77)
2.08(. 95)
1.84(.87)
1.54 (.87)
(table continues)
Table 6 (continued)
Educational Elementary Junior
Practice high/
middle
(E) (M)
Multicultural 1. 77 (.87) 2.00 education
Peer and 1. 73 (. 70) 1.00 cross-age
tutoring
Social skills 2.36 (.73) 2.00 instruction
High school
(H)
1.07 (. 73)
1.93(1.14)
2.14 (.86)
Overall
1.51 (.87)
1. 78 (.89)
2.27 (.77)
The twenty-one educational practices were also rated by
47
administrators according to perceived effectiveness (Column B), based on O = never to 3 = extremely. Each of the 21 practices were evaluated for the mean of each column and mean and standard deviation for each practice by grade level.
Two educational practices scored the highest by
administrators in perceived effectiveness were: curricular modification (2.41) and direct instruction (2.42). Five educational practices scored lowest in the following areas:
inservice on inclusion (1. 76), interaction analysis (1.6), parent education support groups (1.37), modification of peer attitudes (1. 77), and multicultural education (1.56). Results for column B are shown in Table 7.
Table 7
Mean Ratings of Perceived Effectiveness of Educational Practices by Grade Level
Educational
Practice
Collaboration Co-teaching Inservice on inclusion
Mean/SO Elementary Junior High
high/
Middle school
(E) (M) (H) Overall
2.32 (. 78) 3.00 2.07 (. 73) 2.24 (. 76) 1.91 (1.02) 2.00 1.75 (1.02) 1.86(.94) 1.81 (.93) 2.00 1.67 (.65) 1.76 (.82)
(table continues)
Table 7 (continued)
Educational
Practice
Mean/SO Elementary Junior High school
high/
Middle
(E) (M) (H) Overall
49
Interaction analysis 1. 74 (.87) .00 1.50 (.91) 1.60 (.86) Parent education 1.50(1.10) 3.00 .89 (.60) 1.37(1.03) Parent/Volunteer 2.00 (1.00) 2.00 1. 70 (.67) 1. 91(.89) participation
Peer coaching 1. 71 (1.06) 2.00 1.64 (.81) 1. 70 (.95) Teacher assistance 2.29 (.96) 3.00 1. 75 (.87) 2.12(.95) teams
Teacher mentoring 2.19(.98) 3.00 2 .. 38 (.65) 2.29 (.86) Behavior mgt. 2.48 (.51) 2.00 2.00(. 78) 2.28 (.66) Computer-assisted 2.41 (.SO) 3.00 2.21 (.58) 2.35 (.54) instruction
(table continues)
Table 7 (continued)
Educational
Practice
Cooperative learning Curricular
modification Curriculum-based assessment
Direct instruction Heterogeneous and/or multi-age groupings
Learning strategies instruction
Mean/SO Elementary Junior High school
high/
Middle
(E) (M) (H) Overall
2.32 (.57) 3.00 2.21 (.58) 2.30 (.57)
2.45 (.51) 2.00 2.36 (. 74) 2.41 (.60)
2.23 (.81) 2.00 1.79 (.80) 2.05 (.81)
2.55 (.51) 3.00 2.15 (. 90) 2.42 (.69) 2.23 (.92) .00 1.85 (.69) 2.03 (.91)
2.09 (.68) 2.00 1. 75 (.87) 1.97 (.75)
(table continues)
Table 7 (continued)
Educational
Practice
Modification of peer attitudes Multicultural education Peer and cross-age tutoring Social skills instruction
Mean/SO Elementary Junior High school
high/
Middle
(E) (M) (H) Overall
2.09 (. 75) 2.00 1.17(.58) 1. 77 (.81)
1.64 (.85) 2.00 1.36 (.67) 1.56 (. 79)
1.90(.62) 1.00 1.93 (.92) 1.98(75)
2.41 (.59) 2.00 2.00(.71) 2.25 (.65)
When examining extent of use for elementary principals, mean scores ranged from X=l.24 (parent education support
SI
groups) to X=2.57 (teacher assistance teams) with a median of 2.09 (learning strategies instruction). Mean scores for junior high principal's ranges from X=.00 to X=3.00, but it must be noted that only 1 response was received from the traditional junior high schools. Mean scores for high school principals
ranged from X=.62 (parent education support groups) to X=2.43 (collaboration), with a median score of 1.64 (teacher
mentoring).
When looking at the perceived effectiveness of educational practices by grade level served by principals, the elementary principals ranged from X= 1.50 (parent education support groups) to X=2.55 (direct instruction) with a median score of 2.19 (teacher mentoring). Mean scores for junior high principal's ranges from X=.00 to X=3.00, but it must be noted that only 1 response was received from the traditional junior high schools.
High school principals ranged from X=.89 (parent education support groups) to X=2.38 (teacher mentoring), with a median score of 1. 79 (curriculum-based assessment). Results are shown in Table 8.
Table 8
Results of t-tests for the Extent of Use and Perceived Effectiveness of Educational Practices
Educational practice df
Collaboration 36
Co-teaching 34
Inservice on inclusion 33
Interaction analysis 29
Parent education support groups 29 Parent/volunteer participation 31
Peer coaching 32
Teacher assistance teams 33
Teacher mentoring 34
Behavior management 35
Computer-assisted instruction 35
Cooperative learning 36
Curricular modification 36
Curriculum-based assessment 35.
T
2.46 2.96*
3.69*
1.72 1.54 2.23 3.67*
2.47 .89 1.53
.00 1.16
.52 .52 (table continues)
53
Table 8 (continued)
Educational practice df T
Direct instruction 35 .00
Heterogeneous and/or multi-age 35 .81
groupings
Learning strategies instruction 34 .62
Modification of peer attitudes 34 2.65
Multicultural education 33 .81
Peer and cross-age tutoring 35 .82
Social skills instruction 35 .57
*p<.01.
To calculate if differences existed in the perceptions of extent of use (column A) and perceived effectiveness (column B),
paired t-tests were used. Results revealed that significant differences existed in co-teaching X=36 (2.96), inservice on inclusion X=33 (3.69), and peer coaching X=32 (3.67).
Differences were considered statistically significant at p < .01.
CHAPTER FIVE Discussion
Implementing inclusion into the local school setting requires the support of the administration of the school. Effective
leadership includes support for both students and staff (Barnett
& Monda-Amaya, 1998). This study extends previous research by examining principals' knowledge of and attitudes of inclusion in an individual school district. " Respondents to this survey provided insight into the components of their definitions of
inclusion and ratings of extent of use and perceived effectiveness of educational practices commonly associated with inclusive
programs and philosophies in schools" (Barnett & Monda-Amaya, 1998, p. 188).
The results of this study are similar to the original study
conducted by Barnett and Monda-Amaya (1998). Limitations of time and size of sample led to a similar study of a larger study in order to maximize the amount of time available.
Threats to internal validity do exist in this study. Self-report
surveys are used in this study making accuracy a possible problem due to individuals being unclear of the questions being asked. Generalizability is a major limitation to this study due to the geographical location of the school district being
predominately rural. Racially diverse school districts, urban school districts, and wealthier school districts will not be able to generalize the information that is provided in this study. In order to minimize these threats, the use of the same survey instrument was used as in the Barnett & Monda-Amaya study.
The author conducted all of the research work. Questionnaires were sent to every principal in the East Central Illinois
Educational cooperative.
Definitions and Populations
How do principals define inclusion and to which populations of students do they apply that definition? As in the principal study of Barnett & Monda-amaya (1998), a clear definition of inclusion did not emerge from the data. The principals did not agree on how to define inclusion when choosing from the list of 22 descriptors. Shared responsibility was the highest descriptor
overall, receiving 65°/o of the principals votes. Combining best practices (57°/o) and supportive assistance for staff (56°/o) were rated the next highest overall descriptors of inclusion. All other descriptors were under 50°/o as being essential to the definition of inclusion. Administrative mandate and reciprocal did not receive any principals' vote as to being important to the definition of inclusion.
When identifying populations of students to whom definitions of inclusion would apply, a clear definition also did not become evident. As with the data obtained by Barnett & Monda-Amaya, students diagnosed with mild disabilities (LD, 97°/o; BD, 75°/o;
EMH, 69°/o; and At-risk, 69°/o) were most closely fitting with principals definitions of students benefiting from inclusion.
Students identified as being moderately disabled were identified as benefiting from inclusion by principals 34°/o of the time, while students identifies as profoundly disabled were only identified by
7°/o of the principals. Administrators may believe that inclusion
applies more to students diagnosed with mild disabilities than with students diagnosed with moderate or severe disabilities.
These findings are similar to the findings of Barnett & Monda- Amaya (1998).
The findings of this study support the need for greater consistency when defining inclusion and that educators must strive to coordinate these definitions with practice (Fox &
Ysseldyke, 1997). This data is supported by the findings of Barnett & Monda-Amaya (1998).
Attitudes of Princioals Towards Inclusion
What attitudes do principals have toward inclusive education?
In defining level of agreement with statements related to
principals perceptions of inclusion, a low level of agreement (M
=
1.32) was noted in regard to the statement "All children should be educated in the regular classroom". This statement is
consistent with the administrators definition of inclusion as stated above. This is consistent with the findings of Barnett &
Monda-Amaya (1998) and also shows a lack of agreement on the part of principals toward the definition of inclusion and the
populations associated with that definition.
Leadership Approaches of Principals
What leadership approaches do principals most commonly exhibit? Seventy-four percent of the principals agreed with the leadership statement "Above all, I try to make sure that all employees are highly motivated and satisfied with their work.
The goal is to nurture employees and develop a shared understanding about the goals of the group as we make important decisions". This agrees with the research of Fox &
Ysseldyke, (1997), Katsiyannis, Conderman, & Franks, (1996), and Parker & Day, (1997).
Limitations
59
Limitations to this study do exist. Small sample size and limited access to urban and suburban schools were two major limitations to this study. Only one traditional junior high school participated which also became a major limitation to this study.
Generalization of these findings is another limitation because of the predominance of rural schools that participated in the study.
Implications for Practice and Future Research
Many of the articles reviewed in this study suggested that
further research is needed as to the effectiveness of creating inclusive schools. Studies are needed concerning the benefits to regular and special education students in terms of academic achievement and social skill development (Gameros, 1995).
Also, review of the training requirements for regular and special educators is needed in order to provide a working environment that is pleasant for all involved, as well as reducing the stress of all (Baines, Baines, & Masterson, 1994; Chesley & Calaluce, 1998; Roach, 1994; Mawdsley, 1995).
Results of this study indicated that agreement is needed as to the definition of inclusion and as to the populations to which inclusion would apply. Also, principals were not asked if their attitudes of inclusion changed after steps were taken to
implement inclusion into their classrooms. Training for all teachers is needed in order to allow teachers to feel confident teaching all students in the same classroom. Community support of inclusion is needed as well as research into why parent support groups are perceived by principals as not working.
References
Arnold, J. B. & Dodge, H.W., (1994). Room for all.:.
American School Board Journal. 181(10), 22-26.
Baines, L. & Baines, C., Masterson, C., (1994).
Mainstreaming: One school's reality. Phi Delta Kappan. 76(1), 57-63.
Barnett, C. A. & Monda-Amaya, L. E., (1998). Principals' knowledge of and attitudes toward inclusion. Remedial and Special Education. 19.(3), 181-192.
Chesley, G.M. & Calaluce, P.O., (1997). The deception in inclusion. Mental Retardation. 35(6), 488 - 490.
DeMitchell, T. & Kerns, G. M., (1997). Where to educate Rachel Holland? Does least restrictive environment mean no restrictions? The Clearing House [on-line], 70. Available Internet:
61
http://gilligan.prod.oclc.org:3057/FETCH:r ... :next=html/fs_fulltext.htmt%22:/
fstxt44.htm
Fox, N. E. & Ysseldyke, J. E., (1997). Implementing inclusion at the middle school levels: Lessons from a negative
62
example. Exceptional Children, 64(1), 81-98.
Gameros, P. (1995). Visionary principal & inclusion of students with disabilities. The National Association of Secondary School Principals Bulletin, 79(568), 15-17.
Guzman, N., (1997). Leadership for successful inclusive schools: A study of principal behaviors. Journal of Educational Administration. 35(5), 39-50.
Katsiyannis, A., Conderman, G., & Franks, D., (1996).
Students with disabilities: Inculsionary programming and the school principal. The National Association of Secondary School Principals Bulletin, 80(578), 81-86.
Mawdsley, J. D., (1995). Does inclusion cost more? The cost of special education. School Business Affairs. 7, 27-31.
Mclaughlin, M. J. & Warren, S. H., (1994). The costs in inclusion. The School Administrator. 11, 8-19.
Parker, S. & Day, V. P., (1997). Promoting inclusion through instructional leadership: The roles of the secondary school principal. National Association of Secondary School Principals. 81(587), 83-89.
Roach, V. (1994). The superintendent's role in creating inclusive schools. The School Administrator. 51(10), 20-27.
63
Shanker, A., (1994-1995). Full inclusion is neither free nor appropriate. Educational Leadership, 52(4), 18-21.
Smelter, R. W., Rasch, B. W., & Yudewitz, G. J., (1994).
Thinking of inclusion for all special needs students? Better think again. Phi Delta Kappan. 76(1), 35-38.
Date Numbe .... r _ _ _ _ _
A. Schgol lnfocm1tfoa
1. Grade level of Schoo._ _ _ _ _ _
2. Student Population primarily is considered: Rural. _ _ _ _ _ Urban._, __ Suburban_
3. Indicate total number of: Students. _ _ _ Teachers. _ _ _ _ Suppon Staff_
4. Which types of proarams arc provided -in your school (check all that apply):
Proaram Consultation •Resource Self·
(full-dme coutainod
malnstreamedl Mildlv Handlcanned lBD)
Mildlv liandicanned <LDl Mildlv Hmdh:anllM <EMH'I
Modcratclv Handf,.•nned ,~ .... -H"1
Severelv/Profoundlv Handicaooed
Phvsic:allvlHealth lmoaired (!'HI) Other (i.e. ESL, Chapter I. Sensory Impainncnta) - Pleqc Specify:
B. Prjncjp1l11 B1ck1round Information
5. Job Title - - - - 6. Gendct. _ _ _ 7. Age. _ _ _
8. Number of years in this position. _ _ _ _
9. Total number of years in teaching: General Education _ _ _ Speci~ Education_~-
Other (Please specify) _ _ _ _ _ _ _ _ _ _ _ _ _ _ _
10. To[aJ number of years in administration: Principalship _ _ _ _ _ _ _ _
Other (Please specify). _ _ _ _ _ _ _ _ _ _ _ _ _ _ _ _
11. Dearees held and when they were obtained:
12. Certificates held and when they were obtained:
65
16. Circle the numeral that best indicates the extent to which you agree with the followlna
1tatcment1.
(a) All children should be educated ln the regular Not at All Compl•t9ly
claaroom.
0 1 2 3
(b) How inclusive is your school?
.
Not at All Complotoly0 1 2 3
(C) Our school currantly is working toward Not at All COlllpletoly
becoming a more lncluai\'c school.
0 l 2 3
(d) The teachers in my school are prepared to Not at All Completely
deliver educational services to aeneral and
special education students included in the 0 1 2 3
gcne.ral education setting.
(e) I feel that inclusion can work in my school. Not at All Coaaplotcly
0 1 2 3
(f) I feel that the school commuah7 Nol al All Completely
supportive of the implementation of inclusion
ln our school. 0 1 2 3
66
C. Gtgeral lg(orgaation
13. Thomas Sergiovamri bu suaaested that many school administrators adopt one of four
conceptually distinct administrative styles. Recognizing that there are likely to be
elements of several of these in your own approach to lcadcnhip, please check the
ONE statement that most accurately reflects your approach to leadenbip.
_ _ _ (a) Above all, I try to develop clear role definitions and practice hierarchical
decisionmaking· so that the school. can be run more efficiently. The goal is to
have a formal set of policies and procedures to which ttvery employee can be
held accountable.
_ _ _ (b) Above all, I try to make sure that all employees an: hlihly motivated and satisfied with their work.. The goal is to nurture employees and develop a shared
understanding about the aoals of the group as we make imponant decisions
together.
_ _ _ (e) Above all, I uy to reconcile the conflicting interests of various groups throuah
bllfgaining and mediation. The goal is to fashion a consensus on major issues
among competina aroups in the school and community.
_ _ _ (d) Above all, I uy to develop a school culture that shapes lhc behavior of employees
in desirable ways. The goal is to encourage everyone to Iha.re in •bottom-up•
decisionmaking within the context of my \'ision and symbolic leadcnhip.
14. Listed below are descriptors associated with the concept of inclusion. Select the FIVE
terms that you believe best communicate and are most essential to your definition of
inclusion.
__supportive environment
_celebrating differences
_ _ school restructuring
_combining best practices _administrative mandate __guiding philosophy
_ _ sGhoolwide vision
_ _ shared responsibility
_supported learning _neighborhood school __school as . community
_coordinating services
_mainstrearoing _adaptation
_team instructional approach
_supportive assistance for staff
___individualized __reciprocal _cooperative·
_social equity __jntcgration _collaboration
_other~---
15. To which of the following populations does your definition of inclusion apply? Cheek
all that apply.
~t-risk for school failure
_Mildly handicapped (BD)
__Mildly handicapped (LO)
__Mildly handicapped (EMH)
___Moderately handicapped (TMH)
___ .-Severely/Profoundly handicapped (SPH)
_Physically/health impaired (PHI)
_Culturally Diverse (social,. economic. ethnic
~~Other ______ ~~~~---~~