Secondary data collection and analysis
4
C H A P T E R
The act of sourcing, evaluating and analysing secondary data can realise great insights for decision-makers. It is also vital to successful problem diagnosis, sample planning and collection of primary data.
After reading this chapter, you should be able to:
1
define the nature and scope of secondary data and distinguish secondary data from primary data;2
analyse the advantages and disadvantages of secondary data and their uses in the various steps of the marketing research process;3
evaluate secondary data using the criteria of specifications, error, currency, objectives, nature and dependability;4
describe in detail the different sources of secondary data, focusing upon external sources in the form of published materials, and syndicated services;5
discuss in detail the syndicated sources of secondary data, including household and consumer data obtained via surveys, mail diary panels and electronic scanner services, as well as institutional data related to retailers, wholesalers and industrial or service firms;6
explain the need to use multiple sources of secondary data and describe single-source data;7
identify and evaluate the sources of secondary data useful in international marketing research;8
understand the ethical issues involved in the use of secondary data.Objectives
Stage 1 Problem definition
Stage 2 Research approach
developed
Stage 3 Research design
developed
Stage 5 Data preparation
and analysis
Stage 6 Report preparation
and presentation
Stage 4 Fieldwork or data
collection
Overview
The collection and analysis of secondary data help to define the marketing research problem and develop an approach. In addition, before collecting primary data, the researcher should locate and analyse relevant secondary data. Thus, secondary data can be an essential component of a successful research design. Secondary data can help in sample designs and in the details of primary research methods. In some proj- ects, research may be largely confined to the analysis of secondary data because some routine problems may be addressed based only on secondary data. In addition, given the huge explosion of secondary data sources available, sufficient data may be accessed to solve a particular marketing research problem.
This chapter discusses the distinction between primary data, secondary data and marketing intelligence. The advantages and disadvantages of secondary data are consid- ered, and criteria for evaluating secondary data are presented, along with a classification of secondary data. Internal secondary data are described, and major sources of external secondary data – such as published materials, online and offline databases, and syndi- cated services – are also discussed The sources of secondary data useful in international marketing research are discussed. Several ethical issues that arise in the use of secondary data are identified.
To begin with, we present an example that illustrates the nature of secondary data, how it may be evaluated, and its relationship to primary data collection.
Flying high on secondary data1
Moneymagazine recently published the results of a study conducted to uncover the airline characteristics that consumers consider most important. In order of importance, these char- acteristics were safety, price, baggage handling, on-time performance, customer service, ease of reservations and ticketing, comfort, frequent flyer schemes and food.
If Air France was considering conducting a marketing research study to identify characteris- tics of its service that should be improved, this article might be a useful source of secondary data. Before using the data, Air France should evaluate them according to several criteria.
First, the research design used to collect the data should be examined. This Moneymaga- zine article includes a section that details the research design used in the study. Money used a face-to-face survey of 1,017 ‘frequent flyers’. The results of the survey had a margin of error of 3%. Air France would have to decide whether ‘frequent flyers’ in the USA could be generalised to the population they wish to understand, whether 1,017 was a sufficient sample size for their purposes and whether a margin of error of 3% was acceptable. In addi- tion, Air France should evaluate what type of response or non-response errors may have occurred in the data collection or analysis process.
The currency of the data and objective of the study would be important to Air France in deciding whether to utilise this article as a source of secondary data. Air France would also need to look at the nature and dependability of the data. For example, they would need to examine how the nine choice criteria were defined. If the criterion price was measured in terms of fare per kilometre, is this a meaningful and acceptable definition to decision-makers at Air France? With regard to dependability, Air France would need to evaluate the reputation of Money magazine and of ICR, the research company hired by Moneyto undertake the survey. They would also need to recognise the fact that Moneyused secondary data in its study; how dependable are the sources they used?
TheMoney magazine article might be useful as a starting place for a marketing research project for Air France. It could be helpful in formulating the nature of decision-making prob- lems and associated research objectives. There may be limitations in regard to reliability, dependability or even how generalisable it may be to Air France’s target consumers. Many lessons and ideas may be generated from this article that may lead to other secondary data sources and in the design of a well-focused primary data collection. ■
e x a m p l e
Defining primary data, secondary data and marketing intelligence
Primary dataare originated by a researcher for the specific purpose of addressing the problem at hand. They are individually tailored for the decision-makers of organisa- tions that pay for well-focused and exclusive support. Compared with readily available data from a variety of sources, this tailoring means higher costs and a longer time frame in collecting and analysing the data.
Secondary dataare data that have already been collected for purposes other than the problem at hand. At face value this definition seems straightforward, especially when contrasted to the definition of primary data. However, many researchers con- fuse the term, or quite rightly see some overlap with marketing intelligence.
Marketing intelligencecan be defined as ‘qualified observations of events and developments in the marketing environment’. The use of the word ‘observations’ is presented in a wide sense to include a variety of types of data, broadly concerned with
‘environmental scanning’.2In essence, though, marketing intelligence is based upon data that in many instances have been collected for purposes other than the problem at hand. To clarify this overlap in definitions, Table 4.1 compares secondary data with marketing intelligence through a variety of characteristics.
Note in the above comparisons the repeated use of the word ‘tend’. The boundaries between the two are not absolutely rigid. Consider the example at the start of this chapter, an article published in Money magazine. The journalist may have collected, analysed and presented quantitative data to support their qualitative interpretation of the future developments of a market. The data they use and present may come from credible sources and be correctly analysed, but what about their choice of data to sup- port their argument? Other sources of data that may contradict their view may be ignored. The data they present can be seen as a secondary data source and interpreted in its own right by a researcher. The interpretation and argument of the journalist can
Defining primary data, secondary data and marketing intelligence
Primary data Data originated by the researcher specifically to address the research problem.
Secondary data Data collected for some purpose other than the problem at hand.
Marketing intelligence Qualified observations of events and developments in the marketing environment.
Characteristic Secondary data Marketing intelligence
Structure Specifications and research design Can be poorly structured; no tend to be apparent universal conventions of reporting Availability Tend to have regular updates Irregular availability
Sources Generated in-house and from Generated in-house and from organisations with research prowess unofficial sources
Data type Tend to be quantitative; many Tends to be qualitative; many issues need qualitative interpretation issues difficult to quantify Source credibility Tend to be from reputable and Questionable credibility; can be
trustworthy research sources generated from a broad spectrum of credibility
Terms of reference Tend to have clear definitions of Ambiguous definitions; difficult to what is being measured compare over different studies Analysis Mostly conventional quantitative Opinion based, interpretative
techniques
Ethics In-company data gathering may be Some techniques may be seen as covered by data protection acts; industrial espionage – though externally generated data may be there is an ethical code produced covered by research codes of by the Society of Competitive conduct, e.g. ESOMAR Intelligence Professionals Table 4.1 A comparison of secondary data and marketing intelligence3
be seen as intelligence and have some credibility. In its entirety, such an article has ele- ments of both secondary data and marketing intelligence, and it may be impossible to pull them apart as mutually exclusive components.
As will become apparent in this chapter, there are clear criteria for evaluating the accuracy of secondary data, which tend to be of a quantitative nature. Marketing intelligence is more difficult to evaluate but this does not mean that it has less value to decision-makers or researchers. Certain marketing phenomena cannot be formally measured; researchers may not be able to gain access to conduct research, or the rapid unfolding of events means that it is impracticable to conduct research. The following example illustrates the importance of intelligence to many companies.
Behind enemy lines4
Robin Kirkby, Director of European Consulting for intelligence specialist Fuld & Company, says there are three principal factors driving investment in intelligence.
‘The Internet, globalisation and higher expectations from customers are all putting compa- nies under more pressure to differentiate themselves from the competition. It’s frustrating that intelligence gets associated with spying; it’s actually a highly ethical activity, focused on underlying competitive dynamics and planning future change.’
According to research by The Futures Group (TFG), 60% of companies have an organised system for collecting competitive intelligence, while 82% of companies with revenues over €10bn make systematic use of it. TFG ranked the leading eight users of competitor intelligence as:
1 Microsoft 2 Motorola
3 IBM
4 Procter & Gamble 5= General Electric 5= Hewlett-Packard 7= Coca-Cola 7= Intel ■
Such widespread use of intelligence in major organisations means it has some role to play in supporting decision-makers, but it has many limitations, which are apparent in Table 4.1. In the development of better-founded information support, credible support can come from the creative collection and evaluation of secondary data. This requires researchers to connect and validate different data sources, ultimately leading to decision-maker support in its own right and support of more focused primary data collection. As this chapter and Chapter 5 unfold, examples of different types of sec- ondary data will emerge and the applications of secondary data will become apparent.
Advantages and uses of secondary data
Secondary data offer several advantages over primary data. Secondary data are easily accessible, relatively inexpensive and quickly obtained. Some secondary data, such as those provided by the National Censuses, are available on topics where it would not be feasible for a firm to collect primary data. Although it is rare for secondary data to provide all the answers to a non-routine research problem, such data can be useful in a variety of ways.5Secondary data can help you:
1 Diagnose the research problem 2 Develop an approach to the problem 3 Develop a sampling plan
4 Formulate an appropriate research design (for example, by identifying the key vari- ables to measure or understand)
e x a m p l e
5 Answer certain research questions and test some hypotheses 6 Interpret primary data with more insight
7 Validate qualitative research findings.
Given these advantages and uses of secondary data, we state the following general rule:
Examination of available secondary data is a prerequisite to the collection of primary data. Start with secondary data. Proceed to primary data only when the secondary data sources have been exhausted or yield marginal returns.
The rich dividends obtained by following this rule are illustrated in the example at the start of this chapter. It shows that the collection and analysis of even one relevant sec- ondary data source can provide valuable insights. The decision-maker and researcher can use the ideas generated in secondary data as a very strong foundation to primary data design and collection. However, the researcher should be cautious in using sec- ondary data, because they have some limitations and disadvantages.
Disadvantages of secondary data
Because secondary data have been collected for purposes other than the problem at hand, their usefulness to the current problem may be limited in several important ways, including relevance and accuracy. The objectives, nature and methods used to collect the secondary data may not be appropriate to the present situation. Also, sec- ondary data may be lacking in accuracy or may not be completely current or dependable. Before using secondary data, it is important to evaluate them according to a series of factors.6These factors are discussed in more detail in the following section.
Criteria for evaluating secondary data
The quality of secondary data should be routinely evaluated, using the criteria pre- sented in Table 4.2 and discussion in the following sections.7
Specifications and research design
The specifications or the research design used to collect the data should be critically examined to identify possible sources of bias. Such design considerations include size and nature of the sample, response rate and quality, questionnaire design and admin- istration, procedures used for fieldwork, and data analysis and reporting procedures.
These checks provide information on the reliability and validity (these concepts will be further developed in Chapter 13) of the data and help determine whether they can be generalised to the problem at hand. The reliability and validity can be further ascertained by an examination of the error, currency, objectives, nature and depend- ability associated with the secondary data.
Error and accuracy
The researcher must determine whether the data are accurate enough for the purposes of the present study. Secondary data can have a number of sources of error or inaccuracy, including errors in the approach, research design, sampling, data collection, analysis, and reporting stages of the project. Moreover, it is difficult to evaluate the accuracy of secondary data because the researcher did not participate in the research. One approach is to find multiple sources of data if possible, and com- pare them using standard statistical procedures.
Criteria for evaluating secondary data
Number crunch8
In December 1997, the Audit Bureau of Circulations (ABC) met UK newspaper publishers and major media buyers from the Institute of Practitioners in Advertising. The meeting aimed to thrash out a formula that could restore ABC’s credibility as a trading currency.
Most observers agreed that the ABC’s troubles were a direct result of squabbling between media owners. As circulations have continued to slide, the press barons have fought to hold on to their market share through price cuts, promotions and enhanced editorial packages. This has introduced an unprecedented volatility into their sales figures. Not content with trumpeting their own gains, some companies have sought to show up the deficiencies in their rivals’ sales figures.
Figures under fire
The argument is best understood through a straightforward example of what is at stake. Let us take the October 1997 ABC figure for The Times, which was 814,899. That figure was a monthly circulation average which, prior to the recent dispute, would have been the only offi- cial benchmark that agencies used as a negotiating point with press owners (though they turn to data from the National Readership Survey and the Target Group Index to argue their case).
At the heart of the dispute has been how that monthly figure is comprised. For example, were all the issues sold at the full price or were some given away cheaply as part of a subscription or promotional offer? Were any sold or given in bulk to an airliner or retailer, and if so how many? What about papers sold to Eire or Spain? Were they included in the total and if so how could that be justified as a piece of credible advertising data?
Another hot issue was the reliability of the monthly figure. Advertisers were dissatisfied with a number that they believe fails to reflect the reality of what they were buying. Director of press buying at The Media Centre, Tim Armes, says ‘we’d like to know what each paper sells
Criteria Issues Remarks
Specifications and ■ Data collection method Data should be reliable, valid and research design ■ Response rate generalisable to the problem at hand.
■ Population definition
■ Sampling method
■ Sample size
■ Questionnaire design
■ Fieldwork
■ Data analysis
Error and accuracy Examine errors in Assess accuracy by comparing data
■ Approach from different sources.
■ Research design
■ Sampling
■ Data collection
■ Data analysis
■ Reporting
Currency Time lag between collection and Census data are periodically publication. Frequency of updates updated by syndicated firms.
Objective Why were the data collected The objective will determine the relevance of data.
Nature ■ Definition of key variables Reconfigure the data to increase
■ Units of measurement their usefulness, if possible.
■ Categories used
■ Relationships examined
Dependability Source: Preference should be afforded to
■ Expertise an original rather than an acquired
■ Credibility source.
■ Reputation
■ Trustworthiness Table 4.2 Criteria for evaluating secondary data
e x a m p l e
daily and we’d like to know week to week fluctuations. The papers all boast about Saturday but keep quiet about Tuesday and Thursday. If one day is dramatically higher than the aver- age, you don’t have to be a brain surgeon to realise the others are lower.’ ■
As this example indicates, the accuracy of secondary data can vary, particularly if they relate to phenomena that are subject to change. Moreover, data obtained from different sources may not agree. In these cases, the researcher should verify the accu- racy of secondary data by conducting pilot studies or by other appropriate methods.
Often, by exercising creativity this can be done without much expense or effort.
Currency: when the data were collected
Secondary data may not be current and the time lag between data collection and pub- lication may be long, as is the case with much census data. Moreover, the data may not be updated frequently enough for the purpose of the problem at hand. Decision- makers require current data; therefore, the value of secondary data is diminished as they become dated. For instance, although the Census of Population data are compre- hensive, they may not be applicable to major cities in which the population has changed rapidly during the last two years. Likewise, in the GlobalCash Project, the lists of the largest companies in Europe, used to decide who should be surveyed, have to be updated to reflect changes that take place in the two years between each study.
Objective: the purpose for which the data were collected
Data are invariably collected with some objective in mind, and a fundamental ques- tion to ask is why the data were collected in the first place. The objective for collecting data will ultimately determine the purpose for which that information is relevant and useful. Data collected with a specific objective in mind may not be appropriate in another situation. In the example at the start of this chapter, the sample surveyed by Money magazine was made up of ‘frequent flyers’. The objective of the study was ‘to uncover the airline characteristics consumers consider most important’. Air France, however, may wish to target ‘business class’ flyers and ‘to uncover perceptions related to trade-offs made in customer service–price–safety’. Even though there may be iden- tical questions used in both studies, the target respondents may be different, the rationale for the study presented to respondents will be different, and ultimately the
‘state of mind’ respondents may be in when they come to comparable questions will be different. The Money survey was conducted for entirely different objectives from those Air France have for their study. The findings from the Money survey may not directly support decision-making at Air France, though they may help to define who Air France should talk to and what questions they should put to them.
Nature: the content of the data
The nature, or content, of the data should be examined with special attention to the definition of key variables, the units of measurement, the categories used and the rela- tionships examined. If the key variables have not been defined or are defined in a manner inconsistent with the researcher’s definition, then the usefulness of the data is limited. Consider, for example, secondary data on consumer preferences for TV pro- grammes. To use this information, it is important to know how preference for programmes was defined. Was it defined in terms of the programme watched most often, the one considered most needed, most enjoyable, most informative, or the pro- gramme of greatest service to the community?
Likewise, secondary data may be measured in units that may not be appropriate for the current problem. For example, income may be measured by individual, family, household or spending unit and could be gross or net after taxes and deductions.
Income may be classified into categories that are different from research needs. If the
Criteria for evaluating secondary data
researcher is interested in high-income consumers with gross annual household incomes of over €120,000, secondary data with income categories of less than
€20,000,€20,001–€50,000,€50,001–€75,000 and more than €75,000 will not be of use. Determining the measurement of variables such as income may be a complex task, requiring the wording of the definition of income to be precise. Finally, the rela- tionships examined should be taken into account in evaluating the nature of data. If, for example, actual behaviour is of interest, then data inferring behaviour from self- reported attitudinal information may have limited usefulness. Sometimes it is possible to reconfigure the available data – for example, to convert the units of meas- urement – so that the resulting data are more useful to the problem at hand.
Dependability: how dependable are the data?
An overall indication of the dependability of data may be obtained by examining the expertise, credibility, reputation and trustworthiness of the source. This information can be obtained by checking with others who have used the information provided by the source. Data published to promote sales, to advance specific interests, or to carry on propaganda should be viewed with suspicion. The same may be said of data pub- lished anonymously or in a form that attempts to hide the details of the data collection research design and process. It is also pertinent to examine whether the sec- ondary data came from an original source, one that generated the data, or an acquired source, one that procured the data from an original source. Generally, secondary data should be secured from an original rather than an acquired source. There are at least two reasons for this rule: first, an original source is the one that specifies the details of the data collection research design, and second, an original source is likely to be more accurate and complete than a surrogate source.
Classification of secondary data
Figure 4.1 presents a classification of secondary data. Secondary data may be classified as either internal or external.Internal dataare those generated within the organisation for which the research is being conducted. This information may be available in a ready- to-use format, such as information routinely supplied by the management decision
Internal data Data available within the organisation for whom the research is being conducted.
Computerised databases Published
materials
Syndicated services Internal
Ready to use
Requires further processing
Secondary data
External
Figure 4.1 A classification of secondary data
support system. On the other hand, these data may exist within the organisation but may require considerable processing before they are useful to the researcher. For exam- ple, a variety of information can be found on sales invoices. Yet this information may not be easily accessed; further processing may be required to extract it. Secondary data generated from internal sources will be examined in more detail in Chapter 5.External data, on the other hand, are those generated by sources outside the organisation. These data may exist in the form of published material, online databases, or information made available by syndicated services. Externally generated secondary data may be more diffi- cult to access, more expensive, and more difficult to evaluate for its accuracy, in comparison with internal secondary data. These factors mean that, before collecting external secondary data, it is useful to analyse readily available internal secondary data.
Published external secondary sources
Sources of published external secondary data include local authorities, regional and national governments, the EC, non-profit organisations (e.g. Chambers of Commerce), trade associations and professional organisations, commercial publish- ers, investment brokerage firms, and professional marketing research firms.9In fact, such a quantity of data is available that the researcher can be overwhelmed. Therefore, it is important to classify published sources (see Figure 4.2). Published external sources may be broadly classified as general business data or government data.
General business sources comprise guides, directories, indexes and statistical data.
Government sources may be broadly categorised as census data and other publica- tions. These data types are discussed further with specific sources used as examples.
General business sources
Businesses publish a lot of information in the form of books, periodicals, journals, news- papers, magazines, reports and trade literature. This information can be located by using guides, directories and indexes. Sources are also available to identify statistical data.
Guides. Guides are an excellent source of standard or recurring information. A guide may help identify other important sources of directories, trade associations and trade publications. Guides are one of the first sources a researcher should consult. The fol- lowing example illustrates the use of the Electronic Buyer’s Guide.
Published external secondary sources
External data Data that originate outside the organisation.
Directories Indexes Statistical data
Guides
Published secondary data
General business sources Government
sources
Other government data Census data
Figure 4.2 A classification of published secondary sources
Keeping up to data10
The market for business information is growing and the shift towards electronic sources con- tinues. The choice of new media for directory publishers includes offline methods, such as CD-ROM, and online, such as the Internet. In addition, while online systems account for most information sales, the use of CDs is growing faster.
Access to up-to-date information is a big attraction. There is a perception that on-screen information is more up-to-date than a book. However, many CD-ROM directories are not updated any more frequently than their paper equivalents. So, while information on the Internet can be kept up-to-date, CD-ROMs come into their own when storing large amounts of information.
Miller Freeman launched the Electronic Buyer’s Guide in 1996 and by October 1997 it was on the Internet (see www.mfi.com). There is some information available free of charge; if more information is wanted then there are charges. Alternatively, anyone who buys the guide on CD-ROM is given a password that gives them free access to the Internet directory. ■
Directories. Directories are helpful for identifying individuals or organisations that collect specific data. An example of a directory that you can examine on the Internet is the Central and Eastern European Business Directory. This interactive site provides current information on businesses and organisations in 24 central and eastern European countries (www.ceebd.co.uk). Another example is Europages, a reference business directory in Europe that classifies 500,000 companies in 30 European coun- tries. Again, this can be accessed through the Internet and is available in English, French, German, Italian and Spanish versions (www.europages.com).
Indexes. It is possible to locate information on a particular topic in several different publications by using an index and abstracts. Indexes and abstracts, therefore, can increase the efficiency of the search process. Several indexes and abstracts are available for both academic and business sources. Examples of newspaper indexes include the Financial Times Index(www.news.ft.com),Le Monde Index (www.le-monde.fr), and the Japanese Business News online,The Nikkei Weekly (www.nikkei.co.jp). These indexes allow researchers to identify sources of particular topics, industries and individuals.
An example of a marketing index is the Marketing Surveys Index published by Euromonitor (www.euromonitor.com). This is a most comprehensive and up-to-date directory of business research on European and world markets. The index contains details of published research reports, a brief summary of its contents, a keyword index to the markets and products covered, and bibliographic details of the report.
A particularly useful abstract for marketing researchers is the Market Research Abstractspublished by the Market Research Society in Britain (www.mrs.org.uk). Major European and American journals that relate to marketing research are reviewed and an abstract of each article is presented. The abstract is published twice a year. It is divided into sections that cover survey techniques; statistics, models and forecasting;
attitude and behaviour research; psychographics, personality and social psychology;
advertising and media research; applications of research; industrial market research;
market research and general applications; and new product development. Such an abstract allows the researcher to quickly identify and evaluate the worth of journal papers that are relevant to their particular study.
Non-government statistical data. Published statistical data are of great interest to researchers. Graphic and statistical analyses can be performed on these data to draw important insights. Examples of non-governmental statistical data include trade associ- ations such as the Swedish Tourism Trade Association (www.sverigeturism.se). The Swedish Information ‘Smorgasbord’ is a large single source of information in English on Sweden, Swedish provinces, nature, culture, lifestyle, society and industry. Another e x a m p l e
example is Euromonitor (www.euromonitor.com), which publishes monthly market research journals covering subjects under the headings of Market Research Europe, Market Research GB, Market Research International and Retail Monitor International.
The United Nations provides an example of an organisation with a Statistics Division that provides a wide range of statistical outputs on a global basis (www.un.org/depts/unsd). The Statistics Division produces printed publications of sta- tistics and statistical methods in the fields of international merchandise trade, national accounts, demography and population, social indicators, gender, industry, energy, environment, human settlements and disability. The Division also produces general statistical compendiums including the Statistical Yearbook and World Statistics Pocketbook. Many of the Division’s databases in these fields are available as electronic publications in the form of CD-ROM, diskette and magnetic tape and on the Internet.
Government sources
European governments and the EU also produce large amounts of secondary data. Each European country has its own statistical office which produces lists of the publications available (and the costs involved). Examples of national statistical offices include the Centraal Bureau voor de Statistiek Nederlands (www.cbs.nl), Danmarks Statistik (www.dst.dk), the Federal Statistical Office of Germany (www.statistik-bund.de), the French Institut National de la Statistique et des Études Economiques (www.insee.fr), and the British Office for National Statistics (www.statistics.gov.uk). All of these offices have Internet links that allow you to quickly examine the array of publications that they pro- duce. Their publications may be divided into census data and other publications.
Census data. Most European countries produce either catalogues or newsletters that describe the array of census publications available and the plans for any forth- coming census. In Britain, for example, Census News (www.statistics.gov.uk/
census2001/cennews.asp) is a newsletter that contains the latest information about the 2001 census and previous censuses and is available four to six times a year. Census Marketing in Britain can supply unpublished data from the 1961, 1971, 1981 and 1991 censuses in the form of Small Area Statistics (SAS). SAS are available for stan- dard census areas within England and Wales, such as counties, local government districts, London boroughs, wards, civil parishes and enumeration districts. Maps can also be purchased to complement the data.
Census data can be kept in electronic formats, allowing it to be analysed and pre- sented in a variety of formats at a detailed geographical level. Given the long periods between national censuses and the amount of change that can occur in these periods, other data sources are used to maintain an up-to-date picture of specific regions.
As well as general population censuses, national statistical offices produce an array of industrial censuses. These may include industrial production, housing, construction, agriculture, restaurants and hotels, and financial services, for example www.statistics.gov.uk/statbase/mainmenu.asp.
Other government publications. In addition to the census, national statistical offices collect and publish a great deal of statistical data. Examining the Department of Statistics and Research in Cyprus as an example (www.pio.gov.cy), major industrial categories such as agriculture, construction, retailing and tourism are classified, with a whole array of available statistics. More generally, demographic, health, household income and expenditure, and labour statistical reports are also available.
Examples of reports from the British Office for National Statistics include Family Spendingand Economic Trends (www.statistics.gov.uk/statbase/publication.asp).Family Spendingprovides a snapshot of household spending in the UK, explaining in detail how consumers spend their money. Expenditure patterns are broken down by age, economic
Published external secondary sources
status, income and geography.Economic Trendsprovides monthly macroeconomic sta- tistics of economic trends which include key data such as national accounts, gross domestic product, disposable income, balance of payments, trade in goods, prices, labour market information, industrial output, consumer sales credit and interest rates, as well as extensive commentary to put all this information into context.
In the EC, statistics are collected and published by the Statistical Office of the European Community (SOEC) in a series called Eurostat (www.europa.eu.int/com/euro stat). Tables normally contain figures for individual member states of the EU plus totals for all countries. Eurostat divides its publications into themes, which are:
■ Theme 1– General statistics
■ Theme 2 – Economy and finance
■ Theme 3– Population and social conditions
■ Theme 4– Energy and industry
■ Theme 5– Agriculture, forestry and fisheries
■ Theme 6– External trade
■ Theme 7– Distributive trades, services and transport
■ Theme 8 – Environment
■ Theme 9– Research and development.
It also produces general titles which include Eurostat Yearbook(annual),Basic Statistics (annual),Europe in Figures(annual),Key Figures(monthly) and Eurostatistics(monthly).
To examine any of the national statistics offices in Europe, visit www.cso.ie/
links/eurolinks.htmland follow a link to the country of your choice. To examine other inter- national statistics organisations visit www.cso.ie/links/interlinks.html.
Computerised databases
Most published information is also available in the form of computerised databases.
Computerised databases contain information that has been made available in computer readable form for electronic distribution. From the 1980s through to today, the number of databases, as well as the vendors providing these services, has grown enormously.
Computerised databases offer a number of advantages over printed data, including:11 1 The data are current and up-to-date, as publishers and data compilers are now
using computers as the primary production technology.
2 The search process is more comprehensive, quicker and simpler. Online vendors provide ready access to hundreds of databases. Moreover, this information can be accessed instantaneously, and the search process is simplified as the vendors pro- vide uniform search protocols and commands for accessing the database.
3 The cost of accessing these is relatively low, because of the accuracy of searching for the right data, and the speed of location and transfer of data.
4 It is convenient to access these data using a personal computer fitted with an appro- priate communication device, such as a modem or a communication network.
While computerised database information can be helpful, it is vast and can be confus- ing. Thus a classification of computerised databases is helpful.
Classification of computerised databases
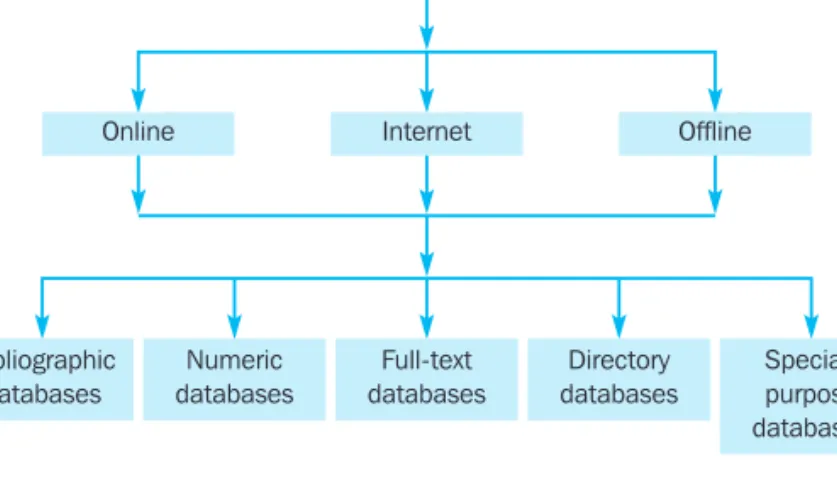
Computerised databases may be classified as online, Internet or offline as shown in Figure 4.3. Online databases consist of a central data bank that is accessed with a computer (or dumb terminal) via a telecommunications network. Internet databases can be accessed, searched and analysed on the Internet. It is also possible to download data from the Internet and store it in the computer or an auxiliary storage device.12
Offline databases make the information available on diskettes and CD-ROM disks.
Thus, offline databases can be accessed at the user’s location without the use of an external telecommunications network.13
Online,Internetand offline databasesmay be further classified as bibliographic, numeric, full text, directory or special-purpose databases.Bibliographic databases are composed of citations to articles in journals, magazines, newspapers, marketing research studies, technical reports, government documents and the like.14They often provide summaries or abstracts of the material cited. The earlier example ofMarket Research Abstracts(www.imriresearch.com/index.html) is an example of a bibliographic database. Another example is the Aslib Index to Theses(www.theses.com); this biblio- graphic database lists theses at masters and doctoral level and research degrees, including abstracts from Britain and Ireland.
Numeric databasescontain numerical and statistical information. For example, some numeric databases provide time series data about the economy and specific industries. The earlier examples of census-based numeric databases using data over a series of censuses provide an example of a numeric database.
Full-text databases contain the complete text of the sources of the database.
Examples include World Advertising Research Center WARC (www.warc.com), Searchbank: European ASAP(www.infotrac.london.galegroup.com) and FT Discovery (www.lexis-nexis.com).WARC is a supplier of intelligence to the global marketing, adver- tising, media and research communities.Searchbankhas over 100 full-text journals on subjects including business, economics, current affairs and new technologies. It includes a spectrum of journals from professional trade publications through to refereed aca- demic journals.FT Discoverypresents the Global Newslink that gives full access to the Financial Times, World Reporter, Europe Intelligence Wire and Asia Intelligence Wire. It is possible to search on specific countries, sectors and publications.
Directory databasesprovide information on individuals, organisations and serv- ices.European Interactive Directories (www.euroyellowpages.com) is an example of a directory that has channels based upon EU community activities, country channels and thematic channels such as suppliers, wholesalers and shopping centres. Another example worth examining is the ESOMARdirectory (www.esomar.nl) which provides details of member organisations throughout the world as well as many other publica- tions of value to marketing researchers based in Europe.
Finally, there are special-purpose databases. For example, the Non-Governmental Organisation NGO directory (www.rec.org/REC/Databases/NGODirectory/ NGOfind.html) helps to track down information about environmental organisations working in cen- tral and eastern Europe. It has contact information for over 2,700 organisations from over 15 central and eastern European countries.
Computerised databases
Online databases Databases, stored in computers, that require a telecommunications network to access.
Full-text databases Numeric
databases Bibliographic
databases
Directory databases
Special- purpose databases Computerised
databases
Internet
Online Offline
Figure 4.3 A classification of computerised databases
Offline databases Databases that are available on diskette or CD-ROM.
Internet databases Databases that can be accessed, searched and analysed on the Internet. It is also possible to download data from the Internet and store it on the computer or an auxiliary device.
Bibliographic databases Databases composed of citations to articles in journals, magazines, newspapers, marketing research studies, technical reports, government documents, and the like. They often provide summaries or abstracts of the material cited.
Numeric databases Databases containing numerical and statistical information that may be important sources of secondary data.
Full-text databases Databases that contain the complete text of secondary source documents comprising the database.
Directory databases Databases that provide information on individuals, organisations and services.
Special-purpose databases Databases that contain information of a specific nature, e.g. data on a specialised industry.
In addition, virtually all libraries of major universities maintain special-purpose databases of research activities that reflect the distinct specialisms of that university.
Beyond the internally generated, special-purpose databases, university libraries and reference libraries maintain computerised databases with instructions relating to what may be accessed and how it may be accessed. Another library source worth examining for computerised sources is the European Commission’s ‘Libraries’ site (www.europa.eu.int). The site, which is multilingual, is distributed by the EUROPA server. EUROPA is the portal site of the European Union. It provides up-to-date cov- erage of European affairs and essential information on European integration. Users can access Websites of each of the EU institutions.
Syndicated sources of secondary data
In addition to published data or data available in the form of computerised databases, syndicated sources constitute the other major source of external secondary data.
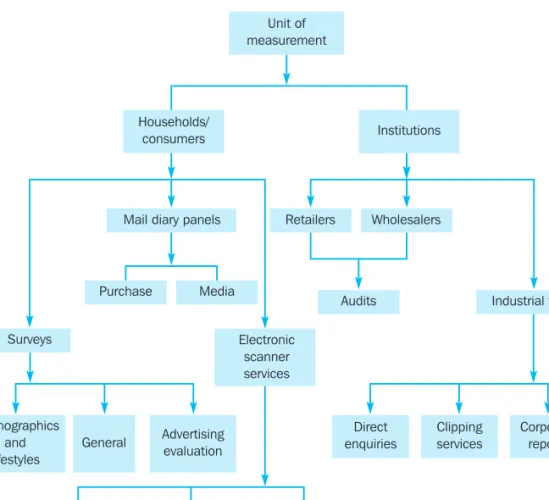
Syndicated sources, also referred to as syndicated services, are companies that collect and sell common pools of data designed to serve information needs shared by a number of clients. These data are not collected with a focus on a specific marketing problem, but the data and reports supplied to client companies can be personalised to fit specific needs. For example, reports could be organised based on the clients’ sales territories or product lines. Using syndicated services is frequently less expensive than commissioning tailored primary data collection. Figure 4.4 presents a classification of syndicated sources. Syndicated sources can be classified based on the unit of measure-
Households/
consumers
Mail diary panels
Surveys Electronic
scanner services
General Psychographics
and lifestyles
Advertising evaluation
Scanner diary panels Voluming
tracking data
Scanner diary panel with
cable TV
Wholesalers
Clipping services
Corporate reports Direct
enquiries Retailers
Audits Unit of
measurement
Institutions
Purchase Media
Industrial firms
Figure 4.4 A classification of syndicated services Syndicated sources (services)
Information services offered by marketing research organisations that provide information from a common database to different firms that subscribe to their services.
ment (households and consumers or institutions). Household and consumer data may be obtained from surveys, diary panels or electronic scanner services.
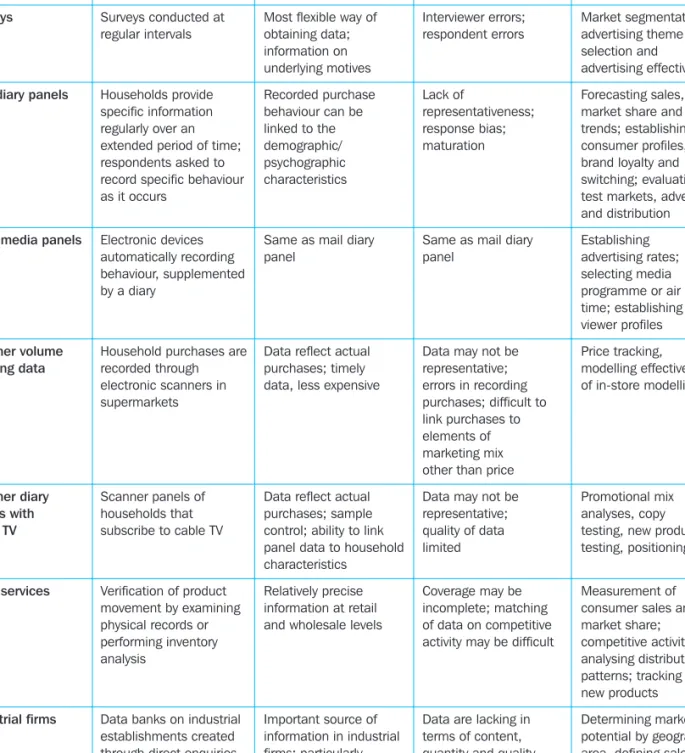
Information obtained through surveys consists of values and lifestyles, advertising evaluation, or general information related to preferences, purchase, consumption and other aspects of behaviour. Diary panels emphasise information on purchases or media consumption. Electronic scanner services might provide scanner data only, scanner data linked to diary panels, or scanner data linked to diary panels and (cable) TV. When institutions are the unit of measurement, the data may be obtained from retailers, wholesalers or industrial firms. An overview of the various syndicated sources is given in Table 4.3. Each of these sources will be discussed.
Syndicated sources of secondary data
Type Characteristics Advantages Disadvantages Uses
Surveys Surveys conducted at Most flexible way of Interviewer errors; Market segmentation, regular intervals obtaining data; respondent errors advertising theme
information on selection and
underlying motives advertising effectiveness
Mail diary panels Households provide Recorded purchase Lack of Forecasting sales, specific information behaviour can be representativeness; market share and regularly over an linked to the response bias; trends; establishing extended period of time; demographic/ maturation consumer profiles,
respondents asked to psychographic brand loyalty and
record specific behaviour characteristics switching; evaluating
as it occurs test markets, advertising
and distribution Diary media panels Electronic devices Same as mail diary Same as mail diary Establishing
automatically recording panel panel advertising rates;
behaviour, supplemented selecting media
by a diary programme or air
time; establishing viewer profiles Scanner volume Household purchases are Data reflect actual Data may not be Price tracking, tracking data recorded through purchases; timely representative; modelling effectiveness
electronic scanners in data, less expensive errors in recording of in-store modelling
supermarkets purchases; difficult to
link purchases to elements of marketing mix other than price
Scanner diary Scanner panels of Data reflect actual Data may not be Promotional mix panels with households that purchases; sample representative; analyses, copy cable TV subscribe to cable TV control; ability to link quality of data testing, new product
panel data to household limited testing, positioning characteristics
Audit services Verification of product Relatively precise Coverage may be Measurement of movement by examining information at retail incomplete; matching consumer sales and physical records or and wholesale levels of data on competitive market share;
performing inventory activity may be difficult competitive activity;
analysis analysing distribution
patterns; tracking of new products Industrial firms Data banks on industrial Important source of Data are lacking in Determining market
establishments created information in industrial terms of content, potential by geographic through direct enquiries firms; particularly quantity and quality area, defining sales of companies, clipping useful in initial phases territories, allocating
services and corporate of the projects advertising budget
reports
Table 4.3 Overview of syndicated services
Syndicated data from households
Surveys
Various syndicated services regularly conduct surveysand omnibus surveys. In gen- eral, these surveys involve interviews with a large number of respondents using a pre-designed questionnaire. The distinction of the omnibus survey (example at www.mori.com/charity/omnibus.shtml) is that it targets particular types of respondents such as those in certain geographic locations, e.g. Luxembourg residents, or con- sumers of particular types of products, e.g. business air travellers. With that target group of respondents, a core set of questions can be asked with other questions added as syndicate members wish. Other syndicate members can ‘jump on the omnibus’ and buy the answers to all the questionnaire responses or to specific questions of their choice. Surveys and omnibus surveys may be broadly classified based on their content as psychographics and lifestyles, advertising evaluation, or general surveys.
Psychographics and lifestyles. Psychographicsrefer to the psychological profiles of individuals and to psychologically based measures of lifestyle.Lifestylesrefer to the distinctive modes of living of a society or some of its segments. Together, these measures are generally referred to as activities, interests and opinions.
Advertising evaluation.The purpose of advertising evaluation surveys is to assess the effectiveness of advertising using print and broadcast media. Television commer- cials are evaluated using either the recruited audience method or the in-home viewing method. In the former method, respondents are recruited and brought to a central viewing facility, such as a theatre or mobile viewing laboratory. The respondents view the commercials and provide data regarding knowledge, attitudes and preferences related to the product being advertised and the commercial itself. See example at www.bmrb.co.uk/researchingadvertising/addevelopment.htm.
In the in-home viewing method, consumers evaluate commercials at home in their normal viewing environment. New commercials can be pre-tested at the network level or in local markets. A survey of viewers is then conducted to assess the effective- ness of the commercials.
General surveys. Surveys are also conducted for a variety of other purposes, includ- ing examination of purchase and consumption behaviour. Because a variety of data can be obtained, survey data have numerous uses. They can be used for market seg- mentation, as with psychographic and lifestyle data, and for establishing consumer profiles. Surveys are also useful for determining product image, measurement and positioning, and conducting price perception analysis. Other notable uses include advertising theme selection and evaluation of advertising effectiveness.
Mail diary panels
Often, survey data can be complemented with data obtained from diary panels (see example at www.tnsofres.com/about/americas/argentina/argentina.cfm). Panels were discussed in Chapter 3 in the context of longitudinal research designs. Diary panels are samples of respondents who provide specified information at regular intervals over an extended period of time. These respondents may be organisations, house- holds or individuals, although household diary panels are most common. The distinguishing feature of diary panels is that the respondents record specific behav- iours as they occur, in a diary. Typically, the diary is returned to the research organisation every one to four weeks. Panel members are compensated for their
Omnibus survey A distinctive form of survey that serves the needs of a syndicate group. The omnibus survey targets particular types of respondents such as those in specific locations, e.g.
Luxembourg residents, or customers of particular types of product, e.g. business air travellers. With that target group of respondents, a core set of questions can be asked with other questions added as syndicate members wish.
Lifestyles
Distinctive patterns of living described by the activities people engage in, the interests they have, and the opinions they hold of themselves and the world around them.
Psychographics Quantified profiles of individuals based upon lifestyle characteristics.
Surveys
Interviews with a large number of people using a
questionnaire.
participation with gifts, coupons, information or cash. Based on the content of infor- mation recorded, diary panels can be classified as diary purchase panels or diary media panels.
In diary media panels, electronic devices automatically record viewing behaviour, thus supplementing a diary.Diary media panelsyield information helpful for estab- lishing advertising rates by radio and TV networks, selecting appropriate programming, and profiling viewer or listener subgroups. Advertisers, media planners and buyers find panel information particularly useful.Diary purchase panelsprovide information useful for forecasting sales, estimating market shares, assessing brand loyalty and brand-switching behaviour, establishing profiles of specific user groups, measuring promotional effectiveness, and conducting controlled store tests.
Compared with sample surveys (see Chapter 10), diary panels offer certain distinct advantages.15Panels can provide longitudinal data (data can be obtained from the same respondents repeatedly). People who are willing to serve on panels may provide more and higher-quality data than sample respondents. In diary purchase panels, informa- tion is recorded at the time of purchase, eliminating recall errors.16 Information recorded by electronic devices is accurate because it eliminates human errors.
The disadvantages of diary panels include lack of representativeness, maturation and response biases. They may under-represent certain groups such as minorities and those with low education levels. This problem is further compounded by refusal to respond and attrition of panel members. Over time, maturation sets in, and the panel members must be replaced. Response biases may occur, since simply being on the panel may alter behaviour. Because purchase or media data are entered by hand, recording errors are also possible (see Chapter 3).
Electronic scanner services
The following example illustrates the nature and scope of electronic scanner services as undertaken by A.C. Nielsen, who conduct consumer panel services in 18 countries around the world.
A.C. Nielsen – the business economist at work17
Most of A.C. Nielsen’s revenue comes from selling information on fast-moving consumer goods(FMCG). This information is compiled from either scanner data obtained from thou- sands of supermarkets, pharmacists and department stores, or from a 40,000-household panel who electronically record every aspect of every goods purchase they made using that item’s bar code.
They go beyond their standard forms of analysing and presenting existing data to more cre- ative interpretations that attempt to tell the marketer something he or she does not know.
Often, creativity is valued more than sophisticated econometric techniques, as illustrated in the following two examples.
Inventory and sales data are available on food store retail sales, so an inventory–sales ratio can be calculated. This ratio had been increasing for several years up to 1992 when it began to shrink. Yet it is generally accepted that the size of the average new store is increasing, implying the need for additional inventories relative to sales. Coincidentally, more sophisti- cated inventory management techniques have become especially prevalent in food stores in recent years. Apparently, the ratio is being driven more by improved inventory management than by the opening of new, larger stores. A discrete cause and effect cannot be proven, but a linkage between the ratio and better inventory control mechanisms is highly probable.
Consumer spending patterns in Asia are very difficult to analyse, given the paucity of data available and the lack of data comparability across countries or spending components. By cal- culating consumer spending on food as a share of total consumer spending, and then ordering the results by per capita GDP, a relationship becomes obvious. Poorer countries Syndicated data from households
Diary media panels A data gathering technique composed of samples of respondents whose television viewing behaviour is automatically recorded by electronic devices, supplementing the purchase information recorded in a diary.
Diary purchase panels A data gathering technique in which respondents record their purchases in a diary.
e x a m p l e
spend proportionately more of their resources on food, around 50%. For middle-income coun- tries, this ratio slides from around 40% to 20%, and then holds steady near 20% for the developed economies. The implication is that, as a country obtains a middle-income status, because of this declining ratio, food sales will not grow as fast as other categories of con- sumer spending. ■
Although information provided by surveys and diary panels is useful, electronic scanner services are becoming increasingly popular. The role of scanned data as a foundation to developing sophisticated consumer databases is developed in Chapter 5. In this chapter we examine scanned data as a distinct source of syndicated data.
Scanner datareflect some of the latest technological developments in the marketing research industry. They are collected by passing merchandise over a laser scanner that optically reads the bar-coded description (Universal Product Code, or UPC) printed on the merchandise. This code is then linked to the current price held in the com- puter memory and used to prepare a sales slip. Information printed on the sales slip includes descriptions as well as prices of all items purchased. Checkout scanners, now used in many retail stores, are revolutionising packaged goods marketing research.
Three types of scanner data are available:volume tracking data,scanner diary panels, and scanner diary panels with cable TV. Volume tracking data provide infor- mation on purchases by brand, size, price and flavour or formulation, based on sales data collected from the checkout scanner tapes. This information is collected nation- ally from a sample of supermarkets with electronic scanners. In scanner diary panels, each household member is given an ID card that looks like a credit card. Panel mem- bers present the ID card at the checkout counter each time they shop. The checker keys in the ID numbers and each item of that customer’s order. The information is stored by day of week and time of day.18
An even more advanced use of scanning, scanner diary panels with cable TV, com- bines diary panels with new technologies growing out of the cable TV industry.
Households on these panels subscribe to one of the cable or TV systems in their market. By means of a cable TV ‘split’, the researcher targets different commercials into the homes of the panel members. For example, half the households may see test commercial A during the 6:00 pm newscast while the other half see test commercial B.
These panels allow researchers to conduct fairly controlled experiments in a relatively natural environment.19
Uses of scanner data. Scanner data are useful for a variety of purposes.20National volume tracking data can be used for tracking sales, prices and distribution, for mod- elling, and for analysing early warning signals. Scanner diary panels with cable TV can be used for testing new products, repositioning products, analysing promotional mix, and making advertising decisions, including budget, copy and media, and pricing.
These panels provide marketing researchers with a unique controlled environment for the manipulation of marketing variables.
Advantages and disadvantages of scanner data. Scanner data have an obvious advantage over surveys and diary panels; they reflect purchasing behaviour that is not subject to interviewing, recording, memory or expert biases. The record of purchases obtained by scanners is complete and unbiased by price sensitivity, because the panel- list is not required to be particularly conscious of price levels and changes. Another advantage is that in-store variables such as pricing, promotions and displays are part of the dataset. The data are also likely to be current and can be obtained quickly. Finally, scanner panels with cable TV provide a highly controlled testing environment.
Scanner data Data obtained by passing merchandise over a laser scanner that reads the UPC code from the packages.
Volume tracking data Scanner data that provide information on purchases by brand, size, price, and flavour or formulation.
Scanner diary panels Scanner data where panel members are identified by an ID card, allowing information about each panel member’s purchases to be stored with respect to the individual shopper.
Scanner diary panels with cable TV
The combination of a scanner diary panel with manipulations of the advertising that is being broadcast by cable television companies.