1 23
Ecosystems ISSN 1432-9840 Ecosystems
DOI 10.1007/s10021-014-9830-0
Soil Development and Nutrient Availability Along a 2 Million-Year Coastal Dune
Chronosequence Under Species-Rich
Mediterranean Shrubland in Southwestern Australia
Benjamin L. Turner & Etienne Laliberté
1 23
Your article is protected by copyright and all
rights are held exclusively by Springer Science
+Business Media New York. This e-offprint is
for personal use only and shall not be self-
archived in electronic repositories. If you wish
to self-archive your article, please use the
accepted manuscript version for posting on
your own website. You may further deposit
the accepted manuscript version in any
repository, provided it is only made publicly
available 12 months after official publication
or later and provided acknowledgement is
given to the original source of publication
and a link is inserted to the published article
on Springer's website. The link must be
accompanied by the following text: "The final
publication is available at link.springer.com”.
Soil Development and Nutrient Availability Along a 2 Million-Year Coastal Dune Chronosequence Under
Species-Rich Mediterranean Shrubland in Southwestern
Australia
Benjamin L. Turner
1* and Etienne Laliberte´
21Smithsonian Tropical Research Institute, Apartado 0843-03092, Balboa, Ancon, Republic of Panama;2School of Plant Biology, The University of Western Australia, Crawley, Perth, Western Australia 6009, Australia
A
BSTRACTSoil chronosequences provide valuable model systems to investigate pedogenesis and associated effects of nutrient availability on biological com- munities. However, long-term chronosequences occurring under seasonally dry climates remain scarce. We assessed soil development and nutrient dynamics along the Jurien Bay chronosequence, a 2 million-year sequence of coastal dunes in southwestern Australia. The chronosequence is significant because it occurs in a Mediterranean climate and supports hyperdiverse shrublands within a global biodiversity hotspot. Young soils formed during the Holocene (<6,500 years old) are strongly alkaline and contain abundant car- bonate, which is leached from the profile within a few thousand years. Middle Pleistocene soils (ca 120,000–500,000 years old) are yellow decalcified sands with residual iron oxide coatings on quartz
grains over a petrocalcic horizon that occurs at increasing depth as soils age. Early Pleistocene soils (>2,000,000 years old) are completely lea- ched of iron oxides and consist of bleached quartz sand several meters deep. Changes in soil organic matter and nutrient status along the Jurien Bay chronosequence are consistent with patterns observed along other long-term chronosequences and correspond closely to expectations of the Walker and Syers (1976) model of biogeochemical change during pedogenesis. Organic carbon and nitrogen (N) accumulate rapidly to maximum amounts in intermediate-aged Holocene dunes and then decline as soils age. In contrast, total phosphorus (P) declines continuously along the chronosequence to extremely low levels after 2 million years of pedogenesis, eventually repre- senting some of the lowest P soils globally. Ratios of soil organic carbon to P and N to P increase continuously along the chronosequence, consis- tent with a shift from N limitation on young soils to extreme P limitation on old soils. Phosphorus fractionation by sequential extraction reveals a rapid decline in primary and non-occluded phos- phate and an increase in organic and occluded P as soils age. Concentrations of extractable (that is,
Received 25 June 2014; accepted 20 October 2014
Electronic supplementary material:The online version of this article (doi:10.1007/s10021-014-9830-0) contains supplementary material, which is available to authorized users.
Author contributions BT and EL designed the study and conducted the fieldwork. BT conducted laboratory analysis and wrote the manu- script, with input from EL.
*Corresponding author; e-mail:[email protected] Ecosystems
DOI: 10.1007/s10021-014-9830-0
2014 Springer Science+Business Media New York
Author's personal copy
readily bioavailable) N and P, as well as exchangeable cations, are greatest in Holocene dunes and decline to low levels in Pleistocene dunes. Extractable micronutrient concentrations were generally very low and varied little across the chronosequence. We conclude that the Jurien Bay chronosequence is an important example of
changing patterns of nutrient limitation linked to long-term soil and ecosystem development under a Mediterranean climate.
Key words: chronosequence; ecosystem devel- opment; pedogenesis; nutrients; phosphorus;
nitrogen.
I
NTRODUCTIONA soil chronosequence is a series of soils that differ from each other only in the time since the onset of their formation (Stevens and Walker 1970; Vito- usek 2004). Other soil-forming factors, including parent material, topography, climate, and vegeta- tion, are held relatively constant, although it is recognized that climate and vegetation rarely con- form strictly to this definition (Huggett 1998).
Nevertheless, soil chronosequences provide an important means of assessing pedogenesis and associated patterns of nutrient availability and limitation in terrestrial ecosystems over timescales from hundreds to millions of years (Vitousek2004;
Walker and others 2010; Turner and Condron 2013).
Typically, nutrient availability follows a predict- able pattern during long-term pedogenesis (Walker and Syers 1976). Nitrogen (N) is absent from most parent materials, but accumulates quickly in young soils through biological N fixation (Menge and Hedin 2009). In contrast, phosphorus (P) declines continually as pedogenesis proceeds, as it is lost in runoff at a greater rate than it is supplied by bed- rock weathering and atmospheric deposition (Walker and Syers 1976). At the same time, chemical and biological transformations further reduce the availability of the P remaining in the soil by converting primary mineral phosphate into or- ganic forms and occluding them within secondary minerals (Walker and Syers1976; Parfitt and others 2005; Turner and others2007). As a result, primary productivity tends to be limited by N availability on young soils and by P availability on old soils (Vitousek and Farrington 1997; Laliberte´ and oth- ers 2012; Coomes and others 2013). In very old soils on stable landscapes, P limitation can become strong enough to constrain plant biomass, produc- tivity, and other ecosystem processes, termed
‘ecosystem retrogression’ (Wardle and others 2004), and to influence the distribution and diversity of plant and microbial communities (Williamson and others 2005; Lambers and others
2008; Jangid and others2013; Laliberte´ and others 2013a, 2014).
Long-term retrogressive soil chronosequences have been identified in only a few locations around the world (Peltzer and others 2010). Well-known examples are the Hawaiian Islands chronosequence (Crews and others1995; Vitousek2004), the Franz Josef post-glacial chronosequence in New Zealand (Walker and Syers1976), and the Cooloola coastal dune chronosequence in eastern Australia (Thompson1981). However, the majority of these chronosequences occur in relatively humid cli- mates, with only a small number in more arid ecosystems. These include the 3 million-year San Joaquin alluvial terrace sequence under Mediter- ranean grassland in California (Harden 1982;
Baisden and others 2002) and the 3 million-year basalt chronosequence in the Northern Arizona Volcanic Field, which supports a semiarid pin˜on–
juniper woodland (Selmants and Hart2008,2010).
Long-term nutrient dynamics might be expected to deviate from the Walker and Syers (1976) model in dry ecosystems through a slower rate of P loss by leaching (Lajtha and Schlesinger1988). However, both the Northern Arizona and the San Joaquin chronosequences show patterns of soil nutrients that are consistent with the Walker and Syers model of nutrient dynamics during pedogenesis.
Additional information from similar arid environ- ments around the world, which includes much of the Australian continent, is required to confirm the broad applicability of the Walker and Syers (1976) model to Mediterranean ecosystems.
Here we report the results of a study of soils along a 2 million-year coastal dune chronose- quence at Jurien Bay, Western Australia. The chronosequence occurs under a Mediterranean climate but differs from the previously studied dry chronosequences in terms of its origin and parent material (coastal carbonate dunes) and is of par- ticular interest because of the exceptionally high levels of plant diversity due to its location within a global biodiversity hotspot (the Southwest B. L. Turner and E. Laliberte´
Author's personal copy
Australian Floristic Region) (Hopper and Gioia 2004). A glasshouse nutrient-addition experiment using soils from the Jurien Bay chronosequence found evidence for a shift from N to P limitation (Laliberte´ and others 2012), which was supported by a subsequent analysis of foliar nutrient con- centrations and resorption efficiency in naturally occurring plants in the field (Hayes and others 2014). Here we report the results of a detailed assessment of (i) pedogenesis through soil profile descriptions and nutrient budgets, (ii) the dynamics of organic matter, (iii) amounts and composition of soil P, and (iv) biologically available nutrient con- centrations, including N, P, major cations, and micronutrients.
T
HEJ
URIENB
AYC
HRONOSEQUENCEThe 2 million-year Jurien Bay dune chronose- quence is located in southwestern Australia, approximately 200 km north of Perth (3001¢–
3024¢ south, 11457¢–11511¢ east; Figure1A).
The chronosequence is part of the Swan Coastal Plain, where a series of coastal sand deposits run parallel to the coastline for approximately 400 km from Busselton in the south to Jurien Bay in the north (McArthur and Bettenay 1974; McArthur 2004). The sand deposits were formed by sea level fluctuations since the Early Pleistocene (or possibly Late Pliocene), approximately 2.59 million years ago (Kendrick and others 1991; Laliberte´ and oth- ers 2012). The Swan Coastal Plain lies within the Perth Basin, which extends approximately 1000 km north–south along the coast of south- western Australia. The Perth Basin is bounded to
the east by the Darling Fault, which separates it from the Archean Yilgarn Block, part of the Wes- tern Australian Shield (Playford and others1976).
Coastal dune soils in the Swan Coastal Plain have been grouped into three main units based on the corresponding dune systems (McArthur and Bet- tenay 1974; McArthur 2004; Laliberte´ and others 2012). The three dune systems (Quindalup, Spearwood, and Bassendean) correspond generally with the Safety Bay Sand, the Tamala Limestone, and the Bassendean Sand, respectively (Table1) (Playford and others1976).We delineated six main chronosequence stages within these three dune systems (see below). The Spearwood and Bassen- dean dunes are more than 20 km wide in places along the Swan Coastal Plain, although the Bas- sendean dunes disappear abruptly north of the Jurien Bay area. Below we describe the Jurien Bay chronosequence in the context of the major soil- forming factors of time, parent material, climate, vegetation, and topography (Jenny 1941), as well as the influence of disturbance on the integrity of the chronosequence.
Ages of Dune Formation
Sea level changes during the Quaternary are now well established based on marine oxygen isotope records (for example, Lambeck and Chappell2001;
Berger 2008; Lewis and others 2013) and provide the basis for understanding coastal dune succession along the Jurien Bay chronosequence. Sea level has lowered progressively since the Miocene, punctuated by periodic sea level high stands asso- ciated with interglacial periods (Miller and others
Figure 1. Map of Australia (A), showing the location of the Jurien Bay chronosequence, and a detailed map of the Jurien Bay area (B), showing the three main dune systems (Quindalup, Spearwood, and Bassendean) and the locations of the six profile pits. Note that the Eatha, Nylagarda, and Yerramullah soils are not part of the chronosequence.
Soil Development and Nutrient Availability
Author's personal copy
2005). The major dune units that occur along the Jurien Bay chronosequence most likely correspond with the greatest sea level high stands, with dunes formed during lower-level high-stands being reworked or submerged by subsequent high stands (Brooke and others 2014).
Coastal dunes in southwestern Australia represent three main phases of dune development associated with global sea level high stands during the Holocene, Middle Pleistocene, and Early Pleistocene (Table1).
Even older sand deposits, the Yoganup Formation, occur in the region at the foot of the Darling Escarp- ment (Kendrick and others1991). The formation is probably older than Pliocene but is not well under- stood and is not included in the Jurien Bay chrono- sequence, which extends only to deposits ranging in age from the present to the Early Pleistocene, or possibly Late Pliocene (Kendrick and others1991).
The oldest deposits along the Jurien Bay chrono- sequence are the Bassendean dunes. These have been assigned an Early Pleistocene age based on their interpretation as the dune facies of the underlying Ascot Formation, which has been dated by marine fossil assemblages (Kendrick and others1991).
The Spearwood dunes formed during the Middle Pleistocene, ca 120,000–500,000 years ago. Based on heavy mineral assemblages, five Spearwood dune sub-systems have been recognized in the Perth area (with increasing age from west to east, the Trigg, Karrinyup, Gwelup, Balcatta, and Yokine Dunes) (Bastian1996), although they have proven difficult to date precisely (Hewgill and others1983;
Murray-Wallace and Kimber1989; Price and others 2001; Hearty and O’Leary2008). However, there is widespread agreement that the youngest Spear- wood dune system corresponds to the last inter- glacial sea level high stand (Marine Isotope Stage (MIS) 5e, ca 116,000–128,000 years ago) (Stirling
and others 1998), and the increasing age of the dune systems with progression inland is supported by several lines of evidence, including heavy min- eral assemblages and dating by thermolumines- cence, optically stimulated luminescence, electron- spin resonance, and amino-acid racemization (Bastian 1996; Price and others 2001; Hearty and O’Leary 2008; Brooke and others 2014). Older dunes presumably correspond to earlier major sea level high stands, which occurred at approximately 220,000 years (MIS 7), 330,000 years (MIS 9), 410,000 years (MIS 11), and 480,000 years (MIS 13) (Lisiecki and Raymo 2005). The upper age of the Spearwood dunes is constrained at about 500,000 years by optical luminescence dating (Brooke and others2014). As sea level high stands prior to about 500,000 years were relatively low, it is presumed that older deposits (but younger than the Bassendean dunes) were below the current sea level and subsequently destroyed by Middle Pleis- tocene high stands (Hearty and O’Leary2008).
The Quindalup dunes (McArthur and Bettenay 1974) are the most recent dune system, formed in the last 6,500 years since the Holocene post-glacial sea level high stand (Woods and Searle 1983).
Although at least four phases of Quindalup dune development have been identified in areas of the Swan Coastal Plain (McArthur2004), we grouped the Holocene dunes at Jurien Bay into three age classes based on the degree of soil development and landscape position (Hayes and others2014). Young Quindalup dunes are no more than 100 years old, have been only recently stabilized by vegetation, and exhibit little or no pedogenic development.
Medium-aged Quindalup dunes are approximately 1,000 years old, have continuous vegetation cover, and exhibit weak but recognizable development of an epipedon in the soil profile. Old Quindalup Table 1. The Three Main Phases of Dune Development Along the Jurien Bay Chronosequence, South- western Australia
Dune system
Dune ages
Chronosequence stages
Years before present
Marine isotope stage
Associated geological formation
Nature of soils
Quindalup Holocene 1, 2, 3 <6,500 1 Safety
Bay Sand
Calcareous sand Spearwood Middle
Pleistocene
4, 5 120,000–
500,000
5e to 13 Tamala Limestone
Decalcified sand with residual iron oxides over indurated limestone
Bassendean Early Pleistocene (and possibly Late Pliocene)
6 >2,000,000 – Ascot
Formation
Residual quartz sand;
parent material probably contained less carbonate than Quindalup
or Spearwood B. L. Turner and E. Laliberte´
Author's personal copy
dunes are approximately 6,500 years old and occur inland at the Holocene–Pleistocene transition. The oldest dunes correspond to the final stages of the post-glacial marine transgression (Lewis and others 2013).
Parent Material
The Holocene Quindalup dunes consist primarily of carbonaceous material from the nearshore coastal environment. The continental shelf off the coast of the Swan Coastal Plain is extensive and shallow, which promotes carbonate production and move- ment onshore during marine transgressions (Brooke and others 2014). The Spearwood dunes are thought to have formed from weathering of the underlying Tamala Limestone, a medium-to-coarse grained aeolian calcarenite (calcareous sandstone) composed of sand-sized shell fragments and quartz grains, with minor amounts of feldspars and heavy minerals including ilmenite, garnet, amphibole, and epidote, a similar composition to minerals in the Quindalup dunes (Bastian1996). The feldspars weather rapidly and disappear, as do garnet, amphibole, and epidote, whereas ilmenite weath- ers to leucoxene but does not disappear (Bastian 1996). Eventually, all unstable minerals disappear, leaving almost pure quartz sand. Carbonate con- tent in the Tamala Limestone varies from 30 to 96% (Bastian 1996; Hearty and O’Leary 2008;
Brooke and others 2014).
It has been suggested that Bassendean sands might have originated as calcarenites in the same way as the Spearwood and Quindalup dunes (McArthur and Bettenay1974; Playford and others 1976; Bastian1996). However, it seems more likely that the Bassendean Sand contained a lower car- bonate content initially, based on its association with the underlying Ascot formation (Kendrick and others 1991). This might have been due either to low carbonate production in the coastal environ- ment at the time of deposition, or dilution by sili- ceous sediments from the continental landmass (Kendrick and others 1991). The extremely weathered nature of the Bassendean Sand means that it has been difficult to quantify its origin with certainty, although reference soils from the three dune systems contain similar particle size distribu- tions, suggesting a common aeolian origin (McAr- thur2004). We do not consider the possibility of a lower initial carbonate content in the Bassendean Sand to compromise studies of plant–soil interac- tions along the chronosequence (Laliberte´ and others 2013b; Hayes and others 2014), because carbonate is lost rapidly during the early stages of
pedogenesis in carbonate-rich soils (for example, Salisbury 1925; Burges and Drover 1953; see below) and the younger Spearwood dunes can contain many meters of completely decalcified sand over limestone. We therefore assume that any carbonate initially present in the older Bassendean dunes would have long disappeared from the soil profile to great depth, so that the Bassendean dunes represent the endpoint of an exceptionally strong natural soil nutrient gradient for studies where slight differences in parent material can be neglected (Laliberte´ and others2013b).
There have been persistent claims that the Spearwood sands originate from inland dunes that expanded onto the coastal plain during periods of aridity (that is, the desert extension hypothesis;
Glassford and Killigrew 1976; Hearty and O’Leary 2008). However, this hypothesis has been refuted on the basis of a number of lines of evidence (reviewed in Laliberte´ and others2013b), including the complete absence of ‘desert sand’ in the vast intervening areas between the purported desert source and the Swan Coastal Plain destination (Lowry 1977; Bastian 1996), a clear west-to-east trend of increased weathering of the Spearwood sands (Bastian 1996) that matches a west-to-east increase in the age of the underlying limestone (Price and others2001; Hearty and O’Leary 2008;
Brooke and others2014), and the match in particle size distribution and mineralogy between the Spearwood dune sand and sand embedded in the underlying limestone (Wyrwoll and King 1984;
Tapsell and others 2003). These separate lines of evidence confirm that the Spearwood sand is residual and originates from in situ weathering and decalcification of the Tamala Limestone, with some local remobilization but no long-range transport.
Climate
The climate of the study area is Mediterranean, with hot, dry summers and cool, moist winters.
Mean annual rainfall (measured between 1953 and 2012) is 573 mm, of which about 80% falls be- tween May and September (Australian Bureau of Meteorology, http://www.bom.gov.au/climate/
data/). There is little if any variation in rainfall along the chronosequence, which extends only an approximate 15 km inland from the coastline. The mean annual temperature is 19C and the mean annual maximum temperature is 25C, with Feb- ruary being the warmest month (mean monthly maximum of 31C) and July the coolest (mean monthly maximum of 20C) (data from 1969 to 2013).
Soil Development and Nutrient Availability
Author's personal copy
In the USDA Soil Taxonomy system (Soil Survey Staff1999), the soil-moisture regime at Jurien Bay qualifies as Xeric (that is, the soil is dry for‡45 con- secutive days in summer and moist for at least 45 consecutive days in winter), and the soil-tempera- ture regime qualifies as Thermic (that is, the mean annual soil temperature is 15–22C, and the differ- ence between means of summer and winter tem- peratures at 50 cm below the soil surface is‡6C).
There is evidence that rainfall varied markedly in inland areas of Western Australia during glacial maxima, and included periods of increased aridity (for example, Fujioka and others2009). However, the currently available evidence, although limited, suggests that climate along the coastal margins of southwestern Australia has been well buffered from conditions inland, with relatively little varia- tion from the modern climate over the time span covered by the Jurien Bay dune chronosequence (Wyrwoll and others2014).
Vegetation
Vegetation in the Jurien Bay region is Mediterra- nean low shrubland known as kwongan (Beard 1984; Hopper2014). The chronosequence is in the Southwest Australian Floristic Region (Hopper and Gioia2004), which is listed as a global biodiversity hotspot (Myers and others 2000). Plant communi- ties are dominated by schlerophyllous shrubs and trees with remarkably high species richness and endemism (Lamont and others 1984; Hopper and Gioia 2004). There is a marked increase in plant species diversity with soil age along the chronose- quence (Laliberte´ and others 2013a, 2014). Fami- lies such as Fabaceae and Myrtaceae are common on younger dune systems, while Proteaceae become more common on older dunes (Laliberte´
and others 2012; Hayes and others2014).
In agreement with evidence for a relatively stable climate along the coastal margins of southwestern Australia, there is evidence that shrublands have persisted in the region throughout the Last Glacial Maximum, whereas changes in vegetation and climate were more pronounced in the other regions of Australia that now share a similar Mediterranean climate (Dodson2001; Barrows and Juggins2005).
Some authors have suggested that the relative cli- mate stability in southwestern Australia (at least near the coastline) may explain why this region has retained a hyperdiverse sclerophyll flora (Hopper and Gioia 2004), whereas sclerophyll diversity was greatly reduced in southeastern Australia due to climate fluctuations during the Pleistocene (Sniderman and others 2013).
Dune Morphology
Dune morphology varies along the chronose- quence in terms of dune height and form, reflecting differences in age of the three main dune systems.
The Quindalup dunes occur as marked ridges and crests with short steep slopes. In particular, the oldest Quindalup dunes form a prominent ridge that marks the transition to the much older Spearwood dunes (Laliberte´ and others2012). The Spearwood dunes have clear topographic succes- sion (see above; Bastian 1996), but dune mor- phology becomes subdued with distance inland.
The youngest Spearwood dunes marking the Holocene–Pleistocene transition are the most prominent, with broad flattened but distinct dune ridges further inland. The Bassendean dunes retain some of their dune expression around Perth (Bas- tian 1996), but have generally lost their charac- teristic dune morphology, forming extensive flatter areas between the younger Spearwood dunes and the older laterite gravel slopes (the Peron Slopes) to the east. However, the apparently buffered climatic conditions over the Quaternary (Wyrwoll and others 2014) and the absence of ‘rejuvenated’
profiles in Bassendean sand (see below) suggest that the older dunes have not experienced recent extensive erosion or reworking other than at the local scale.
Disturbance
Southwestern Australia has not been glaciated since the Permian (that is, at least 250 million years ago) (Geological Survey of Western Australia 1990). The Australian continent separated from India in the Cretaceous and from Antarctica in the Eocene, and has been drifting northward ever since (Playford and others 1976). The region is very stable geologically (Wyrwoll and others 2014), although some authors have argued that local tectonism along the coast of southwestern Australia may have influenced dune stratigraphy (Semeniuk and Searle 1986; Playford and others 2013). In general, however, the dunes have remained rela- tively undisturbed in their depositional settings other than local surface reworking. Importantly, they have not been buried by younger sediments and have therefore been exposed to weathering since their deposition.
Fire is the main disturbance to vegetation in the area, with typical fire-return intervals of<30 years (Griffin and Burbidge1990). For example, a study on the Eneabba Sandplain, around 40 km from the Jurien Bay chronosequence, estimated a mean fire- B. L. Turner and E. Laliberte´
Author's personal copy
return interval of 13 years in the last 30 years (Enright and others 2005). In these fire-prone shrublands, seedling recruitment occurs almost exclusively after fire from seeds that are either stored in the canopy (that is, serotiny; Lamont and others 1991) or as a persistent soil seed bank (Bell and others 1993). In addition, many plant species in these shrublands can re-sprout vigorously after a fire (Bell and others 1984).
We do not know of any evidence for a substantial dust imprint on the sequence (Laliberte´ and others 2013b), which is perhaps unsurprising given the prevailing westerly air flow from the Indian Ocean.
We cannot discount greater dust inputs during glacial periods when low sea levels exposed the continental shelf. However, the extremely low total P concentrations on the oldest (Bassendean) soils, including in surface soil layers (see below), suggest the absence of long-term dust inputs. Marine aer- osol inputs are presumably greater at the coast and decrease inland, although this is not reflected in exchangeable sodium concentrations, which are generally very low and are not the greatest in the youngest Quindalup soils closest to the coastline (see below).
M
ETHODSSoil Profile Pits and Plot Selection
Profile pits were excavated in August 2012 at a number of sites along the chronosequence and six of these, most clearly representing the main chrono- sequence stages, are described in detail here (Fig- ure 1B; Table1; see description of chronosequence stages below). Profiles were excavated to at least 1 m deep and up to 2 m deep for older, more developed soils. Pits were located on the shoulders or upper slopes of dunes, except for the Bassendean profile where dune morphology was indistinct. Profiles were described and sampled by genetic horizon.
Profile descriptions and analytical data are presented in full in Supplementary Online Material.
To quantify changes in soil nutrients relevant to potential limitation of biological activity, we also sampled surface soils (0–20 cm depth) from 60 10 m910 m plots across the chronosequence (ten plots per chronosequence stage) that were selected using a random-stratified sampling design (Lali- berte´ and others 2014). Details on plot selection and delineation of the chronosequence stages are provided elsewhere (Laliberte´ and others 2012, 2014; Hayes and others2014) and are summarized here. Aerial photographs, maps (including soil, geology, and topography), and on-ground verifi-
cation (for example, using soil morphological characteristics) were used to define six broad re- gions (chronosequence stages) corresponding to distinct dune systems of increasing age, as indicated by the degree of soil development (McArthur 2004). Stages 1–3 can be easily distinguished from stages 4–6 because the latter occur east of a distinct beach ridge that marks the transition between the Holocene and Pleistocene dunes. In addition, soils of stages 1–3 are still alkaline due to the presence of carbonates, whereas soils from stages 4–6 are decalcified (see below). Within the Holocene dunes (stages 1–3), mobile dunes (stage 1) were easily identified by their recent origin and absence of soil development. Dunes corresponding to stage 2 were located between dunes of stage 1 and 3, but are heavily vegetated, and their soils are much more developed (with an organically enriched A hori- zon) than those of stage 1. Older Holocene dunes (stage 3) were selected on the basis of landscape position (that is, just west of the Holocene–Pleis- tocene transition). Soils from stages 4–5 (Spear- wood dunes) are easily distinguished by their distinct yellow color that is due to the oxidation of iron minerals. Stages 4 and 5 consist of Middle to Late Pleistocene dunes with a calcarenite core (Tamala Limestone); they show calcretes and karst- weathering profiles in the upper parts that are overlain by decalcified sand, the thickness of which depends on soil age and the degree of weathering (Bastian1996). In stage 4, calcrete is found within 1 m of the soil surface, whereas in stage 5, it occurs at a depth of several meters or is absent in some cases (see below). Finally, dunes corresponding to stage 6 (Bassendean dunes) can be distinguished from stages 4–5 by their lack of morphological expression, gray (not yellow) sands, thick (>2 m) bleached eluvial horizons, and the absence of cal- crete.
These six stages were spread over a 675 km2 (that is, approximately 45 km north–south9 15 km east–west) coastal area from south of Jurien Bay to Green Head. The regions were digitized as polygons in a geographic information system (Quantum GIS, http://qgis.org/). All vehicle- accessible roads and tracks from the general area were digitized into the GIS. Randomly positioned points within each of the six distinct dune systems were generated in the GIS, constraining locations between 40 and 200 m from a road or track to facilitate access. Due to the relatively small sizes of vegetation patches within the youngest dune sys- tem (that is, stage 1: young mobile dunes), loca- tions were randomly selected without consideration to road or track proximity. Ten plots Soil Development and Nutrient Availability
Author's personal copy
per dune system were selected for vegetation sur- veys, for a total of 60 plots. Plots were selected only in areas that showed no evidence of recent fires (that is, in the last 5 years). The average closest distance between two neighboring plots was 2.1 km. In each plot, we identified an additional seven randomly located 2 m 92-m subplots. Be- tween June 11 and 16, 2012, seven soil samples (one sample per 2-m92-m subplot) were col- lected in each of the 60 100 m2plots, for a total of 420 samples. Subsampling was done to obtain more accurate estimates of the mean. Samples were ta- ken to 20-cm depth using a 5-cm diameter sand auger, sieved (<2 mm) to remove roots and other large organic debris, and then air dried prior to laboratory analyses (see below).
Soil Analytical Procedures
Samples from soil profile pits were air dried and analyzed for particle size distribution, pH, carbon- ate, organic C, total N, total P, and exchangeable cations. Samples from the 60 10 m910 m plots were analyzed for total C, total N, total P, sequen- tial P fractionation, micronutrients, carbonate, pH, exchangeable phosphate, extractable N, N miner- alization, and exchangeable cations. Soil pH was determined in both deionized water and 10 mM CaCl2 in a 1:2 soil-to-solution ratio using a glass electrode. The concentrations of sand (53lm–
2 mm)-, silt (2lm–53lm)-, and clay (<2lm)- sized particles were determined by the pipette method following pretreatment to remove soluble salts and organic matter (Gee and Or2002). Total C and N were determined by automated combustion and gas chromatography with thermal conductivity detection using a Thermo Flash 1112 analyzer (CE Elantech, Lakewood, New Jersey). Total P was determined by ignition (550C, 1 h) and extraction in 1 M H2SO4 (16 h, 1:50 soil to solution ratio), with phosphate detection by automated neutral- ization and molybdate colorimetry on a Lachat Quikchem 8500 (Hach Ltd, Loveland, CO).
Exchangeable cations were determined by extrac- tion in 0.1 M BaCl2 (2 h, 1:30 soil-to-solution ra- tio), with detection by inductively coupled plasma optical-emission spectrometry (ICP–OES) on an Optima 7300 DV (Perkin-Elmer Ltd, Shelton, Connecticut) (Hendershot and others 2008). Car- bonate content was determined by mass loss after addition of 3 M HCl (Loeppert and Suarez 1996), and organic C was calculated as the difference be- tween total C and carbonate-C. Bulk density was determined by taking three replicate cores of known volume per horizon using a 7.5-cm diam-
eter stainless steel ring and determining the soil mass after drying at 105C.
Readily exchangeable phosphate was determined by extraction with anion-exchange membranes (AEM) (Turner and Romero 2009). Soil (5 g on a dry-weight basis) was shaken for 24 h with 80 ml deionized water and five anion-exchange resin strips (194 cm; manufactured by BDH, Poole, UK, and distributed by VWR International, West Chester, Pennsylvania). The strips were rinsed in deionized water and the phosphate recovered by shaking for 1 h in 50 ml of 0.25 M H2SO4. Phos- phate was determined in the acid solution at 880 nm following online neutralization with NaOH by automated molybdate colorimetry using a La- chat Quikchem 8500. Nitrogen was extracted from fresh samples within 8 h of collection. Soil was shaken in 1 M KCl and the solution was filtered through a Whatman No. 42 filter paper. A simple measure of N mineralization was determined by incubation of field-moist soils for 7 days at ambient laboratory temperature and extraction in 1 M KCl, with changes in ammonium and nitrate deter- mined by difference from the corresponding con- centrations in fresh soils extracted on the day of collection. Ammonium was determined by auto- mated colorimetry at 660 nm following reaction with phenolate, while nitrate was determined at 520 nm following cadmium-catalyzed reduction to nitrite and reaction with sulfanilamide at pH 8.5.
Both ammonium and nitrate were determined using a Lachat Quikchem 8500 flow injection analyzer. Total dissolved N was determined by combustion and gas chromatography on a Shima- dzu TOC-TN analyzer, and dissolved organic N was calculated as the difference between the total dis- solved N and the sum of ammonium and nitrate.
Total exchangeable bases (TEB) was calculated as the sum of Ca, K, Mg, and Na; effective cation- exchange capacity (ECEC) was calculated as the sum of Al, Ca, Fe, K, Mg, Mn, and Na; base satu- ration was calculated by (TEBECEC)9100.
Micronutrients (Cu, Fe, Mn, and Zn) were ex- tracted in Mehlich-III solution (Mehlich1984) with detection by ICP–OES.
Soil P was fractionated in samples from the 60 10 m910 m plots using a modified sequential extraction procedure (Hedley and others 1982).
Soils were extracted sequentially with AEM, 0.5 M NaHCO3, 0.1 M NaOH, and 1 M HCl. Residual P was determined on the soil after the four extrac- tions using the ignition and acid-extraction proce- dure described above. In all cases, extracts were centrifuged (8,0009g, 15 min) and decanted for analysis. Each aliquot was neutralized using phe- B. L. Turner and E. Laliberte´
Author's personal copy
nolphthalein indicator and dilute NaOH or H2SO4
(as appropriate) and analyzed for inorganic phos- phate, and total P. Phosphate was determined by molybdate colorimetry at 880 nm with a 1-cm path length. Total P was determined by the same pro- cedure following acid-persulfate digestion at 80C overnight in sealed glass tubes. In both cases, standards were prepared in the extract solution following identical neutralization and dilution steps. The detection limit for both procedures was approximately 0.6 mg P kg-1 except for resin P (<0.1 mg P kg-1). Organic P was calculated as the difference between total P and inorganic phos- phate. Fractions were grouped into four pools: or- ganic P (organic P extracted in NaHCO3 and
NaOH), primary mineral P (inorganic P extracted in HCl), non-occluded P (inorganic P extracted in NaHCO3 and NaOH), and occluded P (that is, residual P).
R
ESULTSSoil Development Along the Jurien Bay Chronosequence
Examples of soil profiles corresponding to the six stages of the Jurien Bay chronosequence are shown in Figure2, with key diagnostic features and pro- file-weighted soil properties reported in Table2.
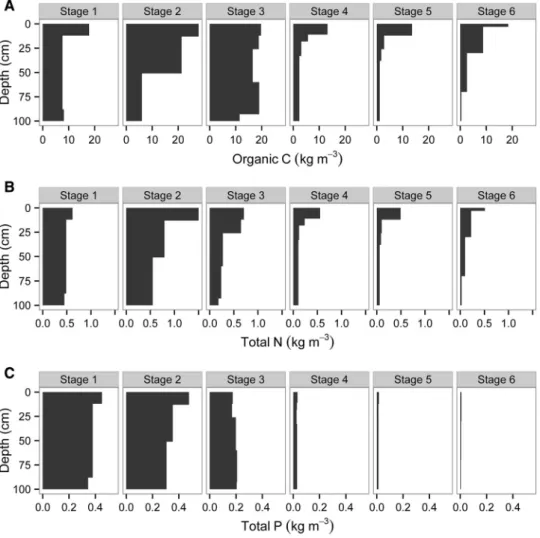
Detailed profile descriptions and full chemical and Figure 2. Soil development along the Jurien Bay chronosequence. Profiles represent the six main chronosequence stages studied: A young Quindalup (<100 years old), B medium-aged Quindalup (1,000 years old), C old Quindalup (6,500 years old);Dyoung Spearwood (120,000 years old),Eold Spearwood (500,000 years old), andFBassendean (>2,000,000 years old). Note the absence of horizon development in the youngest Quindalup profile (A), the marked color change in the old Quindalup profile (C) as carbonates are removed, the yellow colors indicating residual iron oxides over shallow limestone in the young Spearwood profile (D), the incipient eluvial horizon in the old Spearwood profile (E), and the complete removal of iron oxides in the Bassendean profile (F).
Soil Development and Nutrient Availability
Author's personal copy
physical analyses by genetic horizon are provided in the Online Supplementary Material.
Soils developed on Quindalup dunes (stages 1–3;
Figure 2A–C) are light gray-to-grayish brown and exhibit weakly developed surface horizons en- riched with organic matter overlying several meters of unweathered calcareous sand. The Quindalup dunes lack diagnostic horizons and are classified as Typic Xeropsamments, reflecting the Xeric mois- ture regime and sand texture. In the Australian Soil Classification System (Isbell 2002), these soils are Shelly Rudusols. They consist of calcarenites (that is, sand-sized carbonate grains), with up to 82%
carbonate in the youngest profile (Table2). The two youngest dunes qualify as carbonatic (>40%
carbonate), but the old Quindalup dunes show evidence of decalcification, with about 25% car- bonate throughout the profile. Although much more developed than the younger profiles, the old Quindalup dune does not qualify as an Inceptisol, because the B horizons does not meet all criteria for a cambic horizon. Specifically, although there is evidence of decalcification and a higher color value than underlying horizons, the texture was slightly coarser than very fine sand. All the Quindalup profiles were strongly or very strongly alkaline throughout.
Carbonate in the young Quindalup dunes weathers rapidly and leaches from the profile.
Thus, the youngest Spearwood profile (stage 4;
Figure 2D) exhibited complete decalcification in the upper horizons, leaving brownish yellow sub- soil consisting of greater than 95% residual quartz sand and iron oxide coatings. The yellow color derives from the presence of goethite and weath- ering of heavy minerals such as ilmenite, garnet, and amphibole (Bastian 1996). The young Spear- wood profile (stage 4) contained an undulating indurated petrocalcic horizon (that is, a calcrete cap over the underlying Tamala Limestone), reaching between 40 and 100 cm below the soil surface. The presence of the petrocalcic horizon qualifies the profile as an Inceptisol (Calcic Haploxerepts), con- sistent with the much older and pedogenically developed nature of the profile. The soil is very friable and has very weak blocky structure.
The depth of sand and depth to limestone in Spearwood dunes increases from west to east, consistent with an increasing degree of weathering and leaching of carbonate. However, we did not encounter limestone in the older Spearwood profile (stage 5; Figure 2E). As a result, the older Spear- wood profile classifies as an Entisol (Xeric Quart- zipsamment). In the Australian Soil Classification system, the Spearwood profiles are Yellow-Orthic
Tenosols, with the younger profile qualifying as a Petrocalcic Great Group. The greater age of the older Spearwood profile was indicated by an incipient eluvial horizon, which becomes much more pronounced in Spearwood profiles further inland (and therefore, presumably older) and at wetter sites further south (Turner and Laliberte´, unpublished data). This bleached horizon indicates the early stages of iron oxide removal from the profile as iron–humus complexes and demonstrates that these older Spearwood soils are transitioning toward the final stage of soil development along the chronosequence (stage 6; Figure2F). Soil pH in water in the Spearwood profiles was neutral and ECEC was less than 2 cmolc kg-1. The young and old Spearwood soils along the Jurien Bay chrono- sequence are broadly equivalent to the yellow and gray phases, respectively, of the Karrakatta sands (McArthur and Bettenay1974).
The final and oldest stage of the chronosequence (stage 6) is represented by soils developed on the Bassendean dunes (Figure2). The Bassendean profile is at least 2 million years old (that is, Early Pleistocene) and represents the ultimate end point of pedogenesis along the chronosequence. A thin organic horizon occurs at the surface, consisting of partly decomposed litter and cluster roots from the common nearby trees in the Proteaceae (for example, Banksia attenuata, Banksia menziesii). The mineral soil is composed entirely of white-to-light gray single grain quartz sand. The sand is com- pletely free of iron oxides, which have been lea- ched from the soil as iron–organic matter complexes. These complexes are often deposited as a spodic horizon (that is, a subsurface accumulation of humus–metal complexes and metal oxides) in the deep subsoil (McArthur 2004), forming a brown iron–humus material known locally as
‘coffee rock.’ Such soils qualify as Giant Humus Podzols in the Australian Soil Classification (Thompson1992), but in many cases (for example, Prakongkep and others2012), they do not qualify as Spodosols in Soil Taxonomy because the spodic horizon is more than 200 cm below the soil surface.
At Jurien Bay, a transition to very pale brown sand, but not a spodic horizon, was encountered at more than 300 cm (further augering was prevented by the water table), although on well-drained areas elsewhere we have encountered spodic materials at several meters depth on Bassendean sands. The nature of the spodic horizon varies markedly depending on proximity to the water table (McArthur and Russell1978). Despite its great age, the absence of diagnostic features means that the Bassendean profile classifies as an Entisol (Xeric B. L. Turner and E. Laliberte´
Author's personal copy
Table2.SoilProfiles,ApproximateAges,TaxonomicClasses,andProfile-weightedSoilPhysicalandChemicalPropertiesforSixKeyStagesAlong theJurienBayChronosequence,SouthwesternAustralia Chronosequence stageApproximate ageSoiltaxonomyPedomorphic featuresCarbonate (%)Sand (%)Silt (%)Clay (%)pH (H2O)pH (CaCl2)ECEC (cmolckg-1 ) 1Quindalupyoung100Carbonatic,thermic, TypicXeropsammentsIncipientAhorizon8298.21.10.79.18.212.93 2Quindalupmedium1000Carbonatic,thermic, TypicXeropsammentsDevelopmentofAhorizon6695.92.12.09.28.15.52 3Quindalupold6500Siliceous,thermic, TypicXeropsammentsModeratedecalcification, developmentofweak structure
2596.91.41.68.98.05.01 4Spearwoodyoung120,000 (MIS5e)Sandy,siliceous,thermic, CalcicHaploxereptsDecalcificationanddeposition asaninduratedpetrocalcic horizon;residualironoxi- desthroughouttheprofile
094.02.93.16.96.11.94 5Spearwoodold480,000 (MIS13?)Thermic,Xeric QuartzipsammentsDecalcification;residualiron oxides;incipienteluvial horizon;petrocalcichorizon atconsiderabledepth(if presentatall) 096.71.32.06.85.70.96 6Bassendean>2,000,000Thermic,Xeric QuartzipsammentsCompleteremovalofiron oxides,leavingresidual quartzsand
097.32.30.35.64.40.98 MIS=marineisotopestage;ECEC=effectivecationexchangecapacity.
Soil Development and Nutrient Availability
Author's personal copy
Quartzipsamments) in Soil Taxonomy. In the Australian Soil Classification system, the Bassen- dean profile studied here is a Grey-Orthic Tenosol.
The Bassendean soils are equivalent to the Janda- kot sands (McArthur and Bettenay1974), although they appear to lack the spodic horizon around Ju- rien Bay. Soil pH in water was moderately acid, and ECEC was less than 1 cmolckg-1.
Profile-Weighted Organic Carbon, Total Nitrogen, and Total Phosphorus
Organic C in the upper meter of soil increased throughout the Holocene dune sequence (stages 1–3), reaching a maximum of 17.7 kg C m-2in the oldest Quindalup profile (stage 3) (Table3;
Figure3A). Organic C stocks then declined in Table 3. Profile-Weighted Nutrient Concentrations for the Upper Meter of Soil in Profile Pits of the Six Main Stages Along the Jurien Bay Chronosequence, Southwestern Australia
Chronosequence stage Organic C (g m-2)
Total N (g m-2)
Total P (g m-2)
C:N C:P N:P
1 Quindalup young 8,900 495.5 384.3 18.0 23.2 1.3
2 Quindalup medium 14,678 763.3 346.4 19.2 42.4 2.2
3 Quindalup old 17,720 362.2 194.8 48.9 90.9 1.9
4 Spearwood young 3,864 166.5 28.8 23.2 134.4 5.8
5 Spearwood old 2,917 119.2 12.7 24.5 228.9 9.4
6 Bassendean 4,063 117.8 6.4 34.5 639.2 18.5
Figure 3. Profile- weighted contents of organic carbon (A), total nitrogen (B), and total phosphorus (C) to one- meter depth along the Jurien Bay
chronosequence, southwestern Australia.
B. L. Turner and E. Laliberte´
Author's personal copy
the Spearwood profiles (2.9–3.9 kg C m-2), but increased again to 4.1 kg C m-2 in the oldest pro- file (stage 6). Total N (approximating total organic N) followed a slightly different pattern, peaking at 763 g N m-2in the medium-aged Quindalup dune (stage 2), before declining to less than 120 g N m-2 in the oldest dunes (Table 3; Figure3B).
Total P declined continuously along the chron- osequence. In the Holocene dunes, total P declined by 50% in about 6500 years, from a maximum of 384 g P m-2 in the youngest Quindalup profile (stage 1) to 195 g P m-2 in the oldest Quindalup profile (stage 3) (Table3; Figure3C). Total P then declined markedly to 28.8 g P m-2in the youngest Spearwood profile and eventually to only 6.4 g P m-2 after 2 million years of pedogenesis (stage 6).
Profile-weighted element ratios showed clear patterns expected during long-term pedogenesis (Table 3). The organic C to total N ratio increased in Holocene dunes to a maximum of 48.9 in the old Quindalup profile (stage 3), and then declined in Spearwood dunes, although the ratio increased to 34.5 in the oldest profile (stage 6). The organic C to total P ratio increased continuously throughout the sequence, from a low of 23.2 in the youngest Holocene dune (stage 1) to a maximum of 639 in the oldest profile on Bassendean Sand (stage 6).
Similarly, the profile-weighted N:P increased from 2.2 or less in the Holocene dunes to 18.5 in the oldest profile (stage 6).
Changes in pH and Carbonate in Surface Soils
Soil pH in water declined from very strongly alkaline (pH 9.2) in the youngest dunes to strongly alkaline (pH 8.6) in older Quindalup dunes, and then to moderately acid (pH 5.9) in the Bassendean soil (Figure4A). Soil pH in 10 mM CaCl2 followed a similar pattern but approximately one pH unit low- er, with values decreasing from 8.2 in the youngest dunes to 4.8 in the oldest dunes. Carbonate in sur- face soils was 76–78% in the youngest two dunes, declining to 43% in the older Quindalup dunes, al- though values for old dunes varied markedly among replicate plots (Figure4B). No carbonate was de- tected in Spearwood or Bassendean dunes.
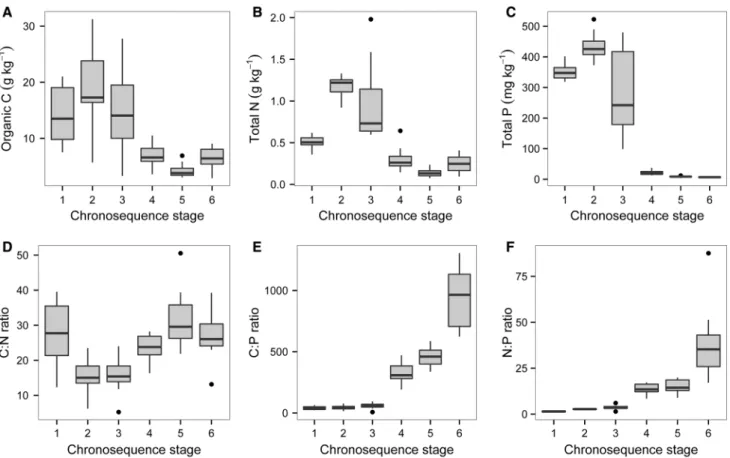
Changes in Carbon, Nitrogen, and Phosphorus in Surface Soils
Organic C concentrations in surface soils increased initially to a maximum of 18.8 g C kg-1 in the medium-aged Quindalup dunes (stage 2) and then declined to less than 7 g C kg-1on Spearwood and Bassendean dunes (stages 4–6; Figure5A). Total N followed a similar pattern, increasing to 1.17 g N kg-1 in the medium-aged Quindalup dunes and declining to 0.30 g N kg-1or less in the older stages (Figure5B). Total P increased initially from 350 mg P kg-1on the youngest dunes (stage 1) to 433 mg P kg-1 on the medium-aged Quindalup Figure 4. Changes in soil pH measured in deionized water (A) and carbonate (as CaCO3equivalent) (B) in surface soils along the Jurien Bay chronosequence, southwestern Australia. Values are from ten replicate plots per chronosequence stage. Thecentral vertical bar in each boxshows the median, theboxrepresents the interquartile range, thewhiskersshow the location of the most extreme data points that are still within a factor of 1.5 of the upper or lower quartiles, and theblack pointsare values that fall outside the whiskers.
Soil Development and Nutrient Availability
Author's personal copy
dunes (stage 2; Figure 5C), reflecting redistribution of P in surface horizons by plants (Figure 3). It then declined to 21.5 mg P kg-1 on the Spearwood dunes and then to 6.7 mg P kg-1 on the Bassen- dean dunes (stage 6; Figure5C).
The organic C to total N ratio in surface soil de- clined initially from 27.0 in the youngest soils to about 15.5 in older Quindalup soils, and then in- creased to a maximum of 31.6 in old Spearwood soils (Figure5D). Organic C to total P ratios in- creased markedly from very low values in Quindalup soils ( £51 on stages 1–3) to around 1,000 in the oldest dunes (Figure5E). The total N:P ratio followed a similar pattern to the organic C:P ratio, increasing consistently from very low values on young soils (<4 on young Quindalup dunes) to maximum values (41.6) on the oldest soils (Bas- sendean dunes; stage 6) (Figure 5F).
Phosphorus Fractionation in Surface Mineral Soils
Phosphorus fractions determined by sequential extraction closely followed the classic Walker and
Syers (1976) model of P transformations during pedogenesis (Figure6). The youngest soils (stages 1–3) were dominated by HCl-extractable phosphate, which occurred at up to 355 mg P kg-1(Figure6A) and accounted for up to 90% of the total P (Fig- ure6B). The HCl-extractable phosphate pool de- clined to low concentrations (<1 mg P kg-1) in Spearwood and Bassendean soils (stages 4–6). The majority of the remainder of the total P in the Quindalup dunes was present as non-occluded inorganic phosphate, which occurred at up to 35.7 mg P kg-1and accounted for 4–8% of the total P. Non-occluded inorganic phosphate (that is, bicarbonate plus NaOH-extractable inorganic phosphate) declined to low concentrations (<1 mg P kg-1) in older soils, but still represented 11–23% of the total P. Occluded P (that is, residual P) occurred at relatively minor concentrations throughout the sequence (up to 29.2 mg P kg-1in the oldest Quindalup dunes; stage 3), but accounted for a much greater proportion of the total P in older soils (29–50%) than on younger soils (2–17%). The decline in the proportion of occluded P in the oldest soils appears to be related to the increasing relative Figure 5. Concentrations of organic carbon (A), total nitrogen (B), total phosphorus (C), and their ratios (D–F) in surface soils along the Jurien Bay chronosequence, southwestern Australia.Valuesare from ten replicate plots per chronosequence stage. See legend to Figure4for an explanation of the box plots.
B. L. Turner and E. Laliberte´
Author's personal copy
importance of organic P under conditions of ex- tremely low soil P. Organic P was only 2 mg P kg-1 in the youngest soil, increased to the maximum concentration in the oldest Quindalup soil (18.2 mg P kg-1; stage 3), and then declined to low concentrations in Spearwood and Bassendean soils (<3 mg P kg-1; stages 4–6). However, organic P increased continuously as a proportion of the total P throughout the sequence, reaching 40% in the Bassendean soil (stage 6). Total P calculated from the sum of sequential fractions corresponded closely with total P values determined independently by ignition and acid extraction (Figure5C). The rela- tionship when forced through the origin was de- scribed by the equation Y= 1.03x (R2= 0.98, P <0.0001), where Y= total P determined by ignition andx= total P by sequential fractionation.
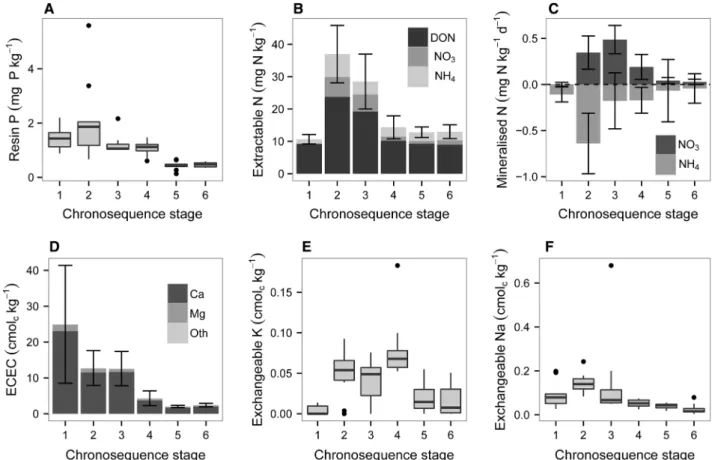
Extractable Phosphorus and Nitrogen in Surface Mineral Soils
Phosphate extracted by AEM was greatest in the medium-aged Quindalup dunes (2.1 mg P kg-1; stage 2) and then declined to very low values on the two oldest stages (£ 0.5 mg P kg-1) (Fig- ure 7A). Extractable N followed a similar pattern (Figure7B). Total dissolved N increased to maxi- mum values on the medium-aged Quindalup dunes (stage 2) and then declined to lower values on older soils. Dissolved organic N accounted for the majority of the total dissolved N, being approximately 20 mg N kg-1in medium and older Quindalup dunes and no more than 10 mg N kg-1 elsewhere. Both extractable ammonium and ni- trate increased from the lowest values in the young
Quindalup dunes (stage 1) to maximum values in the medium-aged Quindalup dunes (stage 2), and then declined to moderate values on older soils (Figure7B). Ammonium concentrations declined following soil incubation, with losses mirroring concentrations of extractable ammonium (that is, greatest in the medium-aged Quindalup dunes).
Nitrate mineralization was greatest in medium and old Quindalup dunes (0.3–0.5 mg N kg-1day-1), with negligible mineralization on the youngest and oldest dunes (Figure7C).
Exchangeable Cations in Surface Soils
Extractable Al concentrations were no more than 0.01 cmolckg-1 along the entire sequence, so ECEC was dominated throughout by base cations (Figure7D), with base saturation around 100%.
Effective cation exchange capacity was the greatest in the youngest Quindalup soils (24.9 cmolc kg-1; stage 1), declining by about 50% in older Quindalup dunes (stages 2–3) and then further to very low values in the older soils (a minimum va- lue of 2.0 cmolckg-1in old Spearwood soils; stage 5) (Figure7D).
The exchange capacity was dominated by cal- cium throughout the sequence, with maximum values on the youngest Quindalup dunes (23.0 cmolckg-1) and minimum values on the oldest two stages (<2.0 cmolckg-1; stages 5–6).
Exchangeable magnesium declined from 1.81 cmolckg-1in the youngest soil to 0.33 cmolckg-1 in old Spearwood soils (Figure7D). Exchangeable potassium concentrations were much lower, with very low values (0.01 cmolckg-1) on the Figure 6. Phosphorus fractionation by sequential extraction in surface soils along the Jurien Bay chronosequence, southwestern Australia, including concentrations (A) and proportions of the total phosphorus (B). Phosphorus is grouped into primary mineral phosphate (extracted in HCl), organic phosphorus (organic phosphorus extracted in NaHCO3and NaOH), non-occluded phosphorus (inorganic phosphate extracted in NaHCO3and NaOH), and occluded phosphorus (that is, residual phosphorus not extracted in any step).Valuesare the means of ten replicate plots per chronosequence stage.
Soil Development and Nutrient Availability
Author's personal copy
youngest soils, increasing to about 0.05 cmolckg-1 on older Quindalup and young Spearwood soils (stages 3–4), and then declining to low values (0.02 cmolckg-1) in the two oldest soils (stages 5–6;
Figure 7E). Exchangeable sodium followed a simi- lar pattern, with maximum values in the medium- aged Quindalup dunes (0.15 cmolckg-1) and declining to low values (0.03 cmolckg-1) on Bas- sendean dunes (Figure7F).
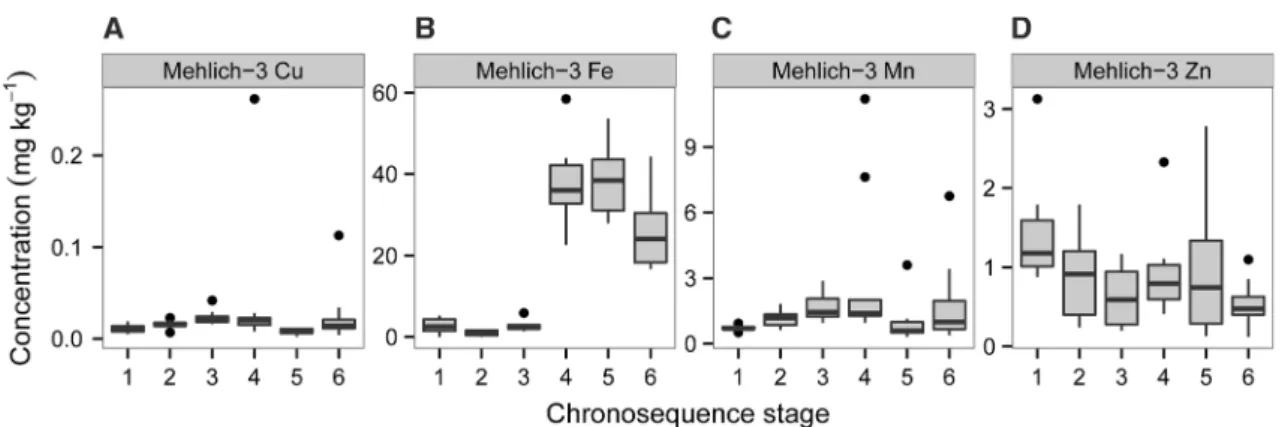
Micronutrient Concentrations in Surface Mineral Soils
Of the four micronutrients measured, copper con- centrations were extremely low throughout the sequence relative to the amounts considered ade- quate for crops, while manganese and zinc were moderately low, and iron moderate to adequate (for example, Lindsay and Norvell 1978; Adriano 1986) (Figure 8). Mehlich-III extractable copper
concentrations were the lowest in the youngest Quindalup dunes (stage 1; 0.011 mg Cu kg-1) and greatest in the youngest Spearwood dunes (stage 4;
0.043 mg Cu kg-1). Copper concentrations were lowest, however, on the old Spearwood dunes (stage 5; 0.008 mg Cu kg-1). Mehlich-III extract- able iron concentrations were low in the Holocene dunes (stages 1–3; <3 mg Fe kg-1) but much greater in the older dunes (25–39 mg Fe kg-1).
Mehlich-III extractable manganese concentrations followed a similar pattern to copper, increasing from the lowest values on the youngest Quindalup dunes (mean 0.71 mg Mn kg-1) to the greatest concentrations on young Spearwood dunes (stage 4; 3.01 mg Mn kg-1). Mehlich-III extractable zinc concentrations were greatest in the youngest Quindalup dunes (stage 1; 1.43 mg Zn kg-1) but changed little along the sequence. The lowest zinc concentrations were detected in the Bassendean dunes (stage 6; 0.54 mg Zn kg-1).
Figure 7. Extractable (readily bioavailable) nutrient concentrations in surface soils along the Jurien Bay chronosequence, southwestern Australia, showing anion-exchange membrane extractable phosphate (A), KCl-extractable nitrogen (B), mineralized nitrogen (C), effective cation-exchange capacity (ECEC) and the contribution of calcium, magnesium, and other cations (D), exchangeable potassium (E), and exchangeable sodium (F).Valuesare the mean (±1 standard devia- tion) of ten replicate plots per chronosequence stage. See legend to Figure4for an explanation of the box plots.
B. L. Turner and E. Laliberte´
Author's personal copy
D
ISCUSSIONPedogenesis Along the Jurien Bay Chronosequence
Soil development along the Jurien Bay chronose- quence is consistent with previous detailed studies in the Perth region that have shown a clear west- to-east increase in weathering and soil develop- ment (Bastian 1996; McArthur 2004). Soils with ages between the oldest Quindalup and youngest Spearwood dunes, a span of many thousands of years, are not found along the sequence because they have been buried by younger Holocene sedi- ments or submerged beneath present sea level (Brooke and others 2014). However, the Quinda- lup and Spearwood successions, coupled with the oldest Bassendean soil, are sufficient to reconstruct the transition from calcareous sands to siliceous quartz sands over 2 million years of pedogenesis.
Young soils are strongly alkaline, but undergo relatively rapid acidification and leaching of car- bonate. The carbonate precipitates at depth to form a calcrete cap overlying the Tamala Limestone, leaving an overlying layer of residual quartz sand.
With further pedogenesis, the calcite is progres- sively leached away and residual iron oxides are leached from the profile, leaving bleached quartz grains. Depending on landscape position, the iron oxides can form a spodic horizon consisting of iron–
humus complexes that may be many meters below the soil surface. Although the leaching of iron oxides is not pronounced along the Jurien Bay chronosequence, an incipient eluvial horizon was evident in profile pits on the most easterly Spear- wood dunes, and we have studied eluvial horizons up to 2-m deep in old Spearwood dunes under greater rainfall further south.
Patterns of Soil Nutrients Along the Chronosequence
Despite the modest rainfall under a Mediterra- nean climate at Jurien Bay, changes in C, N, and P along the chronosequence were remarkably consistent with expectations of the Walker and Syers (1976) model of nutrient transformations during pedogenesis. Profile weights of organic C and N increased rapidly in the early stages of pedogenesis and then declined. In contrast, total P declined continuously throughout the chrono- sequence, reaching extremely low levels on the oldest dunes. Indeed, total P concentrations in Bassendean soils are among the lowest reported globally. In parallel, profile-weighted C:P and N:P ratios increased continuously along the sequence, reinforcing the expectation of strengthening P limitation in old soils (see below) (Laliberte´ and others 2012; Hayes and others2014). Changes in soil P chemistry determined by sequential frac- tionation were also in accordance with the Walker and Syers (1976) model, with a marked decline in primary mineral P during the early stages of pedogenesis and increasing importance of organic and occluded P in old soils. The exception was the decline in the proportion of occluded P in the oldest soils, which appears to be due to the increasing importance of organic P in those soils. This pattern of P transformations during pedogenesis has been observed consis- tently in chronosequences around the world un- der a variety of climates and in soils developed on markedly different parent materials (Walker and Syers 1976; Crews and others 1995; Peltzer and others 2010; Selmants and Hart2010; Turner and others 2012; Izquierdo and others 2013).
Figure 8. Concentrations of extractable micronutrients in surface soils along the Jurien Bay chronosequence, south- western Australia, including copper (A), iron (B), manganese (C), and zinc (D).Valuesare from ten replicate plots per chronosequence stage. See legend to Figure4for an explanation of the box plots.
Soil Development and Nutrient Availability
Author's personal copy
To assess changes in soil fertility along the se- quence over a much broader area than possible through soil profile pits, we determined concen- trations of total and available nutrients in 100 m2 plots distributed along the six key chronosequence stages. These samples further supported expecta- tions of changes in nutrient availability and limi- tation along the chronosequence (Laliberte´ and others2012; Hayes and others2014). For example, measures of N availability increased initially and then declined, as did some cations (that is, potas- sium and sodium) and micronutrients, whereas extractable P, exchangeable calcium and magne- sium, and extractable zinc declined continuously along the sequence. The latter is somewhat sur- prising given evidence for zinc limitation on the youngest soils (Laliberte´ and others2012), includ- ing the high resorption efficiency for zinc in leaves of native plants (Hayes and others 2014). This result suggests that high pH, rather than low zinc concentrations, is the cause of apparent zinc limi- tation due to the slow diffusion of zinc in calcare- ous soils (Melton and others1973).
Copper deficiency is widespread on strongly weathered soils of Western Australia, including on acid and calcareous sands (Holloway and others 2008), and the extremely low copper concentra- tions throughout the Jurien Bay chronosequence are reflected in foliar copper concentrations far below those considered adequate for crop growth (Hayes and others 2014). Copper availability therefore represents a potentially important micronutrient constraint to plant performance throughout the Jurien Bay chronosequence, al- though we did not observe strong responses to micronutrients on most soils in a previous phy- tometer experiment (Laliberte´ and others2012), or high copper resorption in the leaves of native plants (Hayes and others 2014). However, the limited resorption might be explained by the fact that plants with low foliar copper concentrations tend to show low copper resorption efficiency from leaves, because a greater proportion of the copper is firmly bound in structural constituents such as cell walls (White 2012).
Comparison with Other Long-Term Chronosequences
The Jurien Bay chronosequence differs from previously studied long-term chronosequences in a number of important ways, including its carbonate parent material, Mediterranean climate, and spe- cies-rich shrubland vegetation. In terms of climate, there are only two long-term chronosequences
under dry climates with which to compare the Jurien Bay chronosequence. In the Northern Ari- zona Volcanic Field, a 3 million-year chronose- quence on basalt under 340-mm annual rainfall and 11C mean annual temperature, total P in surface soil declined by 60% during the lifetime of the sequence (Selmants and Hart 2010). Primary mineral P in surface soils declined by 75%, but was still abundant (35% of the total P) in the oldest soils. However, non-occluded P declined to low concentrations and organic P increased continu- ously throughout the sequence, although it only accounted for 8% of the total P on the oldest soils.
In contrast, primary mineral P in apatite declined almost completely after ca 100,000 years of pedo- genesis after a 3 million-year chronosequence of alluvial terraces supporting Californian grassland under 300 mm annual rainfall and 16C mean annual temperature (Baisden and others2002). We interpret the differences in the depletion of primary mineral P between these two western USA se- quences, despite similar rainfall, as an indication of the importance of parent material in determining long-term rates of P transformations, although this does not account for possible differences in paleo- climate. Although total P and other P forms were not reported for the San Joaquin terrace sequence, it appears to most closely resemble rates of P depletion along the Jurien Bay chronosequence, where primary mineral phosphate was completely leached from the soil within 120,000 years. How- ever, all three of these relatively dry chronose- quences appear to conform to the Walker and Syers (1976) model of P transformations during pedo- genesis, although the rates of P transformations are considerably slower than under more humid cli- mates.
The Jurien Bay chronosequence is comparable in some ways to the long-term coastal dune chrono- sequence at Cooloola in eastern Australia (Thompson 1981; Walker and others 1981). Al- though the dates of dune formation at Cooloola are poorly constrained, the chronosequence spans approximately 700,000 years of pedogenesis, and it seems likely that at least some of the dune systems correspond in age to those at Jurien Bay. For example, thermal luminescence dating gives an age of 120,000 years for dune stage 5 at Cooloola (Te- jan-Kella and others1990). The Cooloola sequence differs from Jurien Bay because it is in a humid subtropical climate (1,500 mm of rainfall per year, mostly falling in the summer) and the parent material contains little carbonate (Thompson 1981). As a consequence, initial total soil P con- centrations are much lower at Cooloola than at B. L. Turner and E. Laliberte´
Author's personal copy
Jurien Bay: young vegetated dunes at Cooloola contain less than 30 g P m-2(Thompson1981; B.L.
Turner, unpublished data), equivalent to the Jurien Bay chronosequence after 120,000 years of pedo- genesis (Table3). However, despite the absence of carbonate, soil development at Cooloola is quali- tatively similar to that at Jurien Bay, with leaching of iron oxide coatings on quartz grains leaving bleached quartz profiles at least 2 m deep after approximately 200,000 years of pedogenesis.
Eventually, after 400,000 years, the spodic horizon occurs up to 20 m below the soil surface above a profile of clean quartz sand (Thompson 1981, 1992), forming Giant Humus Podzols. This process therefore occurs more rapidly than at Jurien Bay, which is consistent with the greater productivity (with tall eucalypt forest) and rainfall falling in the warmest part of the year at Cooloola.
Most coastal dune chronosequences involve the development of podzols, in which P depletion oc- curs in parallel with the leaching of iron and alu- minum from the upper part of the soil profile.
Stevens and Walker (1970) and Jenny (1941) summarized a series of early studies of sand dune chronosequences from Sweden, England, and else- where. These and more recent studies of young coastal dune sequences provide support for the importance of rainfall in terms of podzol develop- ment and P depletion (Syers and others 1970;
Lichter1998; Tackett and Craft2010). This is dem- onstrated clearly by comparison of the Jurien Bay chronosequence with Holocene coastal dune sys- tems under a perhumid climate along the west coast of the South Island of New Zealand (Wells and Goff 2007). These sequences began to form approxi- mately 6500 years before present and therefore span the same time period as the Quindalup dune system at Jurien Bay. However, dune formation on the west coast of New Zealand is triggered by earthquakes along the Alpine Fault, which causes landslides and sediment transport to the ocean and subsequent dune formation. A well-studied exam- ple occurs under temperate rainforest at Haast (Turner and others 2012). Although total P in young dunes at Haast is similar to young dunes at Jurien Bay (300–400 mg P kg-1), rainfall is much higher at Haast (3,500 mm year-1), so the rate of P depletion is correspondingly greater. Comparing concentrations in the upper mineral soil, total P increased initially at Jurien Bay (through concen- tration of P in topsoil by plants) and then declined to around 200 mg P kg-1 after 6500 years. At Haast, total P declined rapidly from about 320 mg P kg-1 initially to about 200 mg P kg-1in just a few hun- dred years, and then to about 100 mg P kg-1 after
about 4000 years. At that point, the majority of the total soil P at Haast is in organic forms (>80%) compared to about 10% at Jurien Bay, in agreement with expectations for the influence of rainfall on soil P composition (Walker and Syers 1976; Vitousek 2004). However, differences in vegetation are also likely to be important, because the conifers that are abundant in the early stages of the Haast chrono- sequence