1!"11 #1$
%&'()*
+ ,"- , .!ÿ ,/ÿ
0 1
2 ÿ3" 3 3ÿ 4
2 ÿ3" 3 3ÿ
2 ÿ3" 3 3ÿ 2 ÿ3"
33ÿ
2 ÿ3"33
2 ÿ3" 3 3ÿ
2 ÿ3" 3
3 4
2 ÿ3"
3 3
2 ÿ3" 3 2 ÿ3" 3 3ÿ
2 ÿ3" 3
1!"11 21#
$%&'()*+$'%
,ÿÿ./ÿÿÿ ,ÿ0ÿÿ1ÿÿÿ ,ÿ"ÿ1ÿÿÿ ,ÿ2"ÿ3ÿÿÿ ,ÿ2"ÿ0ÿÿÿ
,ÿ9ÿ456ÿ9ÿÿÿ ,ÿ7ÿ2ÿ9/ÿÿÿ ,ÿ8/ "ÿ9ÿÿÿ
,ÿ9 ÿÿ4ÿÿÿ
1!"11 31#
$ÿ&'ÿÿÿ
$ÿÿÿÿÿ
$ÿ()*ÿÿÿ
$ÿ+ÿÿÿ
$ÿ,ÿÿÿ
$ÿÿÿÿ
1!"11 01#
1!"11 #1#
$ÿ%
$ÿ&"
$ÿ'(
7 ÿ ÿ ÿ ÿ ÿ ÿ ÿ ÿ ÿ ) *ÿ )
& ( + ,) ÿ 0 8ÿ - ÿ ' ÿ 9( "ÿ (.7
'999/ÿ+ÿ0"ÿ ÿ ÿ"."ÿ)
& ÿ0ÿÿ,2#ÿ% .ÿ1ÿ) ÿ2 4ÿ- 9ÿÿ7ÿ346284ÿ9"ÿ7ÿ58236ÿ6207##82
+7ÿ8 ÿ
!"#"$1$%&1!11'(13 16
)*+,-.
/ 0"&' 0"! 1$%$ÿ 02 ÿ
5! 0"&'
& 711$#1363631!'0
78+9:;<;ÿ>?ÿ@.*ÿA<B,+@<>8ÿ-+C;*DÿB:ÿE>,@<8Fÿ>8ÿ@.*ÿ<8@+G*ÿ+8Dÿ*H.+C;@ÿ-.+88*9;ÿ>?ÿ+ÿIJKÿ--ÿL+M+;+G<
N<8O+ÿD,<A*,
& 711$#1363631!'03PQ ÿ$R
S*8F+,C.ÿE>,@<8Fÿ;+9C,+8ÿ<8@+G*ÿD+8ÿ*H.+C;@ÿ@*,.+D+EÿG<8*,O+ÿG+M+;+G<ÿ8<8O+ÿTÿ@+GÿIJKÿ--
& 711$#1363631!'03P6 ÿ$R
UE@<V+;<ÿG>8;CV;<ÿB+.+8ÿB+G+,ÿE+D+ÿV*;<8ÿB*8;<8ÿV*8FFC8+G+8ÿ+,@<?<-<+9ÿ8*C,+9ÿ8*@M>,G W
W
!"#"$1$%&1!11'(13 216
& 711$#13)3)31!'03*0 ÿ$+
,-./0101ÿ3.4.56764ÿ348161ÿ3659:9:7.-ÿ764;.<.3ÿ=6=.1.4.-ÿ3645:=..-ÿ9.>.ÿ?@ÿABÿ56-CC:-.=.- 5678<6ÿ7.C:D;0
& 711$#13)3)31!'03)E ÿ$+
F.-D.-Cÿ9.-C:-ÿ101765ÿ36-G84704ÿ<.-ÿ36-C;07:-Cÿ/6/6ÿ1.-C=./ÿ9649.101ÿH8@
& 711$#13)3)31!'03**
ÿ$+
,-./0101ÿ=6C.C./.-ÿ3.<.ÿ9/.<6ÿ7:490-ÿIJ@KÿLMMÿNO
& 711$#13)3)31!'0033 ÿ$+
@;6ÿ.-./G101ÿ8PÿD.49:40Q0-CÿR07;STUÿAMUÿLMULTUVMÿ50-:761ÿ;8/<0-Cÿ7056ÿ<:6ÿ78ÿ;.4<-611ÿ.-<
50D48174:D7:46ÿ8-ÿ?@ÿVMÿ?766/
& 711$#13)3)31!'0006 ÿ$+
W.>0.-ÿ101765ÿ36-<0-C0-ÿ:<.4.ÿ<070->.:ÿ<.40ÿ=64:1.=.-ÿ6X.384.784ÿ3.<.ÿ=6-<.4..-ÿ40-C.-ÿ564=ÿYZ[
\
\
\
\
\
!"#"$1$%&1!11'(13 316
& 711$#13)3)31!'00*
ÿ$+
,-./0101ÿ./.3ÿ450ÿ678.-08.ÿ9/40:.ÿ;.:.ÿ/.<=>.3=>046ÿ?@ABÿ17<7/46ÿ:.-ÿ1714:.Cÿ>78=-:010
;7-.6<.C.-ÿ./.3ÿ484>
& 711$#13)3)31!'00)6 ÿ$+
D7-E.>4Cÿ;7-E.34>.-ÿF=/3.17ÿ37>C.:.;ÿ8784.3.-ÿ3.>08ÿ;.:.ÿE.1ÿ673./ÿ.>GÿH7/:0-Eÿ.-3.>.ÿ;0;.ÿI@JK LMAÿ:.-ÿ;7/.3ÿIDNÿOOP
& 711$#13)3)31!'00)
ÿ$+
Q.-G.-Eÿ<.-E4-ÿ6710-ÿ;7-E76;.ÿ<>0873ÿ.>.-Eÿ87/.;.ÿR7-E.-ÿ673=:7ÿ4/0>ÿ378.-
& 711$#13)3)31!'0*00 ÿ$+
,-./S101ÿ=9ÿ3C7ÿG=>>=10=-ÿ>.37ÿ.-:ÿ>76.0-0-Eÿ/097ÿ=9ÿ3C7ÿAMÿH.137ÿ3>.-1;=>3ÿ>=//T=99ÿ3.-8ÿG=6;=17:ÿ=9 MLUVÿ13.0-/711ÿ1377/
& 711$#13)3)31!'0**
ÿ$+
D7>.-G.-E.-ÿ3>.-16010ÿ>=:.ÿE0E0ÿ1G>7Hÿ7W3>4:7>
X
X
X
X
X
!"#"$1$%&1!11'(13 016
& 711$#13)3)31!'0**
ÿ$+
,-./0ÿ232045ÿ678.89/78-3ÿ83ÿ:2;/.83/78-3ÿ<-=20ÿ<./3
& 711$#13)3)31!'0*2) ÿ$+
>
>
!"#"$1$%&1!11'(13 )16
*+,-./01*-+
2ÿÿ45ÿÿÿ 2ÿ6"ÿ$ÿ7"ÿÿÿ 2ÿ8 &"ÿ7 ! ÿÿÿ 2ÿ9 &ÿ:$ÿÿÿ 2ÿ9 &ÿ6ÿÿÿ
2ÿ8ÿ;'(ÿ8"ÿÿÿ 2ÿ<ÿ9""ÿ8"5ÿÿÿ 2ÿ=5#& ÿ "ÿÿÿ
2ÿ8#!ÿ$ÿ; " ÿÿÿ 2ÿ7>!ÿÿÿ
2ÿ8$ÿ!ÿÿÿ 2ÿ;'(ÿÿÿ 2ÿ= " ÿÿÿ 2ÿÿÿÿ 2ÿÿÿÿ
!"#"$1$%&1!11'(13 )16
!"#"$1$%&1!11'(13 )16
*ÿ+$
*ÿ, &
*ÿ-.
97 ÿ ÿ ÿ ÿ 9 ÿ ÿ "$ÿ $ ÿ ÿ / 'ÿ /!!
, . 0 /!! " ÿ 0 ÿ 1 ÿ - "
ÿ
!"#"$1$%&1!11'(13 616
8) &$ÿ )*7
+8898,ÿ-ÿ.&ÿ##ÿ#ÿ9&!!$*&ÿ/# 0#ÿ. ÿÿ21ÿ2#"*ÿ3ÿ/#ÿ4#4ÿ5$ 8 ÿ"$ÿ7ÿ6624ÿ8&ÿ7ÿ2ÿ6207112
8-!7ÿ9 !"#"$ ÿ
JTTM: Jurnal Terapan Teknik Mesin is licensed under a Creative Commons Attribution-NonCommercial 4.0 International License.
1. INTRODUCTION
The world's expanding demand for energy, in correlation with its growing population and economy, is met by traditional energy sources that damage the environment. This will worsen in the future, as energy consumption will increase by 44 percent from 2006 to 2030 [1]. For a time during the previous ten years (2010–2020), Indonesia's final energy consumption headed from 134 million TOE to 258 million TOE, representing an 8.5% annual increase [2]. The need to reduce greenhouse gas emissions while also controlling substantial price hikes for conventional energy fuels offers an opportunity for each country's governments to implement new energy policies, particularly those that use new and renewable energy sources [3].
Global warming occurs as a result of CO2 production exceeding its limit, and PLTU is one of these producing sources. This cannot be prevented because coal is used as a fuel in the PLTU's power production process. To reduce or substitute CO2 emissions in PLTUs that use coal, energy conversion is required at various stages of the PLTU process, one of which is energy conversion in seawater treatment systems (desalination), which utilizes the reverse osmosis method in this case. Conventional desalination systems have an enormous effect on the global warming phenomenon, while producing 1000 m3 of fresh water requires 5 tons of crude oil, resulting in 10 tons of CO2 equivalent to 5000 m3 of greenhouse gases [4].
The amount of energy required for the desalination process depends on the quality of the feedwater, the level of water treatment, the treatment technique applied by the facility, and the plant's capacity. Despite reduced energy costs for groundwater and surface water treatment, the supply from these sources is insufficient to fulfill the increased demand for fresh water [5]. As a result, renewable energy may be a solution and a crucial component in preventing climate change through reducing air pollution [6]. Earth receives about 3.8 x 1024 J of solar energy on average, which is 6000 times larger than global use [7]. Although desalination technology is currently fairly expensive, the decreasing price of renewable energy is predicted to lower the total cost of the desalination process in future [8].
The capacity of solar power generation can be computed according to the available land area in the selected zone [9]. Solar power plants disadvantages include insufficient materials, expensive p ISSN 2721-5377| e ISSN 2721-7825
http://jurnal.sttmcileungsi.ac.id/index.php/jttm
Solar energy utilization in desalination power plan
Erdiansyah1, Tarsisius Kristyadi 1*, Diki Ismail Permana2
1* Master of Mechanical Engineering, Institut Teknologi Nasional, Jl. P.H.H Mustofa No.23, Bandung, West Java, Indonesia, 40124
2 Hungarian University of Agriculture and Life Sciences, Hungary
*E-mail: [email protected]
Article Submit: 31/03/2023 Article Revision: 19/04/2023 Article Accepted: 20/04/2023 Abstract: A steam power plant (PLTU) uses demin water to generate 3x350 MW of electrical energy. Reverse Osmosis Desalination system is used to treat the 190 m3/hour of desalinated water that is produced from seawater. Solar energy will replace the 225.41 kW of electrical energy required for the RO desalination pump in order to lessen pollution and the greenhouse effect caused by PLTU. The PLTU is situated in Pelabuhan Ratu Sukabumi, West Java. This region has a solar radiation potential of 3.189 kWp/day/m2 and a deployment space for PV modules of 6,167 m2, divided into two zones: the ground and the roof. The needs analysis is carried out by utilizing software simulations that estimate the power requirements of desalination pumps and the potential of electrical energy from solar radiation based on land availability. According to the modeling findings, PLTS can produce 1024 MWh/year of electrical energy with 1,458 pieces of 450 Wp PV modules and 5 units of 120 kW inverters.
Keywords: Power plant, PLTS, desalination, reverse osmosis, PV
Solar energy utilization in desalination power plan
installation costs, and relatively low energy conversion performance (ranging from 12% to 29%).
When weather conditions are favorable, photovoltaic (PV) systems must be developed to operate at their optimum performance so as to preserve the maximum power of the solar system panels. Solar panels, inverters, power conditioning devices, and grid-connected equipment compose a photovoltaic system. Also, the cost of these components is rapidly decreasing. PV systems are assessed based on the total amount of energy produced annually, the specific product, and the performance ratio. Many factors impact the performance of a solar panel module, such the module, inverter quality, geographic coordinates, tilt, and orientation of the PV panels [10].
A stage needed for the development or execution of a reliable PLTS to determine data that affects system performance. Data collection can be categorized into two categories: location data and data required for estimating general energy requirements. As a result, the size of the PV module arrangement must be estimated in order to meet the required energy requirements [11].
The object discussed in this study is the West Java II PLTU, which has a capacity of 3x350 MW it is located in Palabuhan Ratu Sukabumi, West Java. PVSYST 7.3.2, the software used in the simulation to calculate a PV system, is used along with data from different sources.
2. METHOD
The West Java II PLTU Pelabuhan Ratu, which is utilized for RO desalination, was chosen as the site for the PLTS development plan based on a number of factors, including land topography, land usage, present land functions, and distance from the RO desalination location.
The capacity of the pumps used in the RO desalination process is utilized to determine electricity demand using an interview survey. Data regarding solar radiation are acquired from the worldwide solar atlas site (https://globalsolaratlas.info) and Meteonorm 8.0 data (2010–2014), and Sat = 100%
can be obtained in PVSYST 7.3.2.
2.1 Flowchart
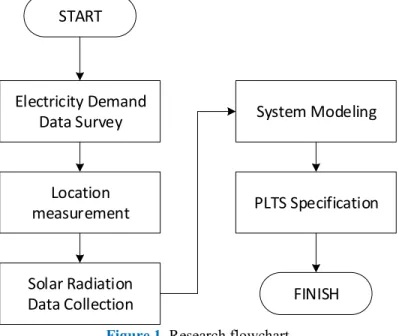
PLTS planning for RO desalination in PLTU requires several stages, including calculating elec- tricity demand through interviews and determining the location, determining solar radiation data, de- termining potential electrical energy production based on land availability, and system modeling. The flowchart of the research stages can be seen in Figure 1.
Figure 1. Research flowchart
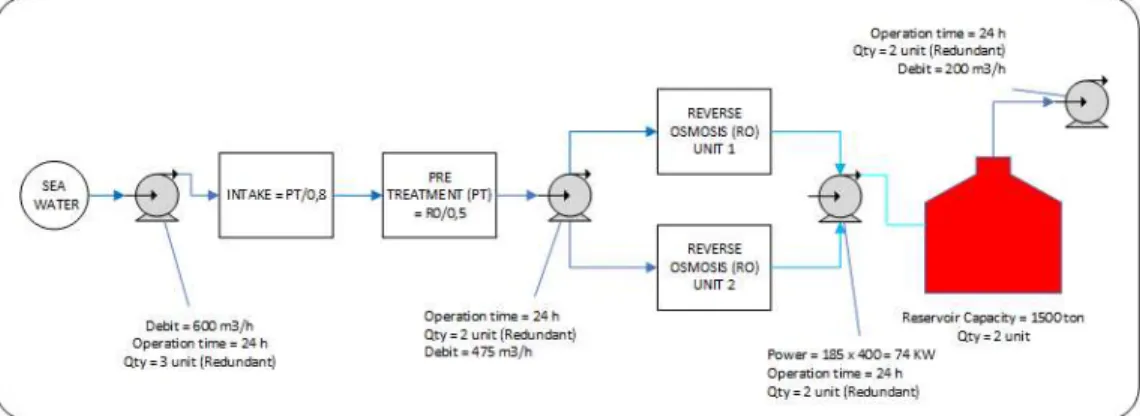
Data collection on energy requirements in desalination is based on interview results, and the total power requirements of pumps 1, 2, 3, and 4 are 225.4 kW working for 24 hours. Pump 1 has a capacity of 75 kW and is used to pump seawater into the intake pond for the pre-treatment process.
Pump 2 drains water for the reverse osmosis process and has a 475 m3/hour discharge. Pump 3 has a capacity of 74 kW and is used to drain the demin water tank's contents. Pump 4 distributes demin water and has a 200 m3/hour discharge. Water treatment flow can be seen in Figure 2.
START
Electricity Demand Data Survey
Location measurement
Solar Radiation Data Collection
System Modeling
PLTS Specification
FINISH
JTTM: Jurnal Terapan Teknik Mesin is licensed under a Creative Commons Attribution- NonCommercial 4.0 International License.
Figure 2. Seawater treatment process diagram 2.2 Location
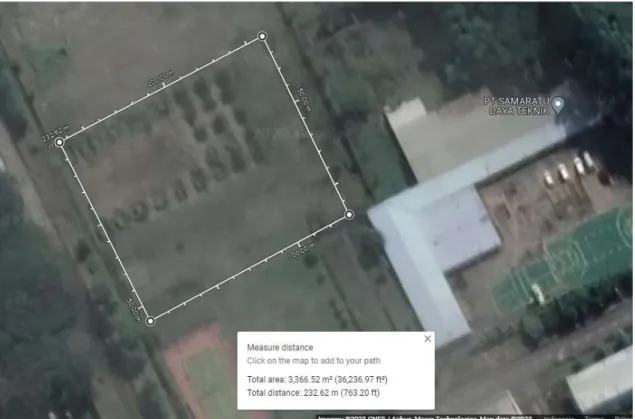
Figure 3. Location of PLTU Jawa Barat 2 Sukabumi
Located in Palabuhan Ratu, Sukabumi City, West Java Province, with coordinates -07.022336°, 106.543179° (Figure 3), West Java Steam Power Plant 2 has a 3x350 MW capacity. It has a potential solar radiation of 3.189 kWp/day/m2 or 95.67 kWp/day/m2. With a land area of 6167 m2 allocated for the development of a solar power plant (PLTS), it is divided into a ground zone (zone B) and a roof top zone (zone A), each measuring 2338 m2 and 3829 m2, respectively. Figure 4 and Figure 5 show the location and position of zones A and B.
Figure 4. Zone A area
Solar energy utilization in desalination power plan
The potential for solar energy production can reach 19667 kWp/day if we consider the potential for solar radiation around the place, which has a total area of 6167 m2. This occurs because we did not account for the distance between modules, the angle of the modules, the area of the panel house, the space for lightning rods, and the area for guardrails; as a result, the area that may be used for PV installation is often less than 60% of the available area.
Figure 5. Zone B area.
3. RESULT AND DISCUSSION
According to the simulation results produced with PVSYST 7.3.2, the PV module utilized is LR4-72 HPH 450 with a capacity of 450 Wp of monocrystalline silicon, dimensions of 2.17 m2, and a weight of 23.5 kg. The inverter utilized is the PVS 120 TL, which has a nominal AV power of 120 kVA and a grid voltage of 480 V. In zone A, 576 PV modules and 2 inverters with nominal PV power of 220 kWAC and 250 kWp were installed. 882 PV modules and 3 inverters with a nominal PV output of 360 kWAC and 397 kWp were installed in zone B. The total installed nominal PV power is 656 kWp and 580 kWAC. This solar system can generate 1024 MWh of power each year, with zone A producing 404 MWh and zone B producing 620 MWh.
3.1 Data analysis
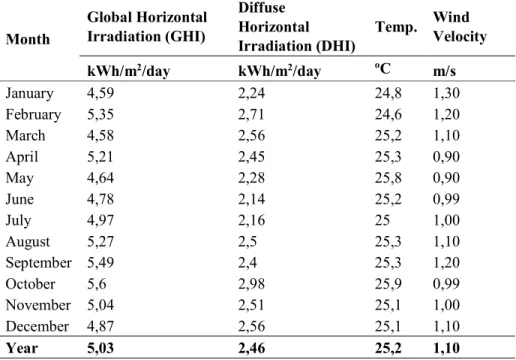
The analysis step makes use of two data sources: the PVsyst program, which uses solar radiation data from Meteonorm 8.0 (2010–2014), and Sat = 100%, as seen in Table 1. The second set of data was obtained from https://globalsolaratlas.info for the point of -07°01'20", 106°32'35", which has a potential solar radiation of 3.189 kWp/day/m2, as seen in Figure 5.
Global horizontal irradiance (GHI) refers to the total quantity of shortwave solar radiation re- ceived horizontally by a ground surface, whereas diffuse horizontal irradiance (DHI) refers to the amount of solar radiation received per unit area by a surface that is neither shaded, shadowed, or re- flected from any direction. The quantity of solar radiation that is received by a surface that is always perpendicular (or normal) to the incoming rays from the sun is known as direct normal irradiance (DNI). The equation obtained is GHI = DNI x cos(θ) +DHI [12].
JTTM: Jurnal Terapan Teknik Mesin is licensed under a Creative Commons Attribution- NonCommercial 4.0 International License.
Table 1 shows the average value of solar radiation that can be received by an object where for the location of the West Java II PLTU an average GHI of 5.03kWh/m2/day, a temperature of 25.2oC and a wind speed of 1.1m/s is obtained.
Table 1. Meteonorm 8.0 data (2010-2014), Sat=100%
Month
Global Horizontal Irradiation (GHI)
Diffuse Horizontal Irradiation (DHI)
Temp. Wind Velocity kWh/m2/day kWh/m2/day oC m/s
January 4,59 2,24 24,8 1,30
February 5,35 2,71 24,6 1,20
March 4,58 2,56 25,2 1,10
April 5,21 2,45 25,3 0,90
May 4,64 2,28 25,8 0,90
June 4,78 2,14 25,2 0,99
July 4,97 2,16 25 1,00
August 5,27 2,5 25,3 1,10
September 5,49 2,4 25,3 1,20
October 5,6 2,98 25,9 0,99
November 5,04 2,51 25,1 1,00
December 4,87 2,56 25,1 1,10
Year 5,03 2,46 25,2 1,10
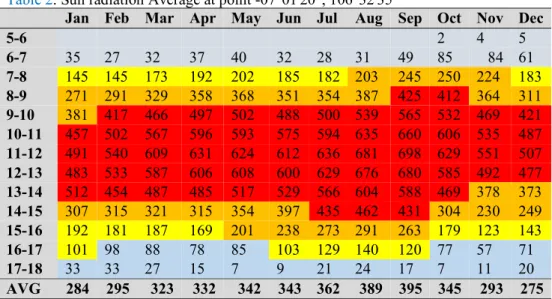
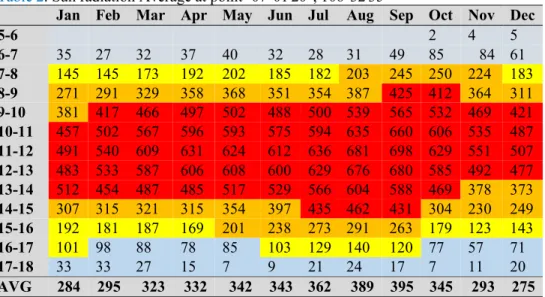
Table 2 shows that the color red indicates the month with the highest average solar radiation from April to September during the hours of 10:00 to 14:00. The blue color represents the lower average of sun radiation from 18.00 to 06.00 every day.
Table 2. Sun radiation Average at point -07°01'20", 106°32'35"
Jan Feb Mar Apr May Jun Jul Aug Sep Oct Nov Dec
5-6 2 4 5
6-7 35 27 32 37 40 32 28 31 49 85 84 61
7-8 145 145 173 192 202 185 182 203 245 250 224 183 8-9 271 291 329 358 368 351 354 387 425 412 364 311 9-10 381 417 466 497 502 488 500 539 565 532 469 421 10-11 457 502 567 596 593 575 594 635 660 606 535 487 11-12 491 540 609 631 624 612 636 681 698 629 551 507 12-13 483 533 587 606 608 600 629 676 680 585 492 477 13-14 512 454 487 485 517 529 566 604 588 469 378 373 14-15 307 315 321 315 354 397 435 462 431 304 230 249 15-16 192 181 187 169 201 238 273 291 263 179 123 143 16-17 101 98 88 78 85 103 129 140 120 77 57 71 17-18 33 33 27 15 7 9 21 24 17 7 11 20 AVG 284 295 323 332 342 343 362 389 395 345 293 275
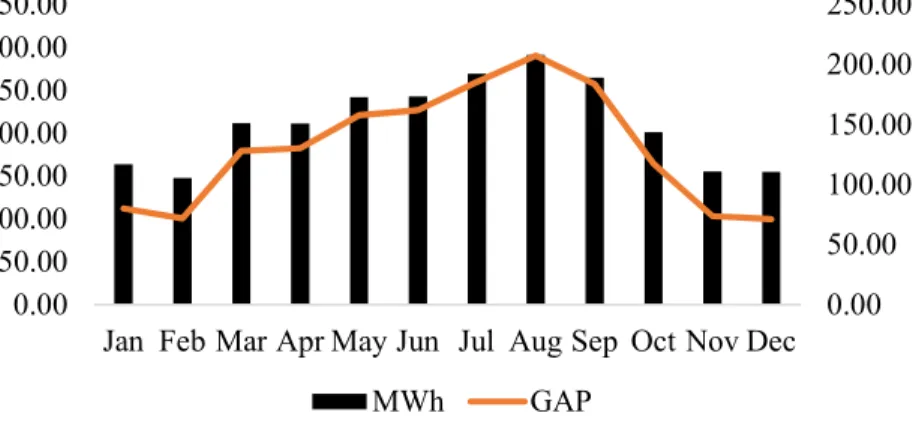
The amount of energy that can be generated by this from January to December based on the information available is 2955 MWh/year, whereas the global solar atlas produces 2558 MWh/year.
The potential electrical energy produced by the solar power plant from January to December and the gap (difference) of electrical energy after being used for the RO desalination process can be calculated using meteonorm and global solar atlas data. Figure 6 and Figure 7 show that an electrical energy gap exists when the line is below the bar and vice versa.
Solar energy utilization in desalination power plan
Figure 6. PLTS production patten (meteonorm data)
The difference in the amount of electrical energy produced by meteonorm and global solar atlas is due to differences in solar radiation patterns in February, when it should still be rainy season, but the radiation value received exceeds the radiation value in July and August, when the dry season is typically at its peak.
Figure 7. PLTS production patten (global solar atlas data) 3.2 Technical design
As shown in Table 3, there are several options for how PV for Desalination Reverse Osmosis (PV-RO) can be applied [13]:
- Scenario 1: Grid-RO: The grid supplies all of the RO's electrical energy demands; therefore, no PV panels are required.;
- Scenario 2: PV-Grid-RO: During the day, solar energy is used, while at night or when it is overcast or rainy, electrical energy from the grid is used.
- Scenario 3: PV-Grid Assisted-RO: PV is considered the main source of power, with grid electricity serving as a backup. This means that the PV system was designed to meet the RO's entire needs.
- Scenario 4: Grid-PV Assisted-RO: The grid is the primary source of power, and all solar- generated electricity is sold back to the grid.
- Scenario 5: PV-Batteries-RO: when the electricity from the sun is insufficient for the RO's needs.
In this study RO produce 4560 m3/day of demineral water. Grid-PV-assisted-RO is the PV-RO scenario used, in which the grid is considered the primary source of power and all electricity generated
- 50.00 100.00 150.00 200.00 250.00 300.00
- 50.00 100.00 150.00 200.00 250.00 300.00 350.00 400.00
Jan Feb Mar Apr May Jun Jul Aug Sep Oct Nov Dec MWh GAP
0.00 50.00 100.00 150.00 200.00 250.00
0.00 50.00 100.00 150.00 200.00 250.00 300.00 350.00
Jan Feb Mar Apr May Jun Jul Aug Sep Oct Nov Dec
MWh GAP
JTTM: Jurnal Terapan Teknik Mesin is licensed under a Creative Commons Attribution- NonCommercial 4.0 International License.
by PV is sold back to the grid [13]. In this scenario, the quantity of electricity produced by the PV and exported to the grid equals the amount of power imported from the grid for 12 hours of operation.
Table 3. Scenario type PV-RO [13].
Figure 8 shows a design of 32 unit modules stringed together with 18 PV modules for zone A, which is located on the roof top. Zone B, which is on the ground, has 49 unit string module configurations with 18 PV modules a piece.
Figure 8. PV Layout zone A
Limited space in PV installations, especially on the roof, is a critical challenge where generally the land required for PV is 10m2/kW [14]. Components of concern for zone A include:
a. PV module placement, where the distance between modules must be considered for mainte- nance and the height of the module holder because the higher the forces caused by the wind can affect the strength.
b. For the area of the panel room, attention must be paid to air circulation so that the room tem- perature does not affect the inverter and panel work.
c. Lightning rod installation must be ensured that it can reach the zone A area
The location of the PLTU which is a coastal area and the available area is still large, so it can be considered using an alternative energy source other than the sun, namely wind. Hybrid power genera- tion systems, such as solar PV panels combined with wind turbines, are becoming more suitable with complementary advantages that can improve reliability and improve the environmental aspects of de- salination systems [15].
Solar energy utilization in desalination power plan
4. CONCLUSION
The electric power required for a 225.4 kW RO desalination pump, which operates 24 hours a day, can produce the demineralized water needed for a power plant of 4560 m3/day. The plant is PLTU Jawa Barat 2 Palabuhan Ratu Sukabumi West Java, with coordinates of -07°01'20" and 106°32'35".
The location has a potential solar radiation of 3.189 kWp/day/m2. Solar energy, transformed using PLTS with an installed capacity of 656 kWp, will meet electricity demands. PLTS capacity is built from two areas, or zones. Zone A has an area of 1252 m2 and can generate 259 kWp, whereas Zone B has an area of 1917 m2 and can generate 397 kWp. The solar module applied has a capacity of 450 Wp and is configured with 81 string modules, each having 18 solar modules. The scenario chosen is Grid-PV-Assisted-RO, in which the quantity of power generated by PV and exported to the grid equals the amount of electricity imported from the grid for 12 hours of operation.
ACKNOWLEDGEMENT
Mechanical Engineering, Universitas Kebangsaan Republik Indonesia REFERENCES
[1] K. A. Kumar Manish, "Performance assessment and degradation analysis of solar photovoltaic technologies: A review," Renewable and Sustainable Energy Reviews, 2017.
[2] T. A. Kristyadi Tarsisius, "Optimasi Perencanaan PLTS Terpusat Di Wilayah Pulau Terluar,"
Jurnal Infotekmesin, vol. Vol.12, 2021.
[3] Kumar NM et al, "Performance analysis of 100 kWp grid connected Si-poly photovoltaic system using PVsyst simulation tool," Energy Procedia, 2017.
[4] Alkaisi A et al, "A review of the water desalination systems integrated with," Energy Procedia 110, 2017.
[5] Haya Nassrullah et al, "Energy for desalination: A state-of-the-art review," Desalination, 2020.
[6] H. E. Shiva Gorjian, "Introduction," in Photovoltaic Solar Energy Conversion, Academic Press, 2020.
[7] Shukla AK et al, "Simulation and performance analysis of 110 kWp grid-connected photovoltaic system for residential building in India: A comparative analysis of various PV technology,"
Energy Reports, 2016.
[8] S. H. Abdulloh, "Desalinasi Air dengan Memanfaatkan Energi Terbarukan," 2015.
[9] S Sreenath et al, "Solar PV energy system in Malaysian airport: Glare analysis, general design and performance assessment," Energy Reports, 2020.
[10] B. A. Belmahdi Brahim, "Solar Potential Assessment using PVsyst Software in the Northern Zone of Morocco," 2020.
[11] Irwan YM et al, "Stand-Alone Photovoltaic (SAPV) System Assessment using PVSYST Software," Energy Procedia, 2015.
[12] Boutahir Khalifa Mohamed et al, "Effect of Feature Selection on the Prediction of Direct Normal Irradiance," Big Data Mining and Analytics, vol. 5, no. 4, 2022.
[13] Bijan Rahimi et al, "A feasibility study of solar-powered reverse osmosis processes,"
Desalination, 2021.
[14] El Hammoumi Aboubakr et al, "Design and construction of a test bench to investigate the potential of," Journal of Cleaner Production, 2021.
[15] Ali Ben et al, "Systemic design and energy management of a standalone battery-less PV/Wid driven brackish water reverse osmosis desalination system," Sustainable Energy Technologies and Assessments, 2020.
Solar energy utilization in desalination power plan
By tarsisius kristyadi
WORD COUNT 3424 TIME SUBMITTED 24-APR-2023 08:27PM
PAPER ID 99041340
2
6 7
8
10 11
12
2 3
2
1 1 1 1
1
1 1
4
1 1
2
5 5
8
12 %
SIMILARITY INDEX
1
2 3 4 5
6
Solar energy utilization in desalination power plan
ORIGINALITY REPORT
PRIMARY SOURCES
Bijan Rahimi, Hamed Shirvani, Ali Asghar
Alamolhoda, Fathollah Farhadi, Mohammadreza
Karimi. "A feasibility study of solar-powered reverse osmosis processes", Desalination, 2020
Crossref
jurnal.sttmcileungsi.ac.id
Internet
www.sciopen.com
Internet
themimu.info
Internet
I. Ben Ali, M. Turki, J. Belhadj, X. Roboam. "Systemic design and energy management of a standalone
battery-less PV/Wind driven brackish water reverse osmosis desalination system", Sustainable Energy Technologies and Assessments, 2020
Crossref
Jhon Jairo Feria-Díaz, María Cristina López-Méndez, Juan Pablo Rodríguez-Miranda, Luis Carlos Sandoval- Herazo et al. "Commercial Thermal Technologies for
Desalination of Water from Renewable Energies: A State of the Art Review", Processes, 2021
Crossref
88 words — 3%
84 words — 3%
50 words — 2%
27 words — 1%
21 words — 1%
21 words — 1%
8
9 10
11 12
EXCLUDE QUOTES ON EXCLUDE BIBLIOGRAPHY ON
EXCLUDE SOURCES < 10 WORDS EXCLUDE MATCHES OFF
assessment and degradation analysis of solar
photovoltaic technologies: A review", Renewable and Sustainable Energy Reviews, 2017
Crossref
Ahmed M. Ghaithan, Awsan Mohammed, Laith
Hadidi. "Assessment of integrating solar energy with
reverse osmosis desalination", Sustainable Energy Technologies and Assessments, 2022
Crossref
youthcentral.umn.edu
Internet
Akash Kumar Shukla, K. Sudhakar, Prashant
Baredar. "Simulation and performance analysis of
110kWp grid-connected photovoltaic system for residential building in India: A comparative analysis of various PV
technology", Energy Reports, 2016
Crossref
www.coursehero.com
Internet
www.ijstr.org
Internet