To obtain the crystalline phases and crystal morphology, XRD and TEM analysis of the samples was performed. The process of shade matching the shade of the restoration to that of the adjacent teeth is challenging, demanding and frustrating for the dentist and then, the fabrication of crowns and bridges, for the ceramist.
Factors Affecting Shade Selection
- Physical Factors
- Illuminant
- Metamerism
- Physiological Factors
- Brunessence
- Hue Bias
- Psychological Factors
- Apperception
- Adaptation
- Clinical Factors
- Oscillation
- Mitering
- Environment
- Miscellaneous
Since the surface anatomy of the teeth affects mitering, teeth should be viewed directly and at different angles during the shade evaluation process to minimize the effect of this factor. This factor can be eliminated if the dentist selects the shade in the presence of the ceramist.
Anatomical Considerations
Summary
History of Dental Ceramics
Evolution of Dental Ceramics
Elias Wildman formulated more translucent porcelain compared to the ancient ones that resembled other pottery materials - 1873 AD. The strength of pottery materials increased significantly by replacing quartz with a corresponding amount of calcined alumina.
Glass-Ceramics in Dentistry
The time and temperature of the heat treatment of the ceramic affects the rate and size of the crystal growth. The uniform distribution of crystals throughout the glass phase is essential to ensure high strength of the glass-ceramic.
Classification of Glass Ceramics
The ceramization technique involves heat treatment in two stages, as the rates of crystal nucleation and crystal growth rates are maximized at different temperatures. The new crystals formed in this way grow directly in the glassy phase and subsequently change the composition of the remaining glass.
Glass-Ceramic Properties
- Processing Properties
- Thermal Properties
- Chemical Properties
- Biological Properties
- Mechanical Properties
- Optical Properties
Depending on the type of crystal microstructure, glass-ceramics can be produced that are completely opaque. Glass ceramics can be produced in any desired color by adding pigment ions during processing.
Lithium Silicate Glass-Ceramics
Colorimetry
Color Attributes
- Evolution of color difference scales
- The Munsell Color System
- CIE Color Space
To achieve better hue matching, a full understanding of the most commonly used color scales, “The Munsell Color System” and the “CIE Color Space,” is required. He defined value as “the quality by which we distinguish a light color from a dark one.”32.

Geometric Attributes
- Reflectance Spectroscopy
- Transmission Spectroscopy
- Absorption
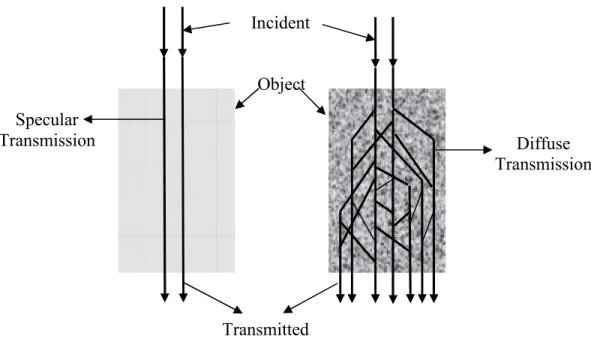
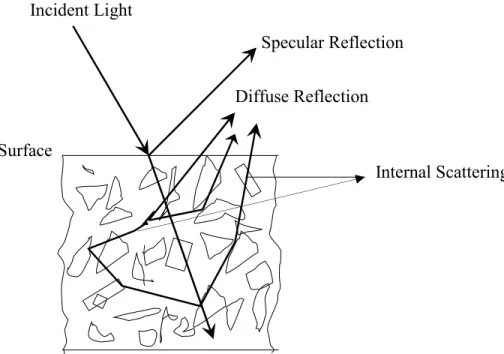
Reflection is a phenomenon in which an object redirects light directed towards its surface to the same side as the light. Diffuse reflection is a phenomenon in which there is a uniform reflection of light without dependence on the direction of the viewer. Transmission is a phenomenon in which an object, after passing through an object, redirects the light directed towards its surface to the opposite side of the light.
Specular transmission is a phenomenon in which the incident light, while transmitted through an object, is not diffuse, similar to diffuse transmission, but differing only in that the transmitted light does not diffuse into the object before leaving the opposite surface. Absorption is a phenomenon in which the incident light scatters and disperses within an object and is ultimately absorbed.
Fluorescence Spectroscopy
By measuring an object's transmittance and reflectance values, the amount of light absorbed by the object can be easily calculated. Selective absorption is the process of absorbing only certain wavelengths of light and is the primary source of imparting color to an object. When an object is exposed to high-energy electromagnetic radiation, its atoms absorb the energy while its electrons realize an excited state.
These emitted photons usually have a higher wavelength than the excited one and thus fluorescence occurs. They also advocated that the cementing medium used affects the fluorescence of the prosthesis.42 In another study, they revealed that unacceptable levels of fluorescence in the shade guides are responsible for the selection of improper ceramic shade.43 .
Spectrophotometer
Shade Matching in Dentistry
He also explained the importance of spectral measurements as invaluable tools in the process of color determination.16 Clark's efforts were not recognized at the time and even today many of his writings are ignored. Since then, a number of studies have been conducted in this area, but the color evaluation process is still primitive and has not kept pace with other developments in restorative dentistry. Studies have shown that commercially available shade schemes are inadequate, are not logically arranged and do not cover the entire shade range of natural teeth.4,9,28,29 A number of studies have also been conducted to establish a new order of ranking of develop shades. on the color guide and to develop custom shades.
A breakthrough in commercially available shade guides was made when Vita Zahnfabrik developed a new shade guide, "Vitapan 3D Master", based on a three-dimensional color concept. Although this represented a huge improvement over previous shade guides, it still showed inconsistency in shade distribution.4 Comparative studies were conducted between commercially available shade guides and found that there were inconsistencies in the shade matching systems and that none of the systems proved to be better than the others.47.
Shade Matching Method
Visual and Instrumental shade matching methods
Visual comparison studies have been performed to determine the color range of natural teeth and have subsequently proposed various color matching methods to minimize subjectivity.37 Photometric analysis of tooth shade is also advocated in many studies, and one analysis spectroscopic of the obtained shade. and the resulting photograph is proposed.37 A number of studies have proven the accuracy and optical properties of spectrophotometers. This is due to a number of factors that cause errors when estimating the color of the sample and a smaller number of errors when measuring the color difference.56-58. O'Brien's studies first advocated the use of an integrating sphere in the spectrophotometer and proved their power to measure tooth spectra.
They concluded that the results from the spectrophotometer are comparable to the results from the visual method only in the middle third of the tooth, and that measurements obtained from other parts of the teeth showed differences.63 A study by Horn et. eel. A team of Japanese investigators developed a new computer color matching system, studied the properties of absorption and scattering coefficients of dental porcelain using a spectrophotometer (CAS-ID1).
X-Ray Diffraction
TEM Analysis
Differential Scanning Calorimetry
UV-Vis Spectrophotometry
Standardization of the Spectrophotometers
General Outline of the Experimental Procedure
Reflectance and Transmittance Spectrophotometry
- Diffuse Reflectance
- Specular Reflectance
- Diffuse Transmittance
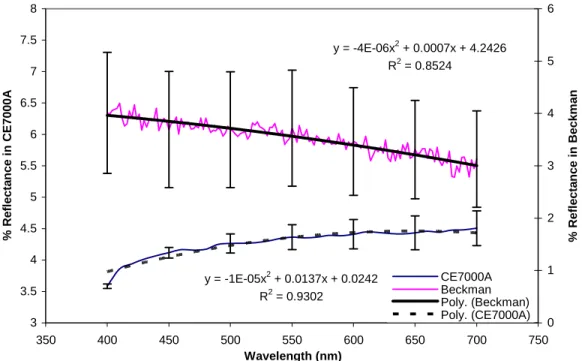
A zero degree offset sample holder was used to measure the diffuse reflectance of the samples. An average of the six runs was then plotted against wavelength for all samples. In the Beckman DU70 spectrophotometer, an eight degree offset sample holder was used instead of a zero degree offset sample holder to measure the total reflectance of the samples.
We then plotted the average of the six residuals to obtain the specular reflectance curves. A sample holder at the front end of the integrating sphere was used to accommodate the sample holder.
Heat Treatment
Another sample holder at the rear end of the sphere held the Spectralon standard during all experimental runs. The transmission spectra of the entire set of samples were acquired at 1200 nm/min and the entire process was repeated five times for each sample.
UV Exposure
Experiments on Natural Teeth
Fluorescence Spectroscopy
Munsell Notation and CIE L*a*b* Values Determination
UV-Visible Spectroscopy
Standardization of the spectrophotometers
Photographic evaluation of the samples and the standard
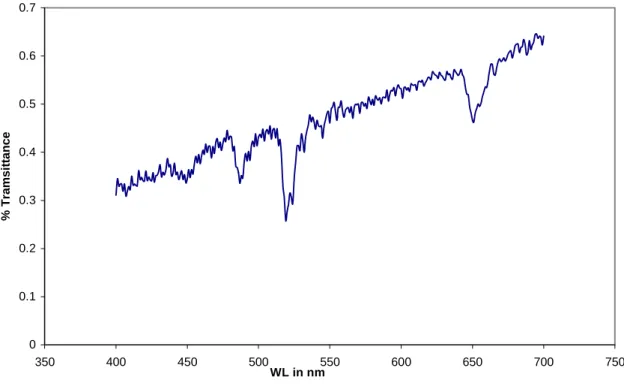
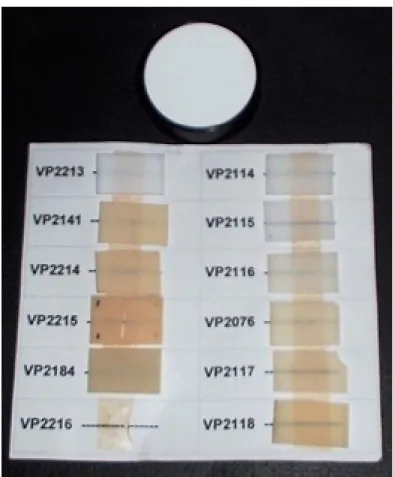
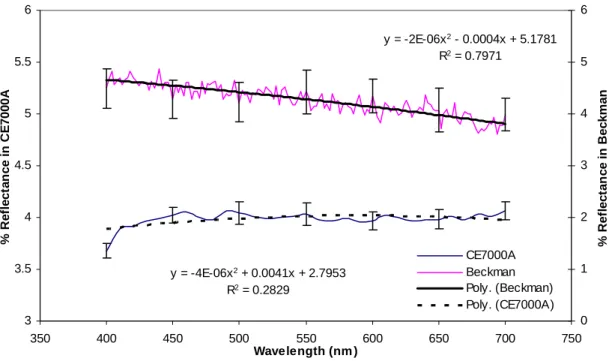
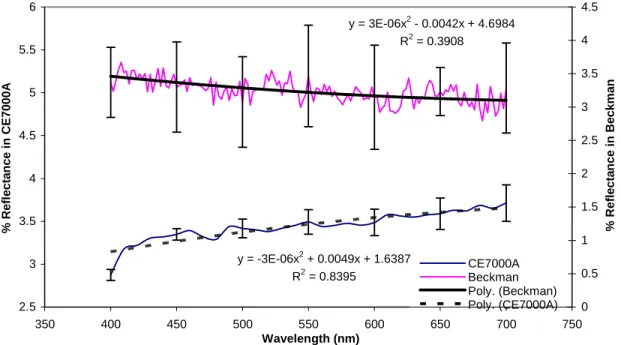
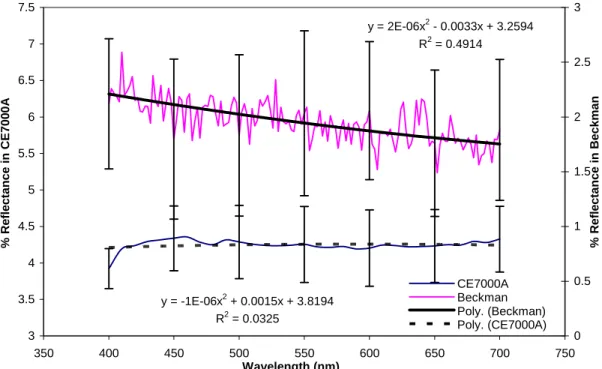
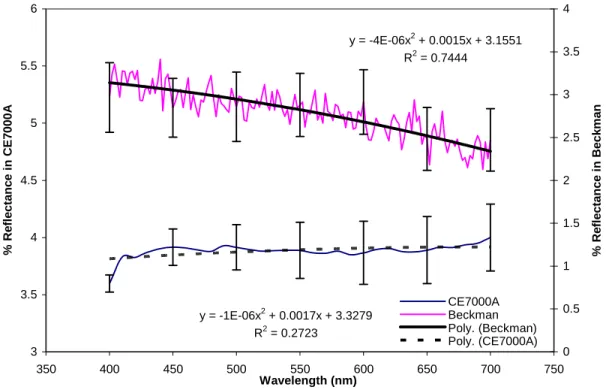
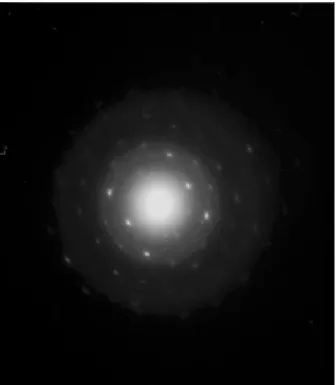
Ten of the twelve glass-ceramic samples were used for UV-Visible spectroscopy experiments. Figures IV.7 – IV.9 show the diffuse reflectance, diffuse transmittance and specular reflectance of the glass-ceramic sample VP2114. A bright field TEM image of the glass ceramic sample is shown in Figure IV.48.
Diffuse reflectance spectra obtained from the glass-ceramic samples showed that most of the samples are reflective in the longer wavelength range (yellow) and a few in the shorter wavelength range (blue).

UV-Visible spectroscopy of the glass-ceramic samples
UV-Visible spectroscopy of Chromascop shade guide teeth
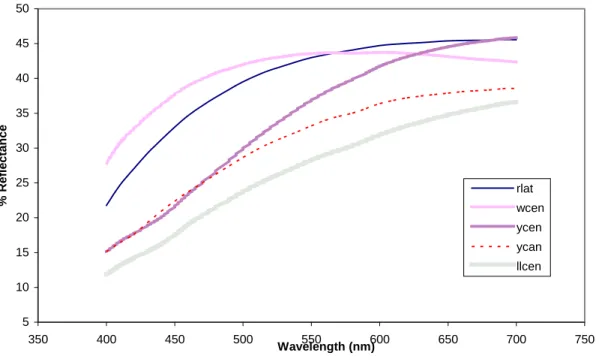
UV-Visible spectroscopy of extracted natural teeth
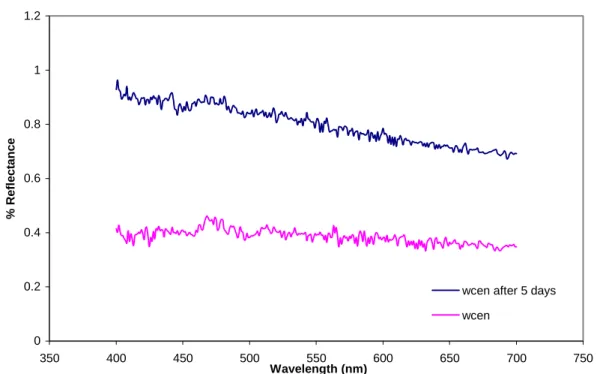
Comparison of the total reflectance spectra of Chromascop screen 140, extracted natural tooth enamel and glass-ceramic sample VP2118. Bright field TEM image of the glass ceramic sample VP2216 taken at 120 kV and a magnification of 25X. Effect of hydration over a period of time on the specular reflectance of the extracted natural tooth W-cen.
Specular reflectance of the tooth was measured on the middle third of the labial surface. Effects of heat and UV light on the specular reflectance of the glass-ceramic samples were investigated using a Perkin–Elmer Lambda 900 spectrophotometer. Tables 4 – 6 express the color of the glass-ceramic samples, extracted natural teeth and Chromascop color guide teeth, respectively, in both the Munsell and CIE L*a*b* nomenclature systems.
Tables 4, 5 and 6 illustrate the ∆E values of glass-ceramic samples, stained teeth and extracted natural teeth obtained with a CE 7000A spectrophotometer.
Fluorescence Spectroscopy of the Glass-Ceramic Samples
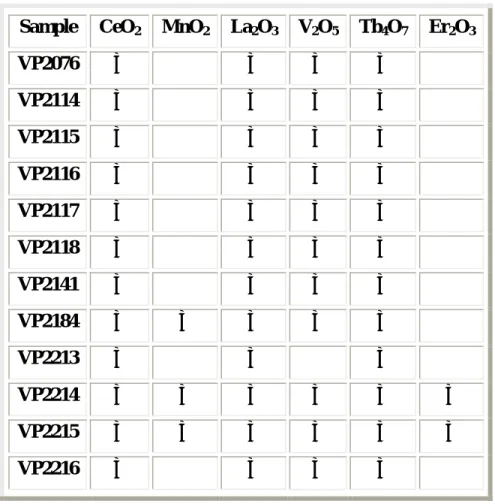
XRD, TEM, and DSC Analysis of the Glass-Ceramic samples
Results of XRD analysis of the sample
The XRD pattern is in good agreement with PDF #49-0803, indicating that the glass ceramic is likely analogous to the crystalline phase of lithium silicon oxide.
Results of TEM analysis of the sample
A diffraction pattern of the sample taken at a camera length of 80.0 cm and 120 kV reveals circles of dots, indicating that the sample is polycrystalline.
Results of the DSC analysis of the sample
Results of the experiments on natural teeth
Effect of hydration on specular reflectance of natural teeth
However, it demonstrates the ability to modify the appearance of glass-ceramics by exposing them to UV light. The main goal of this thesis was to study the results of UV-visible spectroscopy of glass-ceramic samples and derive a figure of merit that can be used for communication between the dentist and ceramist. As previously explained, ∆E values mean the total color difference from that of the standard used.
This would give us the actual deviation in the shade of the glass-ceramic from the shade of the shade guide tooth. Sorensen, "Spectrometric analysis of the influence of metal substrates on the color of metal-ceramic restorations", J.
Effect of surface roughness on specular reflectance of natural teeth
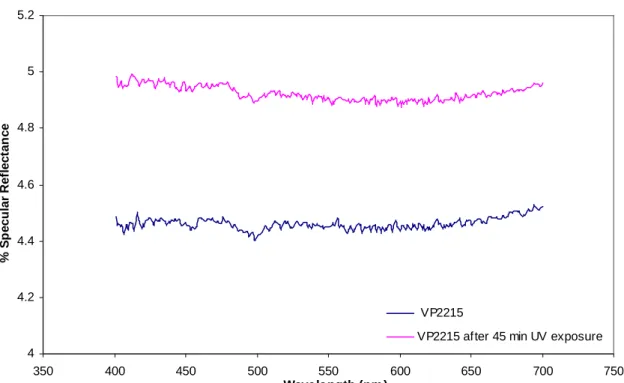
Effect of Heat and UV-light on the glass-ceramic samples
Figures IV.55 and IV.56 show graphs showing the effect of heat and UV light respectively on glass-ceramic samples. It can be observed in Figure IV.55 that heating the samples to their crystallization temperature increases the specular reflectance of the glass-ceramics, the results were inconclusive and more experiments need to be done to confirm the findings. However, this shows that by manipulating the crystallization time and temperature, the actual appearance of the glass-ceramic can be modified.
Visible UV specular reflectance spectra showing the effect of heat on glass-ceramic sample VP2115. Visible UV specular reflectance spectra showing the effect of UV exposure on glass-ceramic sample VP2215.
Munsell and CIE L*a*b* values of the samples
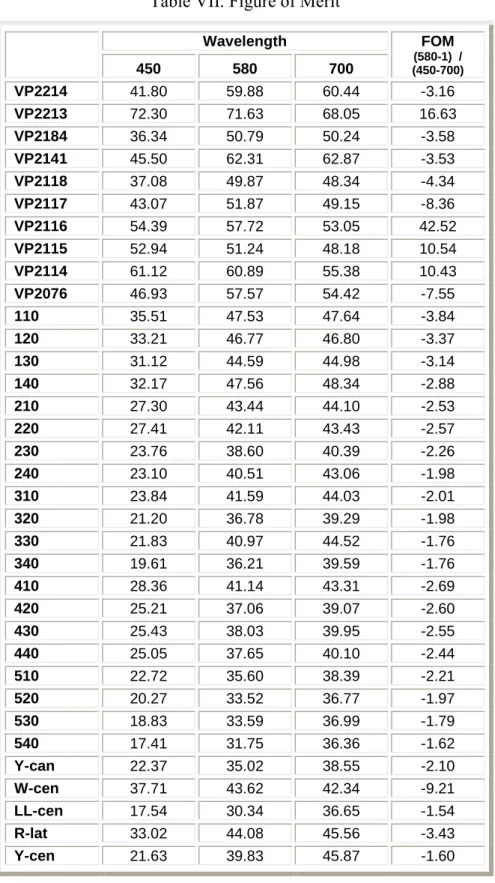
Generation of a Figure of Merit
E-values in the range of 1 – 2 are acceptable for visual comparison of shades; as the ∆E value increases, the visual discrimination of the shadow of the compared objects becomes easier. A FOM based on the Abbe number principle was evaluated using three random wavelengths, two from the ends and one from the center of the visible spectrum. Further investigation would include the spectroscopic analysis of the glass-ceramics using individual color guide teeth as standard runs instead of the standard calibration tile or a Spectralon standard, and comparing the ∆E values obtained during each run.
The data obtained from these results can also help to confirm the efficiency of ∆E values in expressing shade. E values in shade expression are determined, a handheld spectrophotometer can be customized for dental use.