Spider Research
in the 21st Century
trends & perspectives
Edited by David Penney
Siri Scientific Press
Foreword by Norman I. Platnick
Author pdf for research purposes. Not to be made freely available online
Spider Research
in the 21st Century
trends & perspectives
Edited by David Penney
Faculty of Life Sciences The University of Manchester, UK
Foreword by Norman I. Platnick
American Museum of Natural History, New York, USA
Author pdf for research purposes. Not to be made freely available online
ISBN 978-0-9574530-1-2
PuBlIShed By SIrI ScIeNtIfIc PreSS, MaNcheSter, uK
thIS aNd related tItleS are avaIlaBle dIrectly froM the PuBlISher at:
httP://www.SIrIScIeNtIfIcPreSS.co.uK
© 2013, SIrI ScIeNtIfIc PreSS. all rIghtS reServed. No PartS of thIS PuBlIcatIoN May Be reProduced, Stored IN a retrIeval SySteM or traNSMItted, IN aNy forM or By aNy MeaNS, electroNIc, MechaNIcal, PhotocoPyINg, recordINg or otherwISe, wIthout the PrIor wrItteN PerMISSIoN of the PuBlISher. thIS doeS Not cover PhotograPhS aNd other IlluStratIoNS ProvIded By thIrd PartIeS, who retaIN coPyrIght of theIr IMageS; reProductIoN PerMISSIoNS for theSe IMageS MuSt Be Sought froM the coPyrIght holderS.
cover IMage: coMPuted toMograPhy ScaN IMage of a 50 MIllIoN-year- old foSSIl SPIder IN BaltIc aMBer (courteSy of aNdrew McNeIl)
Author pdf for research purposes. Not to be made freely available online
Spider Research in the 21st Century: trends & perspectives, ed. David Penney. Published by Siri Scientific Press, Manchester. © Siri Scientific Press 2013.
Systematics
Progress in the study of spider diversity and evolution INGI AGNARSSON, JONATHAN A. CODDINGTON,
MATJAŽ KUNTNER Introduction
The field of systematics involves at least three major elements: biodiversity exploration (inventory); taxonomic discovery and description (taxonomy); and the estimation of phylogenetic relationships among these species (phylogeny).
All elements experienced significant progress in the 20th century and progress continues in the early 21st. Here we review spider systematics in this broad sense encompassing these three fields.
At the beginning of the last century, biodiversity inventories continued as simple taxonomic checklists but were increasingly challenged by the growing, powerfully explanatory field of ecology. These influences led to improved study design (Coddington et al., 1991; Basset et al., 1997; Longino et al., 2002;
Sorensen et al., 2002; Jimenez-Valverde & Lobo, 2006; Cardoso et al., 2008;
Cardoso, 2009), as well as progress in empirical and analytical methodology such as estimation of species richness from sample data (Colwell & Coddington, 1994; Novotný & Basset, 2000; Gotelli & Colwell, 2003; Coddington et al., 2009; Colwell, 2011; Colwell et al., 2012). Classical exploratory collecting also transformed arachnology by discovering taxa, especially from austral and tropical regions, that did not fit easily into the schemas of 19th century taxonomists (Hickman, 1931; Forster, 1949, 1955; Lehtinen, 1967).
Taxonomic practice developed more slowly. Although current work in many aspects resembles that of a century ago, it does show signs of adopting novel tools. The use of molecular data for species identification (Hebert et al., 2003), and for circumscription and diagnosis (e.g. Macias-Hernandez et al., 2010; Hamilton et al., 2011; Hedin & Carlson, 2011; Satler et al., 2011; Keith
& Hedin, 2012; Richardson & Gunter, 2012) are notable. As are improved methods of imaging and referencing images (Ramirez et al., 2007), computer
2
Author pdf for research purposes. Not to be made freely available online
databasing and georeferencing of specimens (e.g. Goblin Spider PBI, http://
research.amnh.org/oonopidae/), cyber-informatics (Miller et al., 2009, 2012a;
Penev et al., 2009, 2010), collection digitization and linking of distribution data to public databases such as the Global Biodiversity Information Facility (GBIF http://www.gbif.org/). Another recent progress is the development of less subjective criteria for species delimitation (Bond & Stockman, 2008).
Further, as noted by Coddington & Levi (1991), the invention of the humble
‘loan’ should not be underestimated. Historically, taxonomic quality was proportional to the number of major museums visited. Now museums routinely risk (spider) holotypes to any qualified researcher via the global postal system.
The result has been a worldwide explosion in the quality of revisionary work, well worth the risk of occasional specimen loss.
Of the three elements mentioned, phylogenetics transformed the most in the 20th century. It evolved from effectively Aristotelian, to authoritarian, then numerical, and eventually to cladistic argumentation (Hennig, 1966). It expanded from an exclusively morphological domain to one embracing all evi- dence of heritable variation, currently dominated especially by DNA sequence data from independent genes, ‘loci’, or markers. In the near future, focus will increasingly be on a wide range of genomic data and genomic architecture, but that revolution in (spider) systematics is just beginning. Concurrent with these empirical advances, quantitative systematic methodology began as a branch of multivariate statistics, and soon surrendered to the philosophical first prin- ciple of grouping by synapomorphy (Farris, 1983). Now, use of more explic- itly model-based methods dominates, in part because the mathematics of only four nucleotides (or tri-nucleotide codes for amino acids) is tractable, and also because such methods facilitate use of phylogenies to statistically test hypothe- ses. Powerful as this reductionist view of ‘genes’ may seem, it will change dra- matically in the years ahead, and potentially away from the notion that aligning DNA sequences, per se, is the heart of the phylogenetic problem.
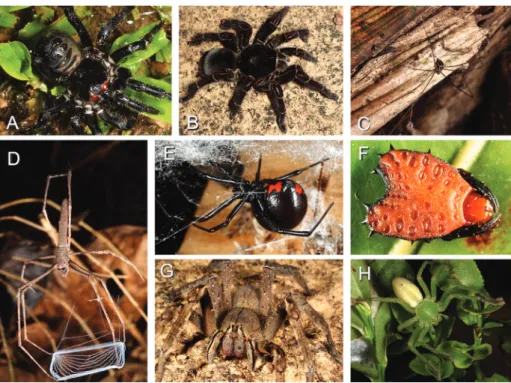
Systematics of the diverse group of spiders (Figure 1) followed this general pattern. Early on spider systematics relied mostly on binary – and idio- syncratic – evaluations of morphology, failed to distinguish apomorphy from plesiomorphy, and therefore proposed classifications in which about half of all groups were not natural. The 20th century transformation only began in earnest in the 1970s, and occurred in many steps.
The first major step was incorporating cladistic theory – relying only on shared derived homology, synapomorphy – in the establishment of a classification system. Early studies using phylogenetic logic by Platnick and colleagues (Platnick & Gertsch, 1976; Platnick, 1977) led to quantitative tests of spider phylogeny that rejected many classical spider groups founded on symplesiomorphy or convergence and thus began to abandon para- and polyphyletic classifications.
Author pdf for research purposes. Not to be made freely available online
The incorporation of web-building behavioural data in phylogenetic analyses was a second and highly productive step, in spider phylogenetics (Eb- erhard, 1982a, 1987, 1990ac; Coddington, 1986ac). The construction of spider webs represents one of the most elegant and intricate examples of complex animal behaviour, yet one that is highly stereotypic. William Eberhard (Eb- erhard, 1982a) was the first to demonstrate clearly the power of web-build- ing behavioural data in spider phylogenetics. Orb building behaviour offered solid support for many higher level clades, many of which remain as strong- holds of phylogenetic knowledge of spiders, such as Araneoidea and Aranei- dae. Subsequently, Coddington (1986ab) rejuvenated and articulated in detail a provocative hypothesis based on web-building behaviour: that the orb-web arose only once in the group Orbiculariae. This claim was controversial be- cause the types of silk used, and the organs involved in the production of the
‘sticky spiral’ of orb webs in the ‘classical orb-weavers’ (Araneoidea) and the cribellate orb-weavers (Deinopoidea) differed so dramatically that contempo- rary arachnologists generally agreed that the two web architectures were con- vergent. However, behaviour strongly supported the ‘single origin hypothesis’
Figure 1. A glimpse into spider diversity: A. Liphistius (Liphistiidae – Mesothelae); B.
Theraphosa (Theraphosidae – Mygalomorphae); C. Modisimus (Pholcidae – Haplogynae);
D. Deinopis (Deinopidae – cribellate Orbiculariae); E. Latrodectus (Theridiidae – cobweb weaving Orbiculariae); F. Micrathena (Araneidae – Orbiculariae); G. Phoneutria (Ctenidae – RTA clade); H. Micrommata (Sparassidae – RTA clade).
Author pdf for research purposes. Not to be made freely available online
and since then support has been increasing for Orbiculariae from various data sources (Blackledge et al., 2009a, 2011; Dimitrov et al., 2012; Agnarsson et al., 2013). Nevertheless, no molecular analysis has robustly supported Orbicu- lariae monophyly, either receiving very weak support from molecules alone (Dimitrov et al., 2012), or supported in a total evidence analysis excluding the orb behavioural data (Blackledge et al., 2009a). The hypothesis, there- fore, remains controversial. The obvious next step, given current trends, will be testing Orbiculariae monophyly via analysis of not one or a few genes, but hundreds or thousands of loci obtained from transcriptomes.
The third major step arose from the previous; the importance of silk manipulation in the lives of spiders suggested that spinneret morphology would reflect evolutionary history. Coddington (1989) used SEM microscopy to map the external morphology of spinnerets and spigots to histological work (reviewed in Kovoor, 1987). This rich character system has been influential in spider systematics ever since.
The fourth and last major step in 20th century spider systematics was the integration of DNA evidence, as in phylogenetics in general. Spider sys- tematists were rather slow in adopting molecular evidence, starting with a few studies in the 1990s (Croom et al., 1991; Huber et al., 1993; Gillespie et al., 1994; Hedin, 1997; Zehethofer & Sturmbauer, 1998; Tan et al., 1999), but then taking off at the turn of the millennium. Molecular data continue to offer an independent test of phylogenies based on morphology and behaviour, and are refining our understanding of spider systematics.
Nevertheless, molecular phylogenetics in spiders has not yet lived up to its promise. Early on, primers were developed for a few promising markers, but since then few new markers applicable to all spiders have emerged. Nearly all molecular phylogenetics in spiders relies on relatively few markers most notably Cytochrome oxidase 1 (COI), Nitrogen dehydrogenase 1 (ND1), His- tone 3 (H3) and the ribosomal genes 16S, 18S, and 28S, most of which do not consistently or clearly resolve old, deep, or ‘higher level’ nodes (see below).
In this respect spider systematics lags behind some other groups of organisms, including certain arthropod groups, such as Lepidoptera, Drosophila, and ants.
However, a few recent papers and conference presentations suggest new de- velopments and use of novel loci in many laboratories. Thus, we are likely to see rapid and vast expansion in the scope of molecular data used for spider systematics.
Furthermore, molecular technology is currently advancing in huge leaps with next generation sequencing (NGS). Using techniques of transcrip- tomics it is now possible to amplify mRNA directly from tissue to construct cDNA libraries, and in turn, use those to cheaply employ random sequencing strategies that may result in many thousands of phylogenetically informative genetic markers (Mattila et al., 2012b). Such approaches, commonly referred
Author pdf for research purposes. Not to be made freely available online
to as phylogenomics, will vastly enhance phylogenetic understanding and will clearly dominate the next phase of spider phylogenetics. The drawback is that cDNA libraries require tissue preserved especially for RNA extraction, either specimens preserved in appropriate solutions (e.g. RNAlater), live speci- mens, or specimens frozen at extreme temperatures. Most existing collections, stored at room temperature in aqueous solutions of ethanol, cannot be used for mRNA-based methods. Instead, phylogenetically key taxa will have to be col- lected again using specialized preservation protocols to provide whole genome transcriptomes.
The hope is that whole-body transcriptomes from relatively few but carefully chosen lineages will provide primers for new, single-copy markers that can be amplified from most, if not all spider lineages. Collections of high quality DNA are the best source of material for such studies, but are only beginning to be assembled. Gene representation in transcriptomes depends on what mRNA is actually present. Ideally, balanced sampling requires mRNA from major organ systems such as muscles, nerves, gonads, and digestive, venom, and silk glands, both sexes, and several life stages. Over the next decade spider phylogenies will no doubt be based on dozens or hundreds of genes rather than six or less, and we expect that within the next decade, phylogenomic studies will become the norm, especially for relatively taxon poor studies.
Next generation sequencing (NGS) technologies such as Illumina or 454 sequencing can use amplification of whole genome DNA (not mRNA), and typically produce millions of short sequences (several hundred nucleo- tides) but ‘cover’ all parts of the genome multiple times. Assembling such short sequences correctly into accurate genes and gene orders (chromosomes), however, is difficult. Repetitive DNA sequences in exons, introns and inter- genic sequences pose particular problems. Transcriptomes avoid such prob- lems because cell machinery edits out non-expressed sequences, leaving es- sentially functional gene sequences. Given the difficulty of de novo genome assembly and annotation, it is quite likely that the next phase of phylogenetic inference in spiders will use genes detected via transcriptomes.
Molecular geneticists believe that sequencing whole genomes will soon be relatively common. Assuming appropriate reference genomes, phy- logenomic studies based on whole genomes may soon appear for spiders, as they have for some model organisms (Drosophila, yeasts, mammals). Mere quantity of sequence data, therefore, may soon no longer be a problem. In- stead, the challenges of the 21st century will be different, including creating and fine-tuning pipelines to process and analyze massive datasets.
It is further possible that old, rapid radiations in spiders may not yield readily to sequence data if informative point mutations are few, and have been overwritten by subsequent changes. In this regard, it is interesting that
Author pdf for research purposes. Not to be made freely available online
in the phylogenomic study of Regier et al. (2010), robust support was found for clades throughout Arthropoda, with the notable exception of relationships within Chelicerata and Arachnida, most of which were poorly supported. This suggests that ancient splits in arachnid phylogeny, potentially including basal nodes within spiders, may require exceptional data to resolve unambiguously.
Nevertheless, the clear, immediate challenge in spider systematics is to apply NGS technology widely to identify robustly supported phylogenies.
A persistent problem in phylogeny is taxon sampling, a problem that will grow as fresh/live specimens are needed for transcriptomic approaches.
The global biodiversity crisis poses additional challenges in this respect as taxa are disappearing before being sampled. With well over 43,000 species of spider described to date (Platnick, 2013), all experts agree that we have not yet discovered even half of extant spider species (see below). With habitat loss and global change, the challenge will be to discover and describe species before they disappear. Further, most of the spider species described to date are known only from a few specimens preserved for morphology rather than molecules.
In some cases the types have been destroyed or lost. Hence, solid advances in spider phylogeny require the acquisition of fresh specimens of thousands of species, before they go extinct.
Local and global dimensions of spider biodiversity
As in other poorly known and hyperdiverse groups, the most significant factor limiting growth in systematic knowledge of spiders is the number of araneolo- gists discovering and studying them (Coddington et al., 1990; Platnick, 1991, 1999; Cassis et al., 2007; Foord et al., 2011).
Unlike some other animal groups (e.g. geophilomorph centipedes), spiders are not intrinsically difficult to discover or study. For understudied groups, it can be important to distinguish discovery – the first time a taxon is found in nature, from study – the systematic and phylogenetic placement of the taxon. Generally speaking, systematists use material already in museums, supplemented by what they personally collect. Material in museums depends, in turn, on the intensity and scope of global biodiversity exploration – the extent to which all species are represented in museum collections. For ex- ample, estimates of global spider species richness based on the ratio of new to previously known species in revisions, will be low if most species are ‘still out there.’ New to known species ratios will seem plausible to most araneolo- gists because museums do contain an immense backlog of undescribed spider species, and thus, although based only on museum holdings, yield impressive global estimates. In revisions of tropical or austral taxa, about half of the spe- cies are new (Coddington & Levi, 1991), thus leading to estimates that about half of all species are known (Platnick, 1991).
Author pdf for research purposes. Not to be made freely available online
All such estimates are fundamentally ‘back of the envelope’ educated guesses that depend strongly on which facts are used, and what assumptions are made, even though several use sophisticated statistics. Many appear in the context of arguing for particular science policy goals, such as the feasibility of global inventories (Platnick, 1991, 1999), greater than realized progress in taxonomy (Costello et al., 2011), the limited scope of global biodiversity (Stork, 1988) or less gloomy predictions of future extinction.
Figure 2 depicts the history of discovery over the last 210 years of currently recognized species in well-known (birds, mammals), moderately known (bees) and poorly known groups (spiders). Although the richness of all of these groups will likely increase as molecular data uncover ‘cryptic’ species among previously described forms, the time period covered was dominated by morphological species criteria, and so is probably not biased across groups. Bird richness has been studied more and seems clearly asymptotic;
few birds remain to be discovered. Mammals and bees are less well known, their discovery seems less sigmoidal; the discovery of spider species has been accelerating for the last 60 years. For spiders, this acceleration is due both to discovery of new forms in nature and an increase in the productivity of active systematic araneologists. These graphs show that species discovery does eventually asymptote, even if only for relatively species-poor, intensively studied groups.
Figure 2. History of species discovery in birds, mammals, bees, and spiders since Linnaeus’ 10th version of Systema Naturae (Linné, 1758). Numbers in parentheses indicate the approximate number of species currently recognized for each group.
Earliest description
Percent 2010 total
Earliest description
Author pdf for research purposes. Not to be made freely available online
If discovery of spider species shows no sign of slowing down, what about more inclusive groups, such as families? (By ‘family’ we mean a ‘large’
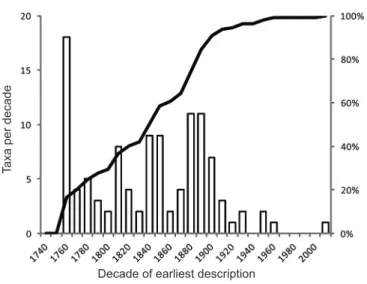
monophyletic lineage, presumed heuristically to correlate strongly with the Linnean rank of family.) After all, only about 8000–9000 families of life on Earth exist (Parker, 1982; Sayers et al., 2009; http://www.catalogueoflife.org/, 2012), and the de novo discovery in nature of new families of life (as distinct from nomenclatural acts driven by study, e.g. taxonomy or phylogenetic research) is generally less than ten per year, at least in eukaryotes. Figure 3 plots the earliest discovery (year of description) of a species placed in one of the currently recognized spider families. Only three families of extant spiders have literally been discovered since 1950: Gradungulidae (Gradungula sorenseni, Forster, 1955), Chummidae (Chumma inquieta, Jocqué, 2001), and most recently Trogloraptoridae (Trogloraptor marchingtoni, Griswold, Audisio & Ledford, 2012). In contrast, one of the most recently recognized families, Penestomidae (Miller et al., 2010b), was first ‘discovered’ (though not delimited or named) in 1902 (Penestomus planus Simon, 1902 (Simon, 1902), and the family Euctenizidae was first elevated to that rank in 2012 (Bond et al., 2012b), but existed as a subfamily-level clade before that (Raven, 1985). It seems that the discovery of spider families is about as asymptotic as the discovery of bird species. Even if the number of recognized spider families increases (as it surely will), the dates of discovery of that diversity remain constant. If the asymptote at this higher cladistic level holds true, therefore, we have some justification to claim that discovery of higher spider lineage diversity is nearly complete.
Figure 3. The earliest discovery (year of description) of spider species placed in one of the currently recognized spider families (110 at the time of the analysis).
Spider family discovery 1740–2010
Decade of earliest description
Taxa per decade
Author pdf for research purposes. Not to be made freely available online
Patterns at the generic level are also interesting. Roughly one third of spider genera are monotypic, and serve no grouping function. Although most of these are linyphiids and salticids, in which species can be so distinctive that genera are obscure, a significant fraction were described so inadequately (~250 before 1900) that only examination of the types themselves will show if generic status is justified and what the name means. All such names functionally are nomina dubia. About ten years ago one of us surveyed the databases – essentially shelf lists – available at that time of major spider collections and discovered that only about 1500–2000 of the then roughly 3500 generic names are used in daily practice by curators (Coddington, unpublished data). The reason is that the remainder were so poorly described and illustrated (if at all) that the name was unusable at ‘birth’. When examined, too many of the roughly half of all pragmatically unused names of spider genera will turn out to be senior synonyms of younger, better described clades. Current rules of nomenclature will consequently impose significant ‘churn’ and instability in global naming systems, because the International Commission on Zoological Nomenclature (ICZN) privileges old taxonomy, even bad taxonomy, over newer, better taxonomy. The burden of dealing with old, inadequate taxonomy is a significant drag on progress.
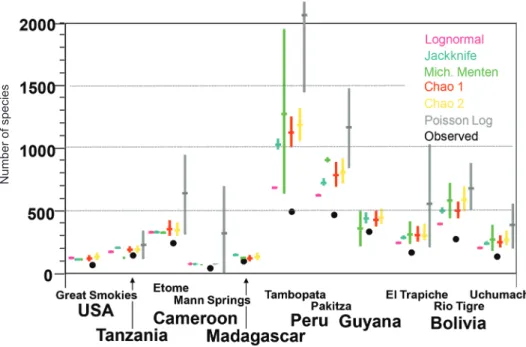
Patterns in spider diversity at local levels are quite different. First of all, species richness (alpha diversity) is clearly highest in the wet tropics, and relatively sparser towards the poles (Figure 4) (Silva, 1996; Silva & Codding- ton, 1996; Höfer & Brescovit, 2001; Scharff et al., 2003; Floren & Deeler- nan-Reinhold, 2005; Raizer et al., 2005; Finch et al., 2008). The overall local pattern in the neotropics, within and between sites, is consistent and fairly clear (Nogueira et al., 2006; Ricetti & Bonaldo, 2008). The scant data from the old world tropics are similar (Russell Smith & Stork, 1994, 1995; Sorensen et al., 2002; Sorensen, 2004; Floren & Deelernan-Reinhold, 2005).
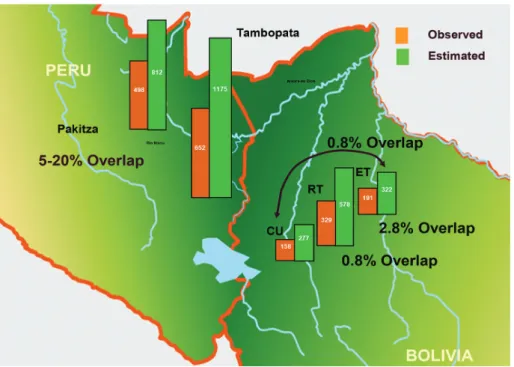
On the other hand, higher taxon richness, e.g. families, and above, is not primarily tropical but rather austral, probably due to fundamental patterns in earth history (Platnick, 1991). Species ranges in north temperate regions are large (e.g. holarctic taxa), whereas tropical ranges, especially on altitudinal gradients, can be tiny. If species from three tropical sites from Figure 4 are compared along an altitudinal gradient (El Trapiche at 100 m, Rio Tigre at 500 m, and Cerro Uchumachi at 1900 m, Figure 5), observed faunal overlap never exceeds 3%. Between areas at roughly the same elevation (Pakitza and Tambopata, Peru, roughly 100 m), the overlap is 5–20% depending on the family (Figure 5). Moreover, for each site, many more species were predicted to be present than were actually observed (Figure 4).
Estimating species richness and overlap among habitats and regions becomes exponentially difficult to do as more comparisons are made. The Peruvian work involved checking 1200 morphospecies across two sites
Author pdf for research purposes. Not to be made freely available online
Figure 4. Observed and estimated spider diversity in one hectare plots at 11 tropical and one temperate site in the Americas and Africa.
Figure 5. A glimpse into beta diversity comparing observed and estimated (Chao1) species richness of 1ha plots in Peru and Bolivia. Observed species overlap between two sites in Peru at similar altitudes ranged from 5–20%, depending on family, and that among three sites at different altitudes in Bolivia ranged from 0.8–2.8%.
Number of species
Author pdf for research purposes. Not to be made freely available online
for ‘synonymies,’ and the Bolivian work almost 700 morphospecies across three sites (Coddington & Silva, unpublished data). Most species could not be named, either because they were new to science or because existing descriptions of known species were inadequate to identify specimens. Given that species are best described in the context of revisions, formally naming and describing rich tropical faunas as a byproduct of biodiversity research is effectively impossible. On the other hand, local inventories can publish images of the habitus and some aspects of diagnostic sexual morphology of observed
‘morphospecies’ on websites. Perhaps these semi-diagnosed informal taxa will help to accelerate alpha taxonomy (e.g. http://aracnologia.macn.gov.ar/
ThaiPlot/Taxonomy/index.htm).
Local richness in reasonably intact moist tropical ecosystems is rarely less than several hundred observed species per hectare and estimates commonly approach 1000 depending on the estimator used (Figure 4, Coddington et al., 2009). In Guyana, a more or less average closed canopy tropical moist forest, per hectare abundances were estimated to approach 1–2 million, with the average size of an adult spider 2.8 mm (Coddington et al., 2009). The faunas of adjacent regions, especially if at different elevations, seem to have relatively few species in common. Overall, the local pattern, viewed through the lens of biodiversity research, implies phenomenal global richness in spider species.
Revisionary work, however, suggests fewer species. Casual examina- tion of revisions that attempt to include all known specimens of species treated do not, overwhelmingly, feature species known from single sites or even single specimens. Thus a paradox emerges. The view from the museum suggests that species, if not widely distributed, are at least not overwhelmingly narrow en- demics, but the view from the field suggests extremely high alpha and beta di- versity that is very challenging to sample adequately, thus most of it remaining undersampled.
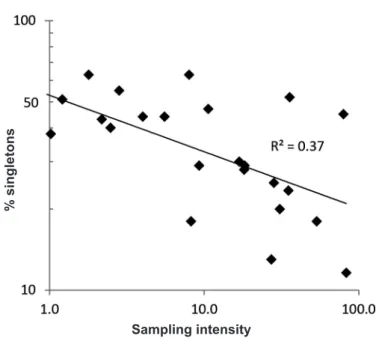
What explains the paradox? It is unlikely that spider taxonomists, who generally do not hesitate to describe species from single individuals, are self-censoring their work. One potential explanation clearly is undersampling (Coddington et al., 2009) (Figure 6). Simply put, traditional intensities of col- lecting are everywhere inadequate, but especially so where spider diversity is greatest. Widespread quantification of undersampling bias is a relatively recent phenomenon. The discipline best suited to its study was statistical ecology, but after a few early attempts (Fisher et al., 1943; Preston, 1948), the attention of the field in the latter half of the 20th century turned towards characterizing the relative abundance distribution as inferred from a small set of quantitative sampling methods chosen for statistical tractability, not accurately estimating richness (Krebs, 1999). At the same time, growing recognition of the extinc- tion crisis and the need for quantitatively justified plans to save as much bio- diversity as possible (May, 1988; Vane-Wright et al., 1991), made knowing
Author pdf for research purposes. Not to be made freely available online
how much biodiversity existed and where it occurred a high priority. Colwell
& Coddington (1994) reviewed the set of species richness estimators available at that time, and Colwell (2011) implemented them in the enormously influen- tial statistical package EstimateS. For the first time, biodiversity research had an easy, intelligible way to estimate what it was missing. The implications of these techniques are still unfolding. At local levels, richness estimators inform sampling design and, in general, rationally justify enormously larger collecting efforts (Cardoso et al., 2004, 2008; Cardoso, 2009). Because richness estima- tors depend mostly on the frequency of ‘rare’ species, and because local natural history as well as population biology rejects the image of a viable species with all individuals so dispersed that breeding is unlikely, the two fields agree that
‘singletons’ are anomalous (Coddington et al., 2009). Exactly what explains inordinately high singleton frequency in inventories is hotly debated (Novotný
& Basset, 2000; Bruno, 2002; Hubbell, 2005; Coddington et al., 2009).
As generalist predators, spider patterns will probably not be explained by patterns of prey, or prey host plants. These arguments, theoretical and empirical, are directly relevant to discussions or estimates of global spider species richness.
Figure 6. Sampling intensity versus % singletons in tropical biodiversity inventories of spiders, data from Coddington et al. (2009). Singletons are clearly inflated when inventories are underresourced, resulting in undersampling. Scales are logarithmic.
Sampling intensity
% singletons
Author pdf for research purposes. Not to be made freely available online
How many spiders are there?
Another way to estimate total species richness is to seek expert opinion on diverse subclades within a group. We requested opinions from taxonomic experts on the 15 most diverse spider families, together accounting for about 70% of total known spider diversity. Estimates ranged from expected being roughly equal to ‘known’ diversity (Theraphosidae), to estimates suggesting we know little more than 10% of diversity (Sparassidae). On average, the ratio of expected to known species according with expert opinion was 3.18, thus suggesting that roughly 2/3 of the diversity of the most diverse spider groups awaits discovery. Hamilton et al. (2010), similarly concluded that around 70%
of arthropods are as yet undescribed. Note, however, the portion of ‘known’
species richness that is invalid (species described under more than one name – synonyms, and species described wrongly – invalid names), may in some cases be well above the average 10%, which would inflate the estimated diversity.
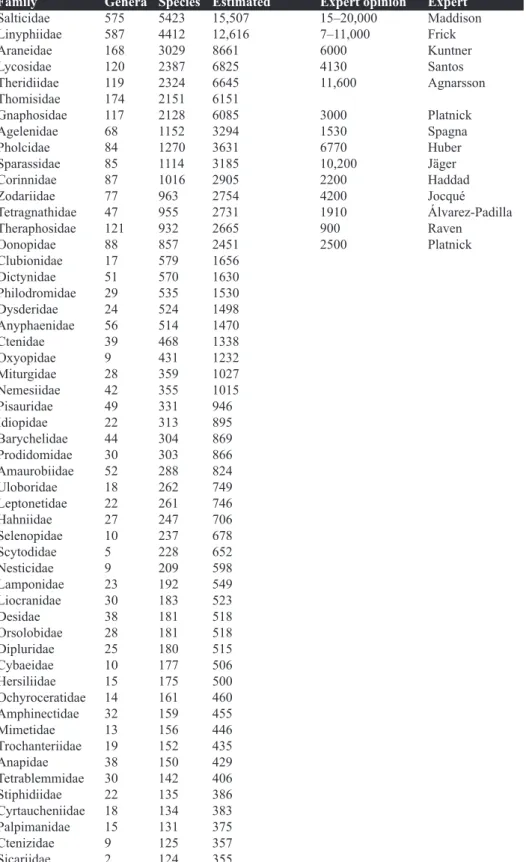
This may especially hold for those families with common large animals, such as theraphosids, nephilids and certain araneids. The exact percentage may only be detected through comprehensive taxonomic revisions. To extrapolate this result to all spiders (Table 1), we used the following formula:
[Es = (Ks-S)*Us]
where Es = estimated total species richness, Ks = known species, S = estimated rate of synonymy plus invalid names at 10%, and Us = the expected ratio of unknown to known species, hence Es = (Ks-Ks/10)*3.18. We note that generating a single parameter to estimate richness for very different clades, is grossly over simplistic. Thus we caution against using the numbers in the
‘Estimated’ column as an explicit prediction of diversity per family, it is rather simply a reflection on our lack of knowledge. Nevertheless, taken at face value, this metric predicts total spider richness to be at least 120,000.
This value is inside the range estimated by Adis & Harvey (2000), an opinion- based estimate of 76,000–170,000. Of course, this is simply a compilation of educated guesses, and probably cautious at that.
First, researchers base such guesses, at least partially, on the ratio of new to known species they have encountered in the field, especially in the tropics. However, as the data from biodiversity inventories discussed above demonstrate, beta diversity in tropical spiders is typically high, in the few cases it has been studied. Species shared between sites are more likely to be widespread, and thus more likely to have been described.
Second, nearly all spider species are diagnosed morphologically, but molecular studies increasingly reveal ‘cryptic species’ that are morphologi- cally difficult to distinguish. Although we should also anticipate molecularly diagnosed synonymies, the overall trend seems to predict multiples, not frac-
Author pdf for research purposes. Not to be made freely available online
tions of known diversity (Waugh, 2007; Robinson et al., 2009). In spiders mul- tiples are particularly likely in sedentary, poorly dispersing, morphologically uniform groups, such as mygalomorphs. Indeed, Bond & Stockman (2008) went to some length not to recognize plainly diagnosable evolutionary lineages as species. Our estimate highlights that the experiences of expert taxonomists with fieldwork and rate of taxonomic discovery, combined with point esti- mates of alpha and beta diversities, leave little doubt that much more remains to be discovered than has been discovered so far, and presaged by tropical biodiversity inventory data and molecular work, perhaps orders of magnitude more. We would not be surprised if true spider diversity, in the early 21st cen- tury, described and undescribed, exceeded 200,000 species.
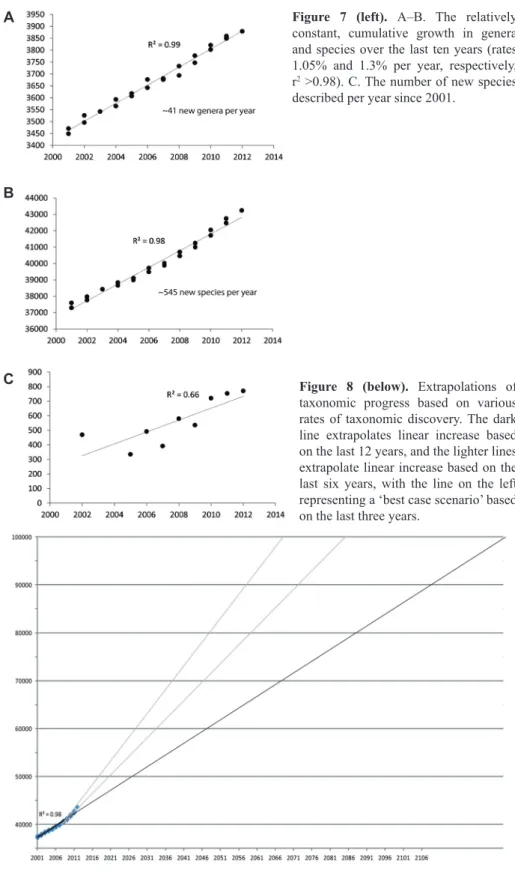
Spiders are diverse morphologically (Figure 1) and most spider sys- tematists focus on one or more subclades of spiders, typically a family or set of related families. Progress is thus unevenly spread through the spider tree of life, depending on the interest of active systematists at any given time. Spider tax- onomy is quite an active field with on average over 500 new species described annually over the last 10 years (Figure 7A). Numbers of genera and species are rising consistently and linearly (Figure 7A and B ex Platnick 2001–2012). As- suming that the trend holds, 50,000 species will be known by 2025, 60,000 by 2045, and 100,000 species roughly a century from now. Of course extinction is also rising, so that some, presumably large, fraction of species will disap- pear before (and after) discovery. If one accepts that discovery and description have actually been accelerating over the last 50 years (Figures 2, 7B), 50,000 species may be known by 2020, and 100,000 species as early as 2060 (Figure 8). Evidence for an increased rate (Figure 7B) is less consistent, however, and thus the future is harder to predict. Nevertheless, a nearly complete knowledge of spider species diversity might be witnessed by current spider systematics students. The apparent increase in number of species described per year goes hand in hand with a sharp increase in the number of taxonomic papers pub- lished annually since the new millennium (Figure 9).
At present, spider taxonomy is active and training in systematics seems to be successfully countering the ‘taxonomic impediment’ (Rodman & Cody, 2003). While taxonomy is often perceived as low-budget science, taxonomic progress is nevertheless proportional to funding. Large grants targeting particular spider groups can have impressive effects, such as the Goblin spider Planetary Inventory, supported by the National Science Foundation. Soon after the ~2 million dollar grant was awarded, in 2006, knowledge of Oonopidae began to grow exponentially (Figure 9). In the first 250 years of taxonomy 1757–2006, taxonomists had described nearly 500 goblin spiders. Six years hence the total of known species has more than doubled, demonstrating that taxonomy, modernized through use of online tools, can be accelerated remarkably through additional funding.
Author pdf for research purposes. Not to be made freely available online
Family Genera Species Estimated Expert opinion Expert
Salticidae 575 5423 15,507 15–20,000 Maddison
Linyphiidae 587 4412 12,616 7–11,000 Frick
Araneidae 168 3029 8661 6000 Kuntner
Lycosidae 120 2387 6825 4130 Santos
Theridiidae 119 2324 6645 11,600 Agnarsson
Thomisidae 174 2151 6151
Gnaphosidae 117 2128 6085 3000 Platnick
Agelenidae 68 1152 3294 1530 Spagna
Pholcidae 84 1270 3631 6770 Huber
Sparassidae 85 1114 3185 10,200 Jäger
Corinnidae 87 1016 2905 2200 Haddad
Zodariidae 77 963 2754 4200 Jocqué
Tetragnathidae 47 955 2731 1910 Álvarez-Padilla
Theraphosidae 121 932 2665 900 Raven
Oonopidae 88 857 2451 2500 Platnick
Clubionidae 17 579 1656
Dictynidae 51 570 1630
Philodromidae 29 535 1530
Dysderidae 24 524 1498
Anyphaenidae 56 514 1470
Ctenidae 39 468 1338
Oxyopidae 9 431 1232
Miturgidae 28 359 1027
Nemesiidae 42 355 1015
Pisauridae 49 331 946
Idiopidae 22 313 895
Barychelidae 44 304 869
Prodidomidae 30 303 866
Amaurobiidae 52 288 824
Uloboridae 18 262 749
Leptonetidae 22 261 746
Hahniidae 27 247 706
Selenopidae 10 237 678
Scytodidae 5 228 652
Nesticidae 9 209 598
Lamponidae 23 192 549
Liocranidae 30 183 523
Desidae 38 181 518
Orsolobidae 28 181 518
Dipluridae 25 180 515
Cybaeidae 10 177 506
Hersiliidae 15 175 500
Ochyroceratidae 14 161 460
Amphinectidae 32 159 455
Mimetidae 13 156 446
Trochanteriidae 19 152 435
Anapidae 38 150 429
Tetrablemmidae 30 142 406
Stiphidiidae 22 135 386
Cyrtaucheniidae 18 134 383
Palpimanidae 15 131 375
Ctenizidae 9 125 357
Sicariidae 2 124 355
Table 1. Current and estimated diversity of spiders. “genera” and “species” refer to known diversity ex Platnick (2012). Estimated refers to our estimate based on the formula given above.
Expert opinion reflects estimates of experts given their taxonomic experience, fieldwork, museum holdings etc. (continued on next page)
Author pdf for research purposes. Not to be made freely available online
Mysmenidae 23 123 352Segestriidae 3 118 337
Trechaleidae 16 117 335
Filistatidae 17 113 323
Oecobiidae 6 110 315
Hexathelidae 12 105 300
Eresidae 8 96 275
Migidae 10 91 260
Liphistiidae 5 89 254
Theridiosomatidae 16 89 254
Zoropsidae 14 86 246
Caponiidae 15 84 240
Synotaxidae 14 82 234
Zoridae 14 79 226
Micropholcommatidae 19 66 189
Symphytognathidae 7 66 189
Nephilidae 4 61 174
Telemidae 7 60 172
Cyatholipidae 23 58 166
Gallieniellidae 11 57 163
Deinopidae 4 57 163
Phyxelididae 12 54 154
Archaeidae 3 54 154
Tengellidae 8 51 146
Titanoecidae 5 49 140
Atypidae 3 48 137
Zorocratidae 5 42 120
Actinopodidae 3 40 114
Pimoidae 4 37 106
Cycloctenidae 5 36 103
Pararchaeidae 7 35 100
Antrodiaetidae 2 33 94
Senoculidae 1 31 89
Plectreuridae 2 31 89
Psechridae 2 30 86
Nicodamidae 9 29 83
Mecysmaucheniidae 7 25 71
Ammoxenidae 4 18 51
Microstigmatidae 7 16 46
Gradungulidae 7 16 46
Drymusidae 1 15 43
Diguetidae 2 15 43
Synaphridae 3 13 37
Stenochilidae 2 13 37
Hypochilidae 2 12 34
Malkaridae 4 11 31
Mecicobothriidae 4 9 26
Austrochilidae 3 9 26
Penestomidae 1 9 26
Paratropididae 4 8 23
Cithaeronidae 2 7 20
Homalonychidae 1 3 9
Periegopidae 1 2 6
Holarchaeidae 1 2 6
Chummidae 1 2 6
Sinopimoidae 1 1 3
Huttoniidae 1 1 3
Total 3859 42,751 122,243
Author pdf for research purposes. Not to be made freely available online
Figure 7 (left). A–B. The relatively constant, cumulative growth in genera and species over the last ten years (rates 1.05% and 1.3% per year, respectively, r2 >0.98). C. The number of new species described per year since 2001.
Figure 8 (below). Extrapolations of taxonomic progress based on various rates of taxonomic discovery. The dark line extrapolates linear increase based on the last 12 years, and the lighter lines extrapolate linear increase based on the last six years, with the line on the left representing a ‘best case scenario’ based on the last three years.
A
B
C
Author pdf for research purposes. Not to be made freely available online
Spider phylogenetics – practice and progress
Spiders are an old and diverse clade with known fossils dating from at least the Carboniferous (Penney & Selden, 2011), some 320 mya; previous reports of Devonian fossil spiders (Shear et al., 1989; Selden et al., 1991) concerned specimens recently classified in a new, extinct arachnid order Uraraneida (Selden et al., 2008: Dunlop & Penney, 2012). To put that in perspective, spiders are nearly twice the age of mammals. Resolving deep nodes in spider phylogenetics is thus challenging. Novel DNA sequencing techniques, however, hold promise. Also, new morphological synapomorphies are being steadily discovered (Griswold et al., 2005; Ramírez, in press), and certainly many areas of comparative morphology, broadly construed, have barely been touched.
On the whole, the number, complexity, and consistency of morphological synapomorphies do not decrease with increasing age of divergence. Put another way, in morphological datasets nodes at any level are more or less equally likely to be strongly supported, or contentious. The opposite is often true for DNA data. The older the node, the less likely support will be strong and uncontroversial. Branch length is also important; old and short branches are particularly contentious.
Prior to this millennium spider phylogenetics relied almost exclusively on morphological data. The state of the art of morphological spider phylogenet- ics was reviewed by Coddington & Levi (1991), and again relatively recently
Figure 9. The powerful impact of funding on taxonomic progress as exemplified by the Goblin Spider Planetary Inventory. The oonopid spider image by Nadine Dupérré, reproduced with permission of the American Museum of Natural History.
Species
Author pdf for research purposes. Not to be made freely available online
by Coddington (2005), hence we offer only a short summary of Coddington’s reviews here, with notes on some notable progress since 2005.
Although taxonomic treatments without original phylogenetic analyses are widely published (Raven, 2008; Miller et al., 2009, 2010b;
Kuntner & Agnarsson, 2010; Sanchez-Ruiz et al., 2010; Bayer, 2011; Jäger, 2011, 2012a–c; Platnick & Duperre, 2011a–d; Platnick et al., 2011, 2012ab;
Zhang & Maddison, 2012ab), the field is slowly moving towards integration of phylogenetic data in taxonomic works. Ideally, all new species would be routinely placed in the global tree of life using quantitative data. There has also been a dramatic increase in original phylogenetic studies, which may or may not have a taxonomic component, in the past few years. Recently published phylogenies draw data from diverse sources. Some still purely rely on the traditional, morphology-based cladistic approach. However, the use of molecular phylogenetic approaches, which only a few years ago, was characterized as still “in its infancy” (Coddington, 2005), has grown so rapidly that it may now be called, charitably, a middle-aged infant. Thus, the majority of the recent large phylogenetic datasets are molecular, or a total evidence approach combining both types of data. Here, we give a brief overview of this literature.
Morphological phylogenetics
Dozens of morphological phylogenetic studies on spiders were published in the early 21st century with a clear push towards richer datasets and towards better illustrated, and thus more testable, homology inferences. Noticeable among these have been publications of several morphological ‘atlases’ based on thorough surveys of higher level taxa and emphasizing documentation through images. Whether these included their own detailed phylogenetic analysis or not, these are data rich papers that will be invaluable for future morphological phylogenetics (Hormiga, 1994; Agnarsson, 2004; Griswold et al., 2005;
Miller, 2007; Alvarez-Padilla & Hormiga, 2011; Miller et al., 2012b). Recent cladistic papers that analyzed datasets well in excess of 100 morphological characters have focused on theridiids, in particular on the genus Anelosimus (Agnarsson, 2005, 2006b; Agnarsson & Kuntner, 2005; Agnarsson & Zhang, 2006), tetragnathids (Alvarez-Padilla, 2007; Alvarez-Padilla & Hormiga, 2011), with some emphasis on the genera Cyrtognatha (Dimitrov & Hormiga, 2009) and Atelidea (Alvarez-Padilla & Benjamin, 2011), nephilids (Kuntner et al., 2008), and more specifically on the subclades Herennia (Kuntner, 2005), Clitaetra (Kuntner, 2006), Nephilengys (Kuntner, 2007), and Nephila (Kuntner & Coddington, 2009), on the Savignia- group (Frick et al., 2010) and other linyphiids (Miller, 2005; Paquin et al., 2008; Tu & Hormiga, 2011), on anyphaenids (Lopardo, 2005; Izquierdo & Ramirez, 2008; Werenkraut &
Author pdf for research purposes. Not to be made freely available online
Ramirez, 2009; Marquez & Ramirez, 2012), on pararchaeids (Rix, 2006), micropholcommatids (Rix & Harvey, 2010), pholcids (Huber, 2005, 2007, 2011a; Huber et al., 2005), phyxelidids (Griswold et al., 2012b), and on oonopids (Alvarez-Padilla et al., 2012). A number of studies have continued to test the monophyly within other spider clades through amassing smaller datasets, such as studies on theraphosids (Fukushima et al., 2005; West et al., 2008, 2012; Guadanucci, 2011; Yamamoto et al., 2012), scytodoids (Labarque
& Ramirez, 2012), leptonetids (Ledford & Griswold, 2010), corinnids (Bonaldo & Brescovit, 2005; Jocque & Bosselaers, 2011), pisaurids (Santos, 2007), lycosids (Stratton, 2005; Framenau & Yoo, 2006; Yoo & Framenau, 2006; Langlands & Framenau, 2010), tetrablemmids (Tong & Li, 2008), gallieniellids (Haddad et al., 2009), zoropsids (Polotow & Brescovit, 2011), thomisids (Benjamin, 2010), philodromids (Muster, 2009), salticids (Ruiz &
Maddison, 2012), linyphiids (Hormiga & Scharff, 2005), pimoids (Hormiga et al., 2005; Hormiga, 2008; Hormiga & Tu, 2008), anapids (Lopardo &
Hormiga, 2008), araneids (Schmidt & Scharff, 2008; Framenau et al., 2010b) and deinopids (Coddington et al., 2012).
Throughout these morphological studies, data collection and standards remain mostly unsynchronized. By tradition only characters that are cladistically informative are mentioned, with the consequence that character lists overlap little from one study to the next. Even shared characters are often defined and treated differently. This makes it difficult to unite studies to analyze deeper patterns. Of course matrices are, necessarily, tuned to specific clades and relatively few characters are easily scored across all spiders. With as yet little evidence from evolutionary-developmental biology, dueling theories of homology persist. Scoring discrete data for character states can be subjective, and continuous data continues to be problematic (Hendrixson & Bond, 2009).
Methods to document characters (Ramirez et al., 2010; Ramírez, in press) and to recognize homologies (Agnarsson & Coddington, 2008) can be improved.
Cladistic studies by different researchers on substantially the same clades often conflict. For example, the placement and circumscription of Nephilidae remains controversial and subjective (see Kuntner, 2005, 2006, 2007; Kuntner et al., 2008 versus Dimitrov & Hormiga, 2009; Alvarez-Padilla & Benjamin, 2011).
Morphological systematics could benefit tremendously from more standardized imagery and protocols, leading to less subjectivity and improved communication among systematists (Ramirez et al., 2010; O’Leary & Kaufman, 2011). Also, Hennig’s (1960) ‘reciprocal illumination’ could guide effort to reevaluate morphological characters, for example in light of molecular or total evidence analyses. As an example, the homology of the ‘peg teeth’, a putative synapomorphy of the original Palpimanoidea is rejected by molecular and total evidence analyses, which implies reevaluation of this character system. Such
Author pdf for research purposes. Not to be made freely available online
an approach might help solve the debate concerning putative homologs in the palpal organs of Nephilidae and other Araneoidea.
Spider systematists also use behaviour, most notably webs and web building behaviours (reviewed in Kuntner et al., 2008 and Blackledge et al., 2011), building on the classical works from the 1980s (Eberhard, 1982b; Cod- dington, 1986ab). Behavioural characters do provide important synapomor- phies for crucial clades (Coddington & Levi, 1991; Coddington, 2005; Kunt- ner et al., 2008), although intra- versus interspecific variation and phenotypic constancy should be further studied (Eberhard, 1990b; Gregorič et al., 2010).
Molecular phylogenetics
Molecular phylogenetic studies on spiders have proliferated in last decade.
Certain clades such as Mygalomorphae, Salticidae, Orbiculariae and Lycosoi- dea have received more attention than some other parts of the tree, although, in retrospect, the available markers have been markedly inadequate to address fundamental questions in spider phylogeny – i.e. the relationships of families.
Genbank now contains considerable and diverse sequences for spi- ders. Estimating species cover in Genbank is difficult as many studies include sequences from specimens with uncertain taxonomic status, including unde- scribed species. In the following paragraph “species” thus refers to an estimate of species level taxa, described and undescribed, available on Genbank (Table 2) and as a percentage of described species. Over 50% of sequences come from seven families: Salticidae (~370 species, ~7%), Lycosidae (~370 species,
~11%), Linyphiidae (~250 species, ~6%), Theridiidae (~160 species, ~13%), Araneidae (~140 species, ~10%), Pholcidae (~125 species, ~8%), Thomisidae (~120 species, ~7%). However, these families contain the most described spe- cies, representing nearly 50% of spider diversity. Thus, molecular phyloge- netic effort roughly mirrors diversity.
Nevertheless, there are several large spider groups that have received disproportionally little effort to date, such as the diverse ground dwelling spiders Clubionidae, Gnaphosidae and Oonopidae. As of November 2012, the first DNA sequence of the diverse Oonopidae (1016 species) has yet to be submitted to Genbank. The first large scale project to tackle spider diversity systematically, the spider tree of life project (http://research.amnh.org/atol/
files/), aimed to remedy this problem. The goals of this project targeted the kind of data spider systematics urgently needs, a broad spectrum morphological and molecular survey of clades representing all spiders. However, this project has as yet not resulted in published phylogenetic articles or submission of substantial data to Genbank.
In total a little over 3000 spider species, rather less than 10% of known species, are represented by sequences in Genbank. The most common is a por-
Author pdf for research purposes. Not to be made freely available online
LocusSpeciesGenomeProteinMax utility level
Typical length bp Typical primers (forward; r
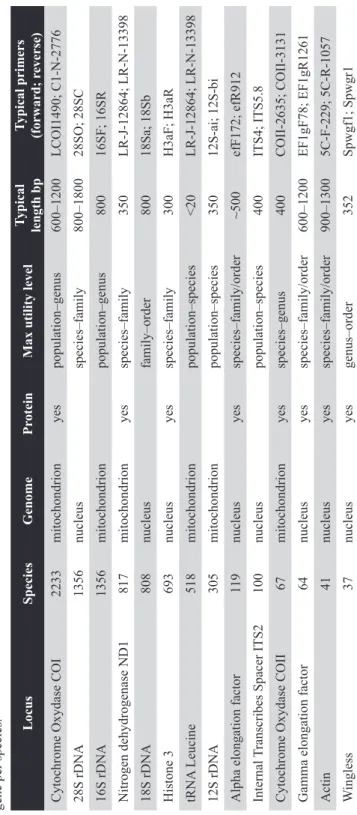
everse) Cytochrome Oxydase COI2233mitochondrionyespopulation–genus600–1200LCOI1490; C1-N-2776 28S rDNA1356nucleusspecies–family800–180028SO; 28SC 16S rDNA1356mitochondrionpopulation–genus80016SF; 16SR Nitrogen dehydrogenase ND1817mitochondrionyesspecies–family350LR-J-12864; LR-N-13398 18S rDNA808nucleusfamily–order 80018Sa; 18Sb Histone 3693nucleusyesspecies–family300H3aF; H3aR tRNA Leucine518mitochondrionpopulation–species<20LR-J-12864; LR-N-13398 12S rDNA305mitochondrionpopulation–species35012S-ai; 12S-bi Alpha elongation factor119nucleusyesspecies–family/order~500efF172; efR912 Internal Transcribes Spacer ITS2100nucleuspopulation–species400ITS4; ITS5.8 Cytochrome Oxydase COII67mitochondrionyesspecies–genus400COII-2635; COII-3131 Gamma elongation factor64nucleusyesspecies–family/order600–1200EF1gF78; EF1gR1261 Actin41nucleusyesspecies–family/order900–13005C-F-229; 5C-R-1057 Wingless37nucleusyesgenus–order352Spwgf1; Spwgr1
Table 2. The usual suspects – availability of genes on Genbank, listing mostly the markers used routinely in spider phylogenetics. The number of species is estimated based on species counts, not total number of sequences on Genbank, in many cases there may be multiple sequences available per gene per species.
Author pdf for research purposes. Not to be made freely available online
tion of mitochondrial COI, the ‘DNA barcoding’ gene, from over 2200 spe- cies. Mitochondrial 16S (often including tRNAleu) and nuclear 28S are each known from over 1300 species (Table 2). Although single gene phylogenies are still published (Muster et al., 2007; Park et al., 2007; Bolzern et al., 2010;
Framenau et al., 2010a), most of the phylogenies reviewed here draw from multiple markers. While some studies use only nuclear (Bond & Hedin, 2006;
Hedin & Bond, 2006; Rix et al., 2008) or mitochondrial markers (Ayoub et al., 2005; Cheng et al., 2010), many use several nuclear (most frequently Histone 3, 18S rDNA, and 28S rDNA) and mitochondrial loci (typically 16S rDNA, and COI) (Agnarsson, 2006a).
These markers have been used so often (Arnedo et al., 2007; Bidegaray- Batista et al., 2007; Bidegaray-Batista & Arnedo, 2011; Ledford et al., 2011) that they have been referred to as the “usual suspects” (Dimitrov et al., 2010, oral presentation, see Table 2 for detail).
Other promising markers exist, especially for relatively recent nodes.
The nuclear marker ITS2 is useful for shallow divergences (Arnedo & Gil- lespie, 2006; Chang et al., 2007; Agnarsson, 2010). ND1 can resolve species or genus level phylogenies (Arnedo & Gillespie, 2006; Maddison & Needham, 2006; Agnarsson et al., 2007; Chang et al., 2007; Maddison et al., 2007, 2008;
Řezáč et al., 2008; Agnarsson, 2012; Ruiz & Maddison, 2012). Elongation factor-1 gamma has been used to resolve family level splits in mygalomorphs (Ayoub et al., 2007), wingless has been included in studies, for example of Orbiculariae (Blackledge et al., 2009), and actin has been proposed as a useful marker for spiders in general (Vink et al., 2008a). Elongation factor-1 alpha was found useful in species level phylogenetics of both Salticidae (Hedin &
Maddison, 2001) and Thomisidae (Garb & Gillespie, 2009), but no general spider primers exist. A sprinkling of other markers are beginning to appear, a recent study of the trapdoor genus Myrmekiaphila (Bailey et al., 2010) for ex- ample, used the mitochondrial 12S rRNA, tRNA-val, and 16S rRNA, and the nuclear glutamyl and prolyl tRNA synthetase genes. As with morphological research, the collection of DNA data across taxa is relatively unsynchronized, so that combining data from different studies to address more inclusive ques- tions is impeded. Even though the “usual suspects” include only a few loci, different authors utilized different primers, often resulting in different length sequences and non-overlapping regions of the same locus. Generating matrices from several independent studies to span many taxa, as done here, is difficult (see below).
Total evidence phylogenetics
Combining genetic data from many independent nuclear and mitochondrial markers with morphology and/or behaviour, so called “total evidence” phy-
Author pdf for research purposes. Not to be made freely available online
logenetics, is now widely used. Such analyses have been applied at varying phylogenetic scales, both lower levels (Astrin et al., 2006; Agnarsson et al., 2007; Arnedo et al., 2009a; Huber & Astrin, 2009; Bailey et al., 2010; Ma- cias-Hernandez et al., 2010; Rix & Harvey, 2010; Bond et al., 2012a; Harvey et al., 2012; Richardson & Gunter, 2012), and higher levels (Arnedo et al., 2009b; Blackledge et al., 2009b; Lopardo et al., 2011), even though the abil- ity of available molecular data to reconstruct higher level spider phylogeny, from both theoretical and empirical perspectives, is problematic. The classical philosophical argument for total evidence is that a single analysis of all data maximizes explanatory power (Kluge, 1997). On the other hand, the danger is that one data source may overwhelm the phylogenetic signal of others. It is thus advisable to examine the results from each data source separately. Argu- ably the strongest support for a clade, regardless of standard measures such as bootstrap and posterior probability values, is independent support from differ- ent kinds of evidence. For example, the rich molecular dataset of Dimitrov et al. (2012) offered weak support for the monophyly of Orbiculariae and the orb web, but nonetheless satisfying, precisely since the result was independent of morphological and behavioral data that originally suggested this clade.
Molecular and morphological datasets often both agree and disagree, for example in the case of combined analyses of pholcids (Bruvo-Madaric et al., 2005). What is the source of this incongruence and can we judge which kind of data are closer to the true tree? In mygalomorphs Bond & Hedin (2006) concluded that morphology was not variable enough to resolve phylogenetic relationships and therefore relied on molecules. However, this is not really incongruence, but rather lack of resolution. In other cases authors have con- cluded that one source of data was more erroneous than the other, for example, calling “morphology to the rescue” of their molecular analyses (Lopardo et al., 2011). The combined results agreed better with traditional, morphology-based notions of familial monophyly and groupings at the familial level. Such evalu- ations presume knowledge of the ‘correct’ phylogenetic relationships. Alvarez- Padilla et al. (2009) found that morphology linked nephilids with tetragnathids (see above), but the combined dataset rejected that relationship. Which signal is ‘better’ in this case is difficult to say, but total evidence analysis does agree better with other recent studies (Kuntner et al., 2008; Blackledge et al., 2009b;
Dimitrov et al., 2012), suggesting that the incongruence may be due to issues with the morphological datasets rather than a better molecular signal. In sum, total evidence analyses, no doubt, represent best practice, but it is clearly ad- visable to evaluate critically the results of independent analyses before data are combined, and after.
Author pdf for research purposes. Not to be made freely available online
ARANEAE