Analyzing Malawi’s Sluggish Agriculture Production and Productivity:
An O – Ring Theory Approach A Working Paper Series
by
Mateso Kazembe
(Ministry of Economic Planning and Development)
Disclaimer
The views expressed in this paper are solely mine and though I am an employee of the Ministry of Economic Planning and Development, the views in this paper do not reflect in any way those of my employer.
Abstract
The agriculture sector in Malawi has consistently been plagued with low productivity and under – production to an extent that the agriculture led economic growth since 2005 to 2013 has not translated to poverty reduction as trickle – down economics prescribe. Kremer’s (1993) O – Ring Theory of Production is used to analyze why this is the case. Using a model of sequential production, where final value of agriculture production depends on the successful completion of all tasks, it is demonstrated that Malawi agriculture underachieves due to the prevalence of mistakes in the delivery of some of the tasks involved in agricultural production which in turn affect the value of final output.
Acknowledgements
Table of Contents
Abstract ... 2
Acknowledgements... 3
List of Figures ... 5
List of Tables ... 6
1. Introduction ... 7
2. Literature Review ... 12
2.1 Empirical Literature on Agriculture Productivity ... 15
3. The Model and Its Application to Malawi Agriculture Sector ... 17
3.1 How the Model Applies to Agriculture Sector in Malawi ... 21
4. DISCUSSION ... 29
5. CONCLUSION ... 32
6. REFERENCES ... 33
26. APPENDICES ... 36
Appendix 1: Agriculture Technologies used by Malawian Farmers ... 36
Appendix 2: Simulations of the O – Ring Theory ... 37
Appendix 3: Trends in Agriculture Spending ... 39
List of Figures
Figure 1: Cereal Production 1960 - 2005 ... 23 Figure 2: Cereal Yield per Hectare (Kgs) for Different Regions ... 24
List of Tables
Table 1: 2007 Malawi Census of Agriculture and Livestock Selected Indicators ... 25
Table 2: 2005 - 2010 Proportion of Agriculture Budget Allocated to Agriculture Subsidy... 27
Table 4: Agriculture Technologies used by Malawian Farmer ... 28
Table 5: Summary of the Simulations ... 37
Table 6: Trends in Agriculture Sector Spending 1970 - 2005 ... 39
1. Introduction
Malawi has a very large rural sector, which accounts for 85% of the entire population and relies heavily on the agricultural sector as a source of livelihood.1 The poverty level for the rural sector has worsened slightly from 55.9% in 2005 to 56.6% in 2011.2 This has happened despite a consistent economic growth rate of 7% on average within the same period, largely driven by the agriculture sector, from which the rural sector is largely dependent on.
As the trickle – down theory in economics predicts, the rural sector would have been a major beneficiary from the agriculture led growth, as argued by Hoekman et.al (2001) who stated that “…the poor are likely to benefit from growth if such growth occurs in sectors in which a large proportion of the poor actively participate and derive their livelihoods…”3 and Agricultural Economist, John Mellor (1966), who indicated in his seminal work on ‘The Economics of Agriculture Development’ that
“…agriculture development has potential to increase welfare because large proportions of the population engage in farming…”4
Nonetheless, the story for the Malawi’s rural sector is different. Even though Doward & Chirwa (2011) found that the agriculture input subsidy that the Government of Malawi (GoM) launched in 2005 through 2011 raised the production of maize by between 25% to 60%, evidence shows deteriorating rural poverty.5 Chirwa et al (2008) argues, in a paper exploring the linkages between agriculture growth and poverty reduction, that for the Malawi economy, whose performance is largely driven by
1National Statistics Office (NSO), The Malawi Population and Housing Census Main Report, (Zomba: Government Print, 2008), 8.
2 NSO. The Third Integrated Household Survey Report, (Zomba: Government Print, 2011), 111.
3 Bernard Hoekman et.al., “Trade Policy Reform and Poverty Alleviation.” World Bank Working Papers #2733 (2001):8
4 John Mellor, The Economics of Agricultural Development, (New York: Cornell University, 1966), 11.
5 Andrew Doward & E.W. Chirwa, “The Agricultural Input Subsidy Programme 2005-6 to 2008-9,‟ International Journal of Agricultural Sustainability Vol. 9, no. 1 (2011): 232 – 247.
the agriculture sector, there is not much to show in terms of poverty reduction derived from growth in the agriculture sector.6
Another important fact to reflect on about Malawi Agriculture regards its productivity. The World Bank World Development Index (WDI) captures the Agriculture Value Added per worker of Malawi in 2013 at $221 and its cereal yield per hectare at a measly 2 069 Kgs. A direct comparison with the United States of America (USA) does reveal the glaring disparities in productivity between the two countries. The USA, for instance, has $63 2697 as the agriculture value added per worker, which is about 300 times that of Malawi and a cereal yield per hectare that is about four times that of Malawi.
This sluggish performance of Malawi agriculture mirrors that of the rest of Sub – Saharan Afica (SSA) region. To borrow the language of Binswanger & Townsend (2000), “Africa [SSA] agriculture lags other regions both in productivity and production…for the two decades prior to 1990, agriculture production per capita declined significantly. Cereal yields, on average, are less than half those in other developing regions. Even for tubers and plantain, for which Africa agro – ecological conditions are suitable, average yields are lower than in Asia and Latin America.”8 The World Bank State of the Poor Report (2011) caps it all by stating that SSA is the only region in the world where the number of the poor has risen between the periods 1987 – 2010 despite other developing regions in Asia and Latin America enjoying unprecedented reductions in poverty.9 Duclos and O’Connell (2009) even reckon
6 Ephrain Wadonda Chirwa et.al, “Agriculture Growth and Poverty Reduction in Malawi: Past Performance and Recent Trends,” ReSAKSS Working Paper no. 8 (2008), p1
7 “Agriculture and Rural Development Indicators,” World Bank Development Indicators (WDI), accessed on November30, 2014, http://data.worldbank.org/topic/agriculture-and-rural-development
8 H. Binswanger & R. Townsend, “The Growth Performance of Agriculture in sub – Saharan Africa,” American Journal of Agricultural Economics (2000), 1075 - 1986
9 The World Bank, State of the Poor Report 2011, p8,
http://www.worldbank.org/content/dam/Worldbank/document/State_of_the_poor_paper_April17.pdf
that “Africa will soon have the largest absolute number of poor people on earth, larger than in East Asia or in South Asia, where absolute population sizes are larger.”10
The economic literature has offered many useful perspectives attempting to excavate this paradox.
Collier & Gunning (1999) highlighted the fact that most of SSA is within the tropics which handicap agriculture production due to harsh weather conditions. The same authors also placed the blame on poor arid soils that Africa is heavily endowed with as responsible for the low productivity.11 Binswanger & Townsend (2000) attributed the adverse performance largely on poor policies and institutional failures.12 Bezemer & Headey (2007) applied a different perspective. They decried the neglect of the agriculture sector as African Governments invested heavily in the urban manufacturing sector believing it would contribute faster to economic growth.13 Other studies have highlighted the slow adoption and low usage rates of agricultural technologies such as inorganic fertilizers and improved seeds (Kelly & Gordon, 200314 & Morris et al., 200715). Another perspective advanced by Doward et.al (2008) is that sub-Saharan Africa agriculture is caught in a low-productivity trap.16 Specific studies have also attempted to explain the low productivity and production of Malawi Agriculture. Decline in agriculture investments, inadequate access to inputs, inadequate communication and adoption of technologies, inadequate access to credit, low output prices, climate change and over-dependence on rain-fed agriculture, land degradation and weak linkages between inter and intra sectoral policies are blamed for the below par performance of Malawi agriculture (Matchaya
10 J. Duclos and S.A. O’Connell, “Is Poverty a Binding Constraint on Growth in Sub-Saharan Africa?‟, Framework Paper prepared for the African Economic Research Consortium (AERC), (2009)
11 P. Collier and J. W. Gunning, “Why Has Africa Grown Slowly,” Journal of Economic Perspectives, Vol. 3, no. 3 (1999), 4.
12 Binswanger and Townsend, ibid
13 D. J. Bezemer and D. Headey, “Agriculture Development and Urban Bias,” IFPRI, (2007)
14 Kelly et.al., “Expanding access to agricultural inputs in Africa: A Review of Recent Market Development Experience,”
Food Policy, Vol. 28 (2003), 379-404.
15 Morris et.al., “Fertilizer Use in African Agriculture: Lessons Learned and Good Practice Guidelines,” Directions in Development: Agriculture and Rural Development #39037 (World Bank), (2007), p34
16 Doward et.al., “Evaluation of the 2006/07 Agricultural Input Supply Programme, Malawi,‟ Final Report prepared for the Department for International Development and Ministry of Agriculture and Food Security, (2008), 6.
et.al, 2014,17 Chirwa et.al., 2008,18 & Phiri et.al,19 2012). Phiri, R et.al (2012) specifically highlights the meager investment in Research and Development and the weak extension services delivery system as the major factors.
While the literature explaining the low productivity and production of Malawi agriculture is in abundance, none of the studies have attempted to relate Kremer’s (1993) O – Ring Theory of Economic Development to elucidate the under – production and low productivity.20 The beauty of the O – Ring theory is that it does not only put all issues identified in the literature as responsible for the sluggishness of progress of the agriculture sector under one umbrella and analyze them, it goes a great length to explain recent developments in the agriculture sector where groundnuts exports to South Africa and the Euro Zone (EU) were banned due to high levels of aflatoxin. The approach also explains further Doward et.al (2008) low – productivity trap.
This paper therefore adopts the O – Ring approach to explain the underperformance of Malawi agriculture. The O – Ring theory took its name after what happened to the rocket, Space Shuttle Challenger in 1986, which exploded because the O – Rings failed to expand in cold temperatures.
The analysis used in this paper employs a production function in which [agricultural] production consists of a number of tasks of sequential tasks, all of which have to be successfully completed for the final product to have full value. Using this analysis, it will be demonstrated that if mistakes are prevalent in all or any of the sequential tasks then value of the final output will be affected. It will be shown that the reason Malawi agriculture underachieves is due to the existence of such mistakes in the sequential tasks of agricultural production.
17 Matchaya et.al., “Agricultural Sector Performance in Malawi,” Regional and Sectoral Economic Studies, Vol. 14, no. 2, (2014), 3.
18 Chirwa et.al., 2008, ibid
19 Phiri et.al., “Challenges and Opportunities for Raising Agricultural Productivity in Malawi,” International Journal of Agriculture and Forestry, Vol. 2, no. 5 (2012), 211.
20 Michael Kremer, “The O – Ring Theory of Economic Development,” Quarterly Journal of Economics
Several papers have used the O – Ring theory concept to explain similar observations in education (Basu, K. et.al, 2009),21 vertical specialization (Nordås, 2003)22 and football (Vopel, 2013)23 and insights from such papers is what this paper is built on.24
The approach I have adopted for this paper does have very crucial implications for policy. It does highlight the existence of complementarities in agricultural production that need to be linked and executed successfully in the agricultural production function for the sector to realize its full potential and contribute to significant poverty reduction. The analysis I will use is relatively a simple analytical framework that just illustrate the empirical relevance of the O – Ring Theory to agriculture. Rigorous econometric analysis has been shelved for future research.
The rest of the paper has been organized as follows. Section 2 provides a summary of literature on the issue at hand. The O – Ring theory is presented in section 3 and is modified to apply to the agricultural sector in the Malawian context. A discussion based on predictions of section 3 follows in section 4.
Section 5 contains the conclusion.
21 Basu et.al., “Literacy Traps: Society – Wide Education and Individual Skill Premia,” IZA Discussion Paper Series No. 4047, (2009), 1 – 17.
22 H.K. Nordas., “Fragmented Production: Reorganization of Trade,” WTO Staff Working Paper, (2003), 1 – 33.
23 Henning Vopel, “A Zidane Clustering Theorem: Why top players tend to play in one team and how the competitive balance can be restored,” Hamburg Institute of International Economics (HWWI) Research Paper #141, (2013).
24 More details from these papers are in the literature review in section 2
2. Literature Review
This section builds on insights from four papers: Kremer, M (1993), Vopel, H (2013), Basu, K et.al (2009) and Nordås, H (2003). Kremer (1993) O – Ring theory is about a production function where the value of the final output is subject to a completion of multiple tasks. In this production function, an error [or a mistake] made in the performance of one task (i.e. as was the case in The Space Shuttle Challenger, or defects in garments during manufacturing) can erode the value of the final product.
Kremer emphasized the importance of skills. His main argument was that the clustering of workers of the same quality is a typical empirical phenomenon that has been observed in many processes where output depends jointly or sequentially on conducted tasks.25 In this instance, final output merely reflects the type of skills involved in its production. In the case of the USA where it is heavily endowed with high quality skills in the agriculture sector, it will follow then that its agricultural productivity will be high compared to Malawi and this explains why the Agriculture Value Added per worker in the USA is 300 times high than that of Malawi.26
Just as Nordås (2003) who applied Kremer’s O – Ring Theory to explain firm’s decision to have some parts of its product manufactured in different countries (i.e. China or India), his argument is that it is not simply the presence of cheap labour in those countries, but the presence of cheap highly skilled labour that prompts such decisions. In his own words, Nordås (2003) argued that “A firm that chooses a high – quality technology [and] cannot find highly skilled workers or suppliers to perform all the tasks it plans to undertake in a certain location, it will not locate there.”27 This finding is in line with Kremer’s (1993) argument that ‘many developing countries [are unattractive to vertical FDI due to heavy endowment of unskilled labour and thus] continue to produce mainly raw materials in spite of
25 Kremer, (1993) ibid
26 WDI, ibid
27 Nordas, (2003), ibid
having low-cost labour’ because they do not have labour with quality skills to attract the much needed foreign investment.
Vopel, H (2013) applied the O – Ring concept to football. His main argument was that a [football]
team's overall performance will be maximized if all playing positions [or stages of production] are filled with players of [same] quality. Vopel argues that “Success on the [football] pitch does not only depend [only on one or two quality] individual players but decisively on whether these players form a well-organized, well-functioning team. The production process in football is rather complex and consists of a sequence of different tactical and position – related tasks: defending a goal, obtaining the ball, and finally scoring. Each failure in any of these tasks can significantly reduce a team's performance. The best forward cannot always score the game-winning goal when the goalkeeper fails several times in a match.” What this implies is that agriculture performance is subject to how well organized the whole system is.28 Government might introduce subsidies, but subsidies alone will not be the magic pill. It will depend on how effective the extension delivery system is; but that will not be all.
Research and Development and how receptive individual farmers are to new technologies will also play a hand. As Kremer (1993) argued that quantity cannot be substituted for quality, it is not about having 10 violinists in a band that will make the symphony sound better, but having a drummer, a violinist, guitarist and vocalist, all in the right numbers and with requisite skill to produce the best symphony. Companies can fail due to bad marketing, even if the product design, manufacturing, and accounting are excellent29 and agriculture sector performance can be affected if there are mistakes in complimenting processes during production.
Basu, K. et.al (2009) applied the O – Ring concept to low literacy traps. They introduced education into the O – Ring Theory and argued that an [individual] worker’s decision to incur cost [in terms of
28 Vopel, p13
29 Michael Kremer, p551
time and money] and invest in education will depend on what those around him/her choose to do. Basu et.al points out that “…each individual faces the choice to be trained as a generalist or a specialist, with the value of being a specialist increasing as the density of specialists in the population rise.” Individual farmers’ decision in the agricultural realm to incur costs in particular investments will depend on what others around them are doing. Even though, an investment has potential to increase the income of the farmer a hundredfold, but such decisions will not be implemented if majority of the farmers are not taking similar initiatives.30
Basu & Weibull (2003)31 and Horowitz (2008)32 also applied the O – Ring concept on how punctuality affected the performance of a collectivity (cooperative). Both paper discovered that each individual in the collectivity benefited from other people’s punctuality and also the marginal return to increased individual punctuality rose with the level of other people’s punctuality. This strategic complementarity easily leads to multiple equilibria, whereby two societies of a priori identical individuals can get caught in, respectively, a tardy and a punctual equilibrium.
The O – Ring theory can be extended to agriculture as demonstrated above and that will be covered in the next section. As Kremer (1993)33 demonstrated that final output depends on completion of sequential tasks, same can be shown for agriculture. Various inputs ranging from Research and Development (R&D), Agricultural infrastructure, Agricultural policy, technology adoption, access to credit, farm inputs, size of plots and farmer education all enter into the agricultural production function. Final output is therefore subject to the quality of each input as Kremer argued. Empirical
30 Basu et.al, ibid
31 K. Basu and J. Weibull, “Punctuality: A Cultural Trait as Equilibrium,” In Economics for an Imperfect World: Essays in Honor of Joseph Stiglitz, ed (s). R. Arnott, R. Kanbur, B. Greenwald and B. Nalebu, (Cambridge, MA: MIT Press, 2003) 163 – 182.
32 A. Horowitz, “The Punctuality Puzzle: Can Current Punctuality Initiatives in Low-income Countries Succeed?” Working Paper, 2008.
33 Kremer, ibid
studies have shown that agriculture production and productivity are compromised when any of such inputs are lacking.
2.1 Empirical Literature on Agriculture Productivity
Research Findings show that the system of land tenure and property rights affects farmers’ adoption of agricultural technologies and natural resource management. Where property rights are secure, farmers have sufficient incentives to increase their productive efficiencies and ensure environmental sustainability (Shimmelles et.al, 2009).34 Farmers also use the title [deed] of the land as collateral for credit (Feder & Noroha, 2001).35 Further evidence shows that agriculture production and productivity increased in China from 1978 when the Chinese Government changed the system of property rights.36 On technology adoption, Chirwa, E.W (2005) establishes that farm size, risk exposure and capacity to bear risks, human capital, labour availability, land tenure, property rights, access to financial and produce markets, access to information, participation in off-farm activities, social capital, household characteristics and ecological and environmental factors influence farmers’ behavior towards adoption of technologies.37 A study commissioned by GoM (2002) attributed low adoption of technology to incomplete financial markets while Todaro & Smith (2011) says it is due to information asymmetry.38 Adoption of technology is positively correlated with the level of education of the individual farmer (Weir & Knight, 2000, Weir, 1999, Than, 2011 and Jamison & Moock, 1984)
34 Tenaw Shimelles, K.M. Zahidul Islam & Tuulikki Parviainen, “Effects of land tenure and property rights on agricultural productivity in Ethiopia, Namibia and Bangladesh,” p5
35G. Feder and R. Noronha, “Land rights, systems and agricultural development in Sub-Saharan Africa.” World Bank Research observer 2(2):143-169, p11.
36 “The Xiaogang Village Story” Accessed on September 8, 2014, http://www.china.org.cn/china/features/content_16955209.htm
37 Ephrain Wadonda Chirwa, “Adoption of fertiliser and hybrid seeds by smallholder maize farmers in southern Malawi,”
Development Southern Africa Vol. 22, No. J, March 2005
38 Michael P. Todaro and Stephen C. Smith, “Agriculture Transformation and Rural Development,” in Economic Development, p421
Zivkovic et.al (2009) paper looked at the important role extension service delivery plays in agriculture productivity. His main finding was extension service delivery offer expert assistance in improvement of production and processing, enables flow of information and transfer of knowledge and scientific findings to practice.39 Similar findings are echoed by Feder (1999) and Swanson & Rajalati (2004).
Additionally, Owens et al. (2003) find that farmers in Zimbabwe who were reached by extension services increased their crop production by 15% compared to farmers who were not reached.40
Todaro & Smith (2011) highlights the presence of market failures in agriculture which include environmental externalities, credit, R&D, extension services delivery, information asymmetries in product quality, and monopoly power in input supply.41 He recognizes that these market failures sharply limit the ability of farmers to take advantage of opportunities.
This literature review has provided the necessary background that will aid an easy understanding of the O – Ring model in the next section.
39 Dragic Zivkovic et.al, “Agriculture Extension Services in the Function of Rural Development,” p 16
40 Burton E. Swanson and Rikka Rajalati, “Strengthening Agricultural Extension and Advisory Systems: Procedures for Assessing, Transforming, and Evaluating Extension Systems,” Agriculture and Rural Development Discussion Paper 44
41 Michael P. Todaro, ibid
3. The Model and Its Application to Malawi Agriculture Sector
The starting point of this section will be Kremer's (1993) O-ring theory of economic development which highlights the complementarity between different components and inputs of a production process, and where mistakes in any one of several tasks in the production process can lead to catastrophic failure of the product.42 Agriculture production follows an O – Ring Production function because an error in any one task (be it R&D or extension service delivery or farmer mistakes at the farm level or drought) affects the value of the final product. Workers/tasks in the agricultural sector are natural complements to other workers/tasks.43 It follows therefore that the earnings players in the sector can earn in performing any one task will depend on the quality of the workers in the other tasks.
Kremer (1993) argued that due to this, workers will seek to work with others of similar skill, as working with lesser skilled workers risks loss of income from greater likelihood of production errors.
The same will apply in agricultural production. For an easy understanding of how the O – Ring theory applies to the Malawian agricultural sector, I make the following assumptions.44
(a) Maize (corn) is the only product that is produced by all firms (i.e. smallholder farmers, estates) in Malawi. (I will use firm consistently to refer to smallholder farmers or estates)
(b) Firms are price – takers and there is free entry.45
(c) t represents technological complexity, where 1 ≤ t ≤ ∞. Technology complexity should be interpreted as the number of technologies used in the production of maize. t = 1 will imply the firm uses just one technology while t =20 will imply the firm uses 20 technologies in maize production.
Another way to look at t is as the number of tasks involved in maize production. t = 1 means one task is involved and t = 20 means 20 tasks are involved.
42 Kremer, ibid
43 Li Yu and Peter Orazem, “Human Capital, Complex Technologies, Firm Size and Wages: A Test of the O – Ring Production Hypothesis,” Iowa State University Working Paper Series #08029, (2008), p3.
44 Some assumptions are similar to those Kremer (1993) made in his paper
45 The estimated number of smallholder farmers and estate owners exceed 3 million. This assumption is useful because it implies none of the firms can determine market prices of their produce and will just take what is in the market.
(d) Quantity cannot substitute quality and tasks are indivisible. A high skilled worker cannot be replaced by two low quality skilled workers
(e) Skill will be denoted by q where q ϵ [0, 1]. I interpret q as quality index or the probability that the worker completes his or her task successfully. q = 1 entails task is done without mistakes.
(f) qi will be the skill – level that goes into task i, that is, the worker employed on task i has a skill level qi
(g) B, a scalar term, will represent output produced per worker when all tasks are performed successfully.
The Maize production function will thus be given as
= … ≡ 46 … (1)
It is easy to see that if all tasks are performed at skill level, = 1, then total output = tB. Failure in any of the sequential tasks, , in equation (1), significantly reduces the value of maize output, . For instance, R&D is one of the important tasks that go into equation (1), in extreme cases where & = 0, value of maize output, = 0 regardless of how the other tasks are executed.47 To avoid such from happening, firms will ensure that they engage skills of the same quality. It follows therefore that
= … …
= > 0 … (2)
Equation (2) shows that the marginal productivity of skill (factor) depends positively on the quality of the other skills. It entails therefore that workers with high skills q will find it best to work with other
46 enter into the production function multiplicatively to underscore the complementarities that exist between the factors of production
47 That explains why the Space Shuttle exploded due to a malfunction of the O – Rings
workers of high skills because of the complementarity in skills – working with better skilled colleagues increases each worker’s marginal product (and hence wage which is demonstrated below).
The other aspect is to show the decision that will be taken by a competitive firm. Since there is a continuum of worker types,48 there is a continuum of wages, one for each type of worker. The market wage schedule is given by w (q). In this case the firm’s problem is to choose t workers (or technological complexity) for operating the firm so as to maximize its profit. Thus the competitive equilibrium will be given as follows:
{ } − ( ) … (3)
The first order condition for profit maximization of each task j will be given by
( ∗)
∗ = ∗ = ∗ … (4)
This implies that the marginal product from an increase in the final output equals the marginal wage that is paid for a marginal increase in the value of the final output. It follows directly that a firm with a higher average quality will pay a higher wage to the skill (factors) it uses in its production function. In equation (3), ∏ represents firm size. As t increases, so does the size of the firm and its wage schedule, w (q). A competitive firm will keep hiring workers until the marginal contribution from the hired worker equals the unit wage as equation (4) shows. Kremer (1993) proved that it is always in the firm’s interest to have all its tasks done by workers of the same skill level. This is called the "skill – clustering theorem.
48 ∈[0,1] which implies level of skill varies between 0 and 1.
Skill clustering decision by a firm can be demonstrated by assuming that there are four workers available – two that are of low skill ( ) and two that are of high skill ( ). It can easily be shown that matching the skills together will reap more output than mixing them. Mathematically it can be shown that:
+ ( ) > 2 ( ) ≠ … (5)
In this case, in equilibrium firms would prefer to cluster the high quality inputs together than to mix because the former adds more value to final output. This can be proved easily. If = 1 = 0.5, then final value will be 1.25 if there is matching (as shown on the LHS) but final output is only 1 when the skills are mixed. Thus firms will prefer to match high quality skills together and low quality skills together. It follows therefore in equilibrium that firms will employ skills that have the same quality. Thus, can always ‘outbid’ and have another as partner. Same holds for firms who look for workers. A firm with one worker can always pay higher wage to get another worker, than the firm starting with an worker.
It follows therefore that wages will increase with increasing skills. This is in accordance with empirical findings that total wage will increase level of skill of a nation and explains why productivity differs across countries. A country that has many workers with high quality skills, , will attract more of them (a country of specialists) while a country that has many workers with low – quality skills, , will keep having more of them.
This O – Ring Production function background brings me to the following stylized facts:
(a) If there are two countries/firms with workers of skill level and respectively, the level of agricultural related incomes in the high skilled country will be way much higher than those countries endowed with low-skills. This is so because in a competitive equilibrium, as demonstrated in equation
(4), wage equals the marginal product of labor (MPL) for any skill (worker). It is therefore the differences in worker skills between countries that explain the differences in agricultural production, productivity and incomes.
(b) Decisions by firms to make agriculture – related investments in particular skills and technologies will be influenced by the level of investments taken by other firms around them. When the average quality of skills is high in firms, other firms will have the incentive to acquire more skills simply because the increment to their marginal productivity of skills will be magnified by the others firms’ level of skills. It follows therefore that return to agriculture is much higher in countries that already have high levels of investment in skills and technology.49
(c) Workers of low quality skill drag down the value of the firm’s final output by reducing the marginal productivity of the workers due to the complementarity (recall when & = 0, = 0).
When there are many such low skilled workers, they reduce the marginal productivity even of high quality skilled workers. This as a result drags down the whole economy.50
(d) A country that is heavily endowed with many low – quality skilled workers will find it hard to use/adopt modern, complex technologies since such technologies require many high – skilled workers doing different tasks that cannot be replaced by low-skilled workers. Thus poorer countries are stuck with lower – skilled technologies and production of mainly primary products [where making a mistake in production is less costly].
In the following section, I therefore adopt the insights from the O-ring production function above to explain the sluggish nature of agriculture productivity and production in Malawi.
3.1 How the Model Applies to Agriculture Sector in Malawi
Malawi agriculture mainly has two sub sectors: smallholder farmers and estates. The Smallholder sub sector comprises about 70% of all agricultural firms and estates comprise the rest. The technological
49 It results in what is called a virtuous cycle
50 This is demonstrated in the appendix. This results in a vicious cycle
complexity, t, (or the number of tasks) used in maize production varies between firms. A lot of technologies are available for Malawian agriculture. Some of these technologies are directly used by the firm at the farm level and include fertilizer management practices, conservation agriculture, soil fertility enhancement technologies, irrigation technologies, technologies responding to climate change, management practices, and crop protection technologies. These technologies are a result of R&D conducted by agriculture research institutions. An important function of extension service delivery is available to ensure that these technologies from R&D reach the firm at the local level. Other important aspects that affect maize production include the system of land tenure (property rights), agriculture infrastructure, government policy and access to capital (credit). All these provide the circumstances that are necessary for high productivity and production.
As Kremer (1993) argued that all these technologies have to be used by the firm without mistakes such that not to compromise the value of the final output, it is evident that as demonstrated in equation (2) that a defect in the performance of any of the technologies (tasks) by the workers assigned to such will result in the reduction of the final output.
It follows therefore that the reason why the cereal output per hectare of Malawi is just a quarter of that realized by the USA is because some of the tasks are not performed to perfection. As demonstrated in Equation (1), the contribution of an input or a factor to value of final output depends positively on the overall quality of other factors. A factor like R&D benefits from other factors like extension service delivery. Extension service delivery will also benefit from government trainings of extension workers on latest technologies they need to communicate to the farmer. While on the farm, firms’ decision to invest in particular technology will depend on available capital and their capacity to take risks. The O – Ring theory predicts the value of the final output will therefore depend on the successful completion of these tasks without any mistakes. It follows therefore that the reason the performance of US agriculture is as it is simply because workers involved in the sequential tasks of R&D, extension service delivery,
agriculture trainings and provision of agriculture infrastructure are highly skilled and do not make any mistakes which as a consequence result in more value being added to final output.
Motes (2011) indicates that the success of agriculture is dependent on technology adoption, management of the firm, investment, markets, supportive government policies and access to resources (credit). The markets can be vibrant but if soil fertility is not maintained through specific provision of nutrients, then it will affect output. Harvesting technologies to minimize post – harvest losses have to be available to ensure output is not lost.51
Crop yield is a primary indicator of productivity. It is an indicator that soil fertility, access to irrigation, technologies in the form of genetics, fertilizer, machinery, management practices, crop protection; as well as credit to support their purchase. Crop yield is also dependant on supportive agricultural infrastructure, economic and trade policies. All these factors provide an environment for agriculture production to thrive.52
Figure 1: Cereal Production 1960 - 2005
Source: Michael Todaro, Development Economics in the Third World53
51 William C. Motes, “Modern Agriculture and Its Benefits – Trends, Implications and Outlook,” Global Harvest Initiative, (22011), p9.
52 William C. Motes, p9, ibid.
53 Michael P. Todaro and Stephen C. Smith, “Agriculture Transformation and Rural Development,” in Economic Development, p421
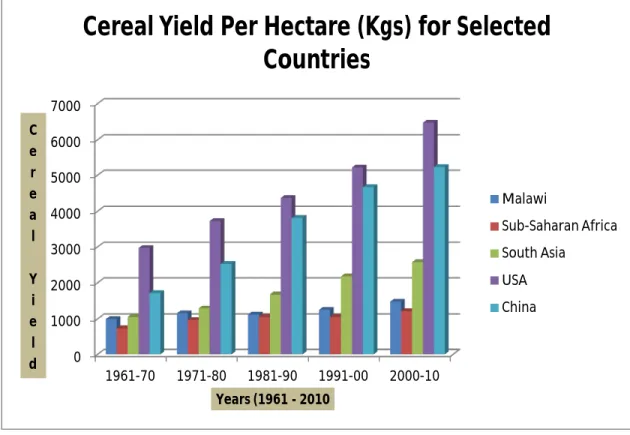
Figure 2: Cereal Yield per Hectare (Kgs) for Different Regions
Source: World Bank’s World Development Indicators Database
As depicted in figure 1, the cereal yield per hectare of the developed countries is the highest and that of SSA is the lowest. Even when compared to other developing countries in Asia and Latin America, SSA still fares poorly. Figure 2 shows the same story but for individual countries. The average cereal yield of Malawi is better than the SSA average but is out matched when compared to South Asia, China and the USA. The reason this is the case is because of the way tasks in the agriculture production function are performed. Where there are many mistakes, cereal yield is small.
Table 1 below is a list of selected indicators from the Malawi Agriculture Census Survey Report (2007) compiled by the National Statistics Office.
0 1000 2000 3000 4000 5000 6000 7000
1961-70 1971-80 1981-90 1991-00 2000-10 C
e r e a l Y i e l d
Years (1961 - 2010
Cereal Yield Per Hectare (Kgs) for Selected Countries
Malawi
Sub-Saharan Africa South Asia
USA China
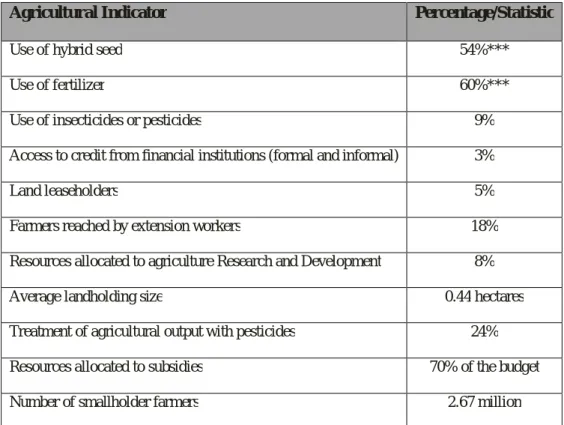
Table 1: 2007 Malawi Census of Agriculture and Livestock Selected Indicators
Agricultural Indicator Percentage/Statistic
Use of hybrid seed 54%***
Use of fertilizer 60%***
Use of insecticides or pesticides 9%
Access to credit from financial institutions (formal and informal) 3%
Land leaseholders 5%
Farmers reached by extension workers 18%
Resources allocated to agriculture Research and Development 8%
Average landholding size 0.44 hectares
Treatment of agricultural output with pesticides 24%
Resources allocated to subsidies 70% of the budget
Number of smallholder farmers 2.67 million
***figures are high because most smallholder farmers benefited from the subsidy program
The average household landholding size is 0.44 hectares [though figure might have gone down further], which has fallen from 1.53 hectares per household in 1968 (MEJN, 2004). This small landholding size emphasizes the need for firms to adopt land saving technologies that produce more output from a small parcel of land. One input to ensure this is realized is extension service delivery where individual firms have to be sensitized on land saving technologies they can adopt to realize such output. On the other hand, some regions of Malawi have short rainfall days which underscore the importance of adopting climate change smart agriculture. But as Table 1 shows, only 18% of firms were reached by extension services. This entails, as Kremer (1993) put it, that there are mistakes in the performance of this task. These mistakes affect the value of the final output. LUANAR & CISANETT (2014) policy brief bemoans the worsening of the extension worker to farmer ratio from a recommended 1:7500 to 1:3900 which in the end has resulted in deteriorating quality of extension
service delivery. There have 64 technologies developed since 2000 aimed at improving the productivity of the farmer, but which have been least used because of the poor delivery of extension services (Phiri, M.R et.al, 2012). This just goes to demonstrate that even if one task can be performed without mistakes, its contribution will be reduced by other ill performing tasks. More has been done on R&D but it has been of little use because the farmer on the ground has not used them due to poor extension services delivery.
Another aspect worth highlighting is the issue of agriculture loans. Table 1 show that 3% of firms were able to access loans from formal financial institutions for agriculture related ventures. It is an undeniable fact that lucrative agriculture ventures require a huge injection of capital, which can only be supplied by banks. With only 3% being able to access such capital, it follows therefore that this lack of capital for agriculture investments compromises the final value of the final output. This unwillingness by banks to supply firms with capital can partly be explained by the lack of collateral. Most firms in Malawi practice their farming on traditional land and do not have property rights or title deeds to such land. Having a title for a piece of land has advantages; one of which is title of land makes it easy for farmers to use the land as collateral for credit (Feder & Noronha, 2003). This just shows that mistakes in the performance of one task (property rights registration) affects the performance of other tasks (access to capital) and eventually the value of the final output.
Malawi has registered an improvement in the production of its staple food, maize, since 2006, largely due to the input subsidy program. Table 2 below shows the percentage allocation of the agriculture budget allocated to the subsidy program which has averaged 60%. Resources allocated to Research and Development and delivery of extension services have been very little. Much of Malawi’s agricultural R&D is donor-funded, thereby creating a very precarious situation for sustainable technology generation. Additionally, the increase in output due to the subsidies has been subdued mainly because of the mistakes being made in the performance of the other tasks.
Table 2: 2005 - 2010 Proportion of Agriculture Budget Allocated to Agriculture Subsidy
Source: http://www1.oecd.org/tad/agricultural-policies/46384473.pdf
The other matter is that of decisions taken by individual firms on the farm. The wage rates offered by firms are very low. And going by the competitive equilibrium in equation (5), it implies the nature of skills employed is of low quality. While soil nutrient testing is of paramount importance, it is hardly used by firms. Even the level of average fertilizer application by farmers is below the average recommended by SADC. Use of pesticides and insecticides is also almost non – existent. The performance of all these factors has impact on final output.
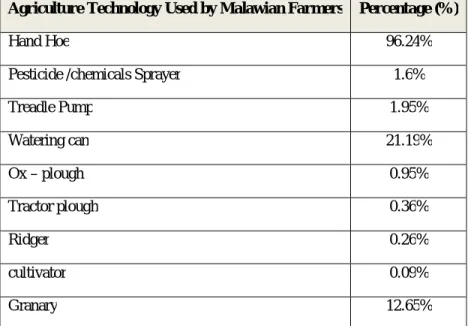
Due to the heavy endowment of low skill Malawi Agriculture continues to rely on primitive technologies as Table 4 below illustrates. Mostly firms rely on the hand hoe for cultivation but more efficient technologies like tractor – ploughs, ox – ploughs and the Ridger are minimally used.
Countries like China and USA rely heavily on these capital intensive technologies which explain why their agriculture production and productivity is better than that of Malawi and the rest of SSA.
Year Subsidy Allocation
2005 59%
2006 63%
2007 61%
2008 67%
2009 71%
2010 58%
Table 3: Agriculture Technologies used by Malawian Farmer
Agriculture Technology Used by Malawian Farmers Percentage (%)
Hand Hoe 96.24%
Pesticide /chemicals Sprayer 1.6%
Treadle Pump 1.95%
Watering can 21.19%
Ox – plough 0.95%
Tractor plough 0.36%
Ridger 0.26%
cultivator 0.09%
Granary 12.65%
Source: Integrated Household Survey Data, NSO (2011). The table representation is by the author
Taking these aspects into consideration, it follows therefore that the reason Malawi Agriculture is trapped in under – production and low productivity is because of the fact that there are mistakes in the performance of the sequential tasks in the agricultural production function.
4. DISCUSSION
This paper has explained the low productivity of Malawi Agriculture using a modified version of Kremer’s (1993) O – Ring Theory. In the process of the O – Ring model analysis, some important stylized facts emerged. One such fact is that agriculture productivity is sluggish due to the prevalence of mistakes in some of the tasks that go into the production of maize. Just as Kremer (1993) argued
‘that companies can fail due to bad marketing, even if the product design, manufacturing, and accounting are excellent’ Malawi agriculture fails due to such “bad marketing.” Phiri R et.al (2005) acknowledges that Malawi has the capacity to conduct Agriculture R&D. Since 2000, 64 technologies have been developed aimed at improving agriculture productivity. The problem, however, is that most of these technologies have not been adopted by the smallholder farmers due to the almost non – existent extension service system. The worst input factor (the weakest link), which is extension service delivery in this case, affects the overall value and brings down the marginal contributions (marginal productivity) of the other inputs including R&D. It can be argued therefore that Malawi agriculture has to reduce mistakes coming from worst input factors to start performing at levels of other developing countries mostly in Asia and Latin America.
The lack of capital is another input that is hurting the performance of agriculture in Malawi. It has been shown that a measly 3% of farmers were able access loans from the banks. This was mainly due to the absence of collateral as most land that is used for agriculture production is traditional land where the local chief has the power to decide how it has to be shared. Access to capital is positively related to land rights. With only 5% of farmers having titles to their land, it does explain why only 3% had access to credit from banks. This goes to show how the behavior of one input affects the outcome of another input. Several studies have investigated and found that the absence of property rights and lack of access to capital do have a negative impact on agriculture production and productivity (Shimmelles et.al, Feder & Noronha, 2001 & Adams, M.et.al, 2003). Acemoglu (2005) adds that institutions (i.e.
private property) matter for growth because they shape the incentives of key actors in the economy by influencing investments in physical and human capital and technology, and the organization of production.
Some studies have found evidence supporting the complementarity between education and technology adoption with more educated farmers being first to attempt new tillage practices and plant new varieties (Yu & Orazem, 2008 and Foster & Rozenizweig, 1995). However this factor does not have that serious an impact on value of final output. Uneducated farmers eventually learn by copying from others and a functional extension service delivery can take care of this aspect. Just as Phiri, R. et.al (2005) pointed out that emphasis should be on the communication of the [R&D findings] to farmers in a usable form and enhancing the research – extension farmer linkages and the efficiency and relevance of technology generation and transfer.
It appears that most mistakes in Malawi agriculture production can be taken care of with government intervention. Extension service delivery is a public good. So is research and development. The latter benefits a lot from donor funding with GoM committing very little resources and the risk is if the donors pull out, then R&D in agriculture will be almost non – existent. About 70% of the agriculture budget goes to subsiding farm inputs; the remaining 30% of the budget is shared by R&D, Extension Service Delivery, Marketing and other equally important agriculture functions. While the subsidy program has resulted in the increase of production, the neglect of the other equally important functions is hurting the overall value of agriculture production. Despite this increase in output, most of this output is lost through post harvest losses. This also gets to explain why Malawian groundnuts exports were banned from South Africa and EU exports due to the high percentage of aflatoxin. Sequential production as demonstrated by Kremer (1993) requires each task at 100% to have full value. Having one task performed at 20%, another at 50% and another at 100% will affect overall output in a negative way but having all tasks at 100% gets the entire value of the product.
The stagnation of agriculture productivity in Malawi is therefore due to the inability of the factors not linked to one another. Countries where these complementarities are strong have a thriving agriculture sector. The extreme differences in agricultural value added between Malawi and USA are due to the fact that the USA performs its tasks in agricultural production without many mistakes. That is the extension system is mistake free; the research and development task is done mistake free and so are all the important inputs involved in production.
5. CONCLUSION
This paper set out to explain and analyze the poor performance of the Malawi agriculture sector in the context of the O – Ring Theory. The O – Ring theory assumes a sequential production function where final value of output is subject to the sequential tasks being done mistake free. The analysis found that Malawi agriculture is plagued with mistakes in many of the sequential tasks involved in agriculture production. Extension service delivery which plays a vital role in linking firms on the ground with technologies developed by research institutions was found to be delivered only at 18%, thus contributing to reduced output. In some cases where firms were reached by extension services, they simply did not adopt the technologies they were sensitized with due to low levels of education.
The other issue that was discovered was that even though there has been an investment in agriculture subsidies from 2005 to present and the research capacity of agriculture institutions being deemed adequate, these inputs into production do not seem to work because of mistakes in the other factors involved in agriculture production.
Government has a role to play in ensuring that extension service delivery is there because it has public good characteristics. Promoting the system of land rights will also assist farmers in accessing capital from the banks which they need to make profitable long term investments.
6. REFERENCES
1. “The Xiaogang Village Story.” Accessed on September 8, 2014, http://www.china.org.cn/china/features/content_16955209.htm
2. Adams, M., S. Sibanda and S. Turner. "Land Tenure reform and Rural Livelihoods in Southern Africa." ODI Natural Resource Perspectives, Number 39.
3. Besley, Timothy. “How Do Market Failures Justify Interventions in Rural Credit Markets?”
The World Bank Research Observer, Vol. 9, No. 1 (Jan., 1994), pp. 27-47
4. Burton E. Swanson and Rikka Rajalati, “Strengthening Agricultural Extension and Advisory Systems: Procedures for Assessing, Transforming, and Evaluating Extension Systems,”
Agriculture and Rural Development Discussion Paper 44.
5. Chirwa, Ephrain Wadonda et.al. “Agriculture Growth and Poverty Reduction in Malawi: Past Performance and Recent Trends.” ReSAKSS Working Paper no. 8
6. Chirwa, Ephrain Wadonda. “Adoption of fertiliser and hybrid seeds by smallholder maize farmers in southern Malawi.” Development Southern Africa Vol. 22, No. J, March 2005
7. Engemann, Martina and Henrike Lindemann. “Testing the O – Ring Theory for FDI.” Deutsche BundesBank No. 24 (2014).
8. Foster, D. Andrew. And Mark R. Rozenzweig. “Learning by Doing and Learning from Others:
Human Capital and Technical Change in Agriculture.” The Journal of Political Economy, Volume 103, Issue 6 (December, 1995), 1176 – 1209.
9. G. Feder and R. Noronha. “Land rights, systems and agricultural development in Sub-Saharan Africa.” World Bank Research observer 2(2):143-169.
10. Hossain Mahbub. “Farm size, tenancy and land Productivity: Analysis of farm level data in Bangladesh Agriculture.” The Bangladesh Development Studies.
11. Jones, Garett. “The O – Ring Sector and The Foolproof Sector: An Explanation for Skill Externalities,” Journal of Economic Behavior and Organization (Aug, 2012)
12. Kremer, Michael. “The O – Ring Theory of Economic Development.” The Quarterly Journal of Economics, Vol. 108, No. 3 (Aug., 1993): 551-575.
13. M. P. Rukuni et.al. “Is Land Title Registration the Answer to Insecure Property Rights in Sub Saharan Africa?” University of Zimbabwe Publications. Volume 6, No. 6.
14. RAquilz Zaman. “Sharecropping and Economic Efficiency in Bangladesh.” The Bangladesh Economic Review, Vol.1 No.2.
15. Tenaw Shimelles, K.M. Zahidul Islam & Tuulikki Parviainen. “Effects of land tenure and property rights on agricultural productivity in Ethiopia, Namibia and Bangladesh.”
16. The 2005 Malawi Vulnerability Assessment Report. “MVAC Food Assessment Country Report.” Lilongwe, 2005.
17. The National Statistics Office (NSO). “The Malawi Census on Agriculture and Livestock.”
Government Print, Zomba. 2007.
18. The National Statistics Office, “The Integrated Household Survey III Report,” Zomba:
Government Print, 2011
19. The NSO. “Malawi Agriculture Reports.” Government Print, Zomba.
20. The NSO. “The 2008 Malawi Census Report.” Government Print, Zomba. 2009.
21. The World Development Report. “Agriculture for Development.” World Bank Group, 2008.
22. Todaro M. and Stephen Smith. “Economic Development.” Boston: Addison Wesley, 2012.
23. Yu, Li. and Peter Orazem. “Human Capital, Complex Technologies, Firm Size and Wages: A Test of the O – Ring Production Hypothesis.” Iowa State University Working Paper Series
#08029. (September 2008): JEL: L11; O33; J43.
24. Yu, Li. Terrance, Hurley. James, Kliebenstein and Peter Orazem. “Testing for Complementarity and Substitutability among Multiple Technologies: The Case of U.S. Hog Farms.” Iowa State University Working Paper # 08026. (September 2008): JEL: O33; L25;
C12
25. Zivkovic, Dragic et.al. “Agriculture Extension Services in the Function of Rural Development.”
26. APPENDICES
Appendix 1: Agriculture Technologies used by Malawian Farmers
Total 40,089 234,913 275,002 PIG STY 561 10,424 10,985 BARN 310 10,679 10,989 GRANARY 1,392 9,609 11,001 STORAGE HOUSE 73 10,928 11,001 POULTRY KRAAL 584 10,417 11,001 LIVESTOCK KRAAL 1,640 9,361 11,001 CHICKEN HOUSE 1,577 9,424 11,001 OTHER (SPECIFY) 6 10,991 10,997 GRAIN MILL 16 10,985 11,001 MOTORIZED PUMP 7 10,994 11,001 GENERATOR 24 10,977 11,001 CULTIVATOR 10 10,991 11,001 RIDGER 29 10,972 11,001 TRACTOR PLOUGH 4 10,997 11,001 TRACTOR 4 10,997 11,001 OX PLOUGH 105 10,896 11,001 OX CART 166 10,835 11,001 WATERING CAN 2,332 8,671 11,003 TREADLE PUMP 214 10,788 11,002 SICKLE 5,445 5,557 11,002 PANGA KNIFE 6,313 4,689 11,002 SPRAYER 174 10,828 11,002 AXE 6,426 4,575 11,001 SLASHER 2,088 8,914 11,002 HAND HOE 10,589 414 11,003 Item Yes No Total ?
currently own [ITEM]
Does your household
Appendix 2: Simulations of the O – Ring Theory
The O – Ring Theory production function, in summary, describes a process of sequential production where expected output, E(y), depends on the completion of a series of tasks, n, and E(y) as a dependent variable is subject to how well the worker (expressed as qi) completes the task. The variable qi is an index of worker i's skill level. The important feature about this production function is complementarity between workers' skills. For example, qi = 1, refers to a worker who is well skilled to complete a task assigned to him/her without making any mistake. In this case the propensity to make a mistake is absent. There is no any form of inefficiency and as a result, expected output, E(y), will not be affected if all workers in the sequential production are efficient.
For an easy understanding of the O – Ring I will use simulations where I assume the following things.
Kremer treated kα and β as exogenous, as such, I assume that kα = β =1 for easy analysis and understanding of the O – Ring Production function. I also pick an arbitrary number of sequential tasks to be 10 (i.e. n = 10) that have to be performed to realize E(y). The O – Ring model above will now appear as follows:-
( ) =
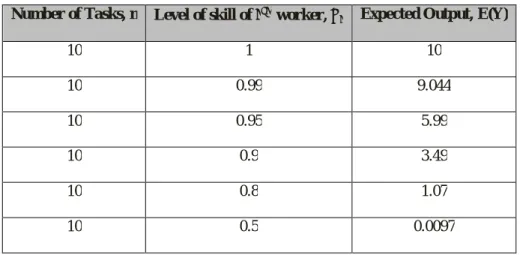
Table 4 summarizes the simulations and illustrates effect on E(y) as changes Table 4: Summary of the Simulations
Number of Tasks, n Level of skill of worker, Expected Output, E(Y)
10 1 10
10 0.99 9.044
10 0.95 5.99
10 0.9 3.49
10 0.8 1.07
10 0.5 0.0097
Table 4 demonstrates the fact that in sequential production, inefficiencies or mistakes in any one of the sequential tasks or the processes reduces the expected output, E(y). When tasks are assigned to efficient workers, E(y) = 10 (i.e. the level of skill the worker, =1, E (y) = 10. But if the propensity to make a mistake is 0.01 (i.e. = 0.99),54 E(y) reduces to 9.044 from 10. Similarly, when the probability of a making a mistake is 0.1 (i.e. =0.9), E(y) reduces to 5.99. Finally, when = 0.5, E(Y) reduces to approximately 0.01. It is evident that E(y) of this production function keeps on getting
smaller and smaller as the level of inefficiency gets higher ( →0). This can also be termed as the weakest link problem where the quality of final product is affected by mistakes in the process of production.55
54 Kremer described qi = 0.99 as that a worker has a 99% chance of completing the task successfully and a 1% chance of making a mistake
55 Micheal Kremer, p560
Appendix 3: Trends in Agriculture Spending
Table 5: Trends in Agriculture Sector Spending 1970 - 2005
Item Years
1970 – 79 1980 – 84 1985 – 89 1990 – 94 1995 – 99 2000 – 05 Agriculture share in budget (%) 32.15% 24.83% 10.08% 11.17% 8.98% 6.13%
Agriculture budget (million $) 21.3 43.98 29.05 41.9 36.12 37.48 Agriculture Spending per capita ($) 4.03 6.88 3.85 4.77 3.51 3.21
Source: National Statistics Office Agriculture reports, Malawi