Coatings of Semiconductor Electrodes for Solar Fuel
Devices
Thesis by Pakpoom Buabthong
In Partial Fulfillment of the Requirements for the Degree of
Doctor of Philosophy
CALIFORNIA INSTITUTE OF TECHNOLOGY Pasadena, California
2021
Defended May 12, 2021
ã 2021 Pakpoom Buabthong ORCID: 0000-0001-5538-138X
First and foremost, I would like to thank my advisor, Prof. Nathan S. Lewis, who has provided tremendous support and helped me navigate the electrochemistry labyrinth during my time here. I would also like to thank Prof. Harry Gray for his guidance. His overwhelming positivity has helped correct my course any time I felt lost. I am grateful to the rest of my committee, Prof. Katherine Faber, Prof. William Goddard, and Prof. William Johnson for their expertise and their valuable discussion
Before I move on to other people in my social circle, I would like to thank all the readers of this thesis or any of my manuscripts. I have always thought of reading scientific articles as looking at the wrong side of a beautiful tapestry where the findings are often obscured behind a highly formal style of writing, which keeps it concise and accurate, yet often lacking the pathos found in other types of writing. It might be challenging to sift through the information provided here, but I truly appreciate your time reading this work.
I have learned almost all of my experimental techniques from Dr. Ke Sun, who is one of the most supportive and the hardest working researchers I have ever met. I have also gained much help and knowledge from Dr. Ivan Moreno-Hernandez, who always had answers to my questions.
My time at Caltech would not be the same without Slobodan Mitrovic. He has trained me on all the instruments and has helped me grow as a researcher. I also want to acknowledge Melissa Rojanapongpun for her help with artwork and illustrations during my Ph.D. I would like to thank everyone here at JCAP who made working here really fun: Joachim Lewerentz, Ryan Jones, Kyle Cummins, John Gregoire, Jack Baricuatro, Helge Stein, and Matthias Richter, who knows how to do everything.
I would like to thank everyone in the Lewis group for making my Ph.D. enjoyable and for providing guidance throughout my time here, particularly, Paul Kempler, Katherine Rinaldi, Harold Fu, Zach Ifkovits, Jake Evans, Jackie Dowling, and the former G135 residents:
Xinghao Zhou, Carlos Read for making G135 the best office on campus. And I would also like to thank all the non-G135 natives: Weilai Yu, Ellen Yan, Kathleen Kennedy, Ethan Simonoff, Katie Chen, Katie Hamann, Azhar Carim, Michael Mazza, Madeline Meier, Mo Morla, and many more.
I want to thank the wonderful team of administrators: Christy Jenstad, Jennifer Blankenship, Barbara Miralles, and Mabby Howard for all your support that made my PhD so much more memorable, as well as the Caltech staff for being awesome at your work and wonderful friends, especially Brian Markowicz, Denise Rodriquez, and JF Bonavich.
During all my time, I have received numerous encouragements from the “Yangji” group: I don’t have words to express my gratitude to all of you: Claire Kuo, Jash Banker, Michelle Cua, Joeson Wong, Sam Loke, Nori Arai, and Shiori Arai. I would also like to thank my Thai scholar friends who had started this journey with me in 2010, especially Grace Anantaya
Somboonpanyakul, as well as all the Thai community here at Caltech. I want to give a special thanks to Papis Wongchaisuwat for all her support during my time.
I would like to thank the Association for Thai Democracy for giving me a sense of purpose outside of my academic life. I want to extend my special thanks to Toy Jatuporn Leksut and Pongkwan Sawasdipakdi for their companionship that has helped me get through the last few months of my PhD career.
I would also like to thank all of my friends at Aero Association of Caltech (Caltech Flying Club), Greg Schultz, Carlyn Lee, and especially, my instructor Joe O’Rouke, who has enabled me to step back when something went wrong in my experiments, and look at my problem literally from 3000-feet above.
Most importantly, I want to thank Whay Warisa Ketphan for always being there and listening to my endless complaints about everything. My cats back home also deserve my thanks for all their love and support. Last but not least, I would like to thank my parents, Narong and Sirinkorn Buabthong for their unwavering support.
Climate change and increasing global energy consumption drive the need for clean and renewable alternatives to fossil fuels. Photoelectrochemical solar fuel devices offer a potential solution to capture and store clean and renewable solar energy in chemical bonds.
Nevertheless, degradation of semiconductor electrodes is one of the major impediments to the implementation of practical stable solar fuels systems.
Herein, we investigate the corrosion mechanisms and the corrosion kinetics of CdTe and ZnTe cathodes under the conditions for hydrogen-evolution reaction in strong acid and strong alkaline media. The effects of catalyst over-layer on CdTe’s and ZnTe’s corrosion pathways are discussed as well as potential protective coatings for ZnTe cathodes. Then, we address the original physical pinhole defects in amorphous a-TiO2
grown by atomic-layer deposition (ALD) on GaAs anodes. In addition, we explore new pinhole formation during electrochemical experiments and provide simulation for the propagation of the corroding GaAs substrate after new exposure to the electrolyte through microscopic pinholes. Finally, we develop a fabrication procedure for GaAs micro-island structures to provide defect isolation on the a-TiO2 film. The micro-island structures combined with dissolution measurements of the ALD a-TiO2 films were used to study the distribution and the evolution of pinholes from pre-existing defect spots in the protective coatings.
Buabthong, P., Jiang, J., Yu, W., Moreno-Hernandez, I., Papadantonakis, K. M., Brunschwig, B. S., Lewis, N. S. “Chemical and Electrochemical Corrosion Behaviors of CdTe and ZnTe Electrodes under Conditions Relevant for Hydrogen Evolution Reaction.”
in preparation. Adapted for Chapter 2.
P. B. participated in the conception of the project, prepared the data, and participated in the writing of the manuscript.
Buabthong, P., Ifkovits, Z. P., Kempler, P. A., Chen, Y., Nunez, P. D., Brunschwig, B. S., Papadantonakis, K. M., Lewis, N. S. “Failure Modes of Protection Layers Produced by Atomic Layer Deposition of Amorphous TiO2 on GaAs Anodes.” Energy Environ. Sci.
(2020) 13, 4269-427. DOI: 10.1039/D0EE02032J. Adapted for Chapter 3.
P. B. participated in the conception of the project, prepared the data, and participated in the writing of the manuscript.
Buabthong, P., Evans, J., Rinaldi, K. Z., Kennedy, K. M., Fu, H. J., Ifkovits, Z. P., Kuo, T.-J., Brunschwig, B. S., Lewis, N. S. “GaAs Micro-island Anodes Protected by
Amorphous TiO2 Films Mitigate Corrosion Spreading Due to Pitting and Enhance Anode Durability for Water Oxidation in Alkaline Electrolytes.” in preparation. Adapted for Chapter 4.
P. B. participated in the conception of the project, prepared the data, and participated in the writing of the manuscript.
Buabthong, P., Becerra-Stasiewicz, N., Mitrovic, S., Lewis, N. S., “Vanadium, Niobium and Tantalum by XPS.” Surface Sci. Spec. (2017) 24, 024001. DOI: 10.1116/1.4998018.
P. B. participated in the conception of the project, prepared the data, and participated in the writing of the manuscript.
Yu, W., Buabthong, P., Read, C. G., Dalleska, N. F., Lewis, N. S., Lewerenz, H.-J., Gray, H. B., Brinkert, K. “Cathodic NH4+ Leaching of nitrogen impurities in CoMo thin-film electrodes in aqueous acidic solutions.” Sustainable Energy Fuels, 2020, 4, 5080-508.
DOI: 10.1039/D0SE00674B.
P. B. participated in the conception of the project, collected and analyzed XPS data, and participated in the writing of the manuscript.
Fu, H. J., Moreno-Hernandez, I., Buabthong, P., Papadantonakis, K. M., Brunschwig, B.
S., Lewis, N. S. “Enhanced stability of silicon for photoelectrochemical water oxidation through self-healing enabled by an alkaline protective electrolyte.” Energy Environ. Sci., (2020), 13, 4132-4141. DOI: 10.1039/D0EE02250K.
P. B. collected and analyzed XPS data and participated in the discussion of the project, Read, C. G., Buabthong, P., “Growth and characterization of single-crystalline oxynitride materials for solar fuels production.” in preparation. Adapted for Appendix A.
XPS data.
Yu, W., Richter, R. H., Buabthong, P., Moreno-Hernandez, I., Read, C. G., Simonoff, E., Papadantonakis, K. M., Brunschwig, S. B., Lewis, N. S. “The Stability of InP Photocathode for Solar-driven Hydrogen Evolution in Aqueous Acidic and Alkaline Electrolyte.”
in preparation.
P. B. participated in the conception and discussion of the project, collected and analyzed XPS data.
TABLE OF CONTENTS
Acknowlegements ... iii
Abstract ... v
Published Content and Contributions ... vi
Table of Contents ... viii
Nomenclature ... xi
Chapter 1: Introduction ... 1
Global energy demand ... 1
Solar energy ... 1
Solar fuel conversion system ... 2
Stability of semiconductor electrodes ... 5
Protective coatings ... 6
Contents of this thesis ... 8
References ... 9
Chapter 2: Corrosion of CdTe and ZnTe for HER ... 12
Abstract ... 13
Introduction ... 14
Results ... 16
Dissolution of n-CdTe and n-ZnTe ... 16
Surface compositions of n-CdTe and n-ZnTe ... 22
Corrosion behaviors of Pt-coated n-CdTe and n-ZnTe ... 24
Corrosion behaviors of TiO2-coated n-ZnTe ... 25
Discussion ... 27
Conclusion ... 33
References ... 35
Supporting Information ... 39
Experimental Methods ... 39
Supporting Figures ... 42
Chapter 3: Pinholes in ALD Amorphous TiO2 ... 45
Abstract ... 46
Introduction ... 47
Results and Discussion ... 49
Corrosion of p+-GaAs/a-TiO2 ... 49
Electroless deposition of Au ... 53
Pinholes formed during a-TiO2 deposition ... 56
Pinholes formed during electrochemical operation ... 59
Conclusions ... 67
Experimental Methods ... 68
References ... 73
Supporting Information ... 77
Estimate of time to etch through GaAs wafer ... 77
Dissolution of TiO2 ... 77
(SEM) ... 78
Supporting Figures ... 79
Chapter 4: Evolution of Pinholes and GaAs Micro-islands ... 84
Abstract ... 85
Introduction ... 86
Results and Discussions ... 87
Crystallinity of amorphous a-TiO2 ... 87
Fabrication of micro-island GaAs structures ... 87
Formation of pinholes during electrochemistry ... 89
TiO2 dissolution as the origin of the pinholes ... 92
Conclusions ... 94
References ... 95
Supporting Information ... 98
Experimental Methods ... 98
Materials and chemicals ... 98
Preparation of substrates ... 98
Atomic layer deposition (ALD) of TiO2 thin films ... 98
Radio-frequency sputtering deposition ... 99
Electrode fabrication ... 99
Scanning electron microscopy ... 99
TiO2 dissolution ... 100
Inductively-coupled plasma mass spectroscopy ... 100
X-ray photoelectron spectroscopy ... 101
Electrochemical characterization ... 101
Raman spectroscopy methods ... 101
Detailed Fabrication Procedures ... 102
General Considerations on the Overall Fabrication Processes ... 102
Etching ... 103
Thinning ... 103
Assembling with p+-Si substrates ... 104
PDMS coating ... 104
Image Processing ... 104
Supporting figures ... 106
References ... 111
Chapter 5: Conclusions ... 112
Future Directions ... 113
Appendix: Oxynitrides ... 114
Introduction ... 114
TaON fabrication ... 115
LaTiON fabrication ... 116
Oxide single-crystal synthesis ... 116
Oxynitride conversion ... 116
Charaterizations ... 116
AFM. Atomic force microscopy CA. Chronoamperometry CB. Conduction band CV. Cyclic voltammetry Eg. Band gap energy
HER. Hydrogen evolution reaction
Hg/HgO. Mercury-mercury oxide electrode Hg/HgS. Mercury-mercurous sulfate electrode
ICP-MS. Inductively coupled plasma mass spectrometry n++. Degenerately-doped n-type material
n+. highly-doped n-type material OER. Oxygen evolution reaction
p++. Degenerately-doped p-type material p+. highly-doped p-type material
OCV. Open-circuit voltage
RHE. Reversible hydrogen electrode. The reversible potential for HER SCE. Saturated calomel electrode
SEM. Scanning electron microscopy VB. Valence band
XPS. X-ray photoelectron spectroscopy
C h a p t e r 1
INTRODUCTION
Global energy demand
The global energy demand has been rising since the Industrial Revolution mostly because of population growth and modernization of developing countries. The current energy demand is expected to continue to increase in the next decades.1 Currently, the majority of the global energy supply rely on burning fossil fuels, detrimental to the environment.
Since the Industrial Revolution, the anthropogenic greenhouse gas emission has been observed to increase at 2.2 %/year from 2000 to 2010 and will likely continue to increase at a higher rate; the majority of the greenhouse gas was reported to come from CO2 emission from the industrial processes.2 At the current emission rate, the atmospheric CO2 concentration is predicted to exceed 550 ppm in 2100.3 The increasing CO2
concentration is found to have a strong correlation in the increase in the average temperature change.1,3 Out of all anthropogenic CO2, ~30 % will also be absorbed by the ocean, causing ocean acidification which is detrimental to marine organisms.1
Although CO2 is the most prominent air contaminant from fossil fuel combustion, sulfur and nitrogen in fossil fuels can also release SO2 and NOx pollutants. These pollutants react with atmospheric water vapor and other gases to form fine particulate matter (PM2.5), which is one of the main causes of severe air pollution in major cities.
Solar energy
To sustainably meet the increasing global energy demand, clean, renewable, and abundant energy source is needed. Solar energy is one of the most promising candidates.4 The terrestrial solar energy flux is ~36,000 TW,5 substantially higher than other renewable
options, namely, hydro, geothermal, and wind energy.6 Nevertheless, energy storage is still needed for the solar energy to reliably meet the daily energy demand. Figure 1.1 shows the net load, which is calculated by taking the forecasted load and subtracting the forecasted electricity production from renewable energy sources (wind and solar). When there is an excess supply during the morning, the electricity grid would face a risk of potential overgeneration. On the other hand, in the evening where solar energy is not available, the grid would require energy from other sources.
Figure 1.1. Net load (energy demand subtracted by energy supply) of renewable energy source. (reproduced)7
Solar fuel conversion system
Lithium-ion batteries or redox flow batteries offer a possible solution to energy storage, yet they are challenging to implement because of high cost and low performance for large-scale application. On the other hand, chemical fuels, including hydrogen (H2), have higher energy density and potentially lower cost of production. Solar fuels conversion system is one of the options to directly convert solar energy into chemical bonds. The work in this thesis focuses on photoelectrochemical (PEC) water-splitting, but the principles are also applicable to other solar fuels production, including CH4, C2H4, CH3OH.
The reaction for water-splitting (Eq. 1.1) has a free energy requirement of ∆G = 237.2 kJ mol-1, which corresponds to ∆E° 1.23 V per electron.
2H2O(l) à 2H2(g) + O2(g) (Eq. 1.1) In acidic solutions, the following half-reactions are expected:
2H+ + 2e- à H2(g) (Eq. 1.2)
2H2O(l) à O2(g) + 4H+ + 4e-. (Eq. 1.3) In alkaline solutions, the following half-reactions are expected
2H2O(l) + 2e- à H2(g) + 2OH- (Eq. 1.4) 4OH-(aq) à O2(g) + 2H2O(l) + 4e- (Eq. 1.5) here, Eq. 1.2 and Eq. 1.4 correspond to oxygen evolution reactions (OER) and Eq. 1.3 and Eq. 1.5 correspond to hydrogen evolution reactions (HER).
One of the prominent PEC water-splitting system designs focused on in this work consists of semiconducting light-absorber electrodes with cathodes and anodes doing HER and OER, respectively. In a PEC device, at least one of the electrodes is a semiconductor material which can generate carriers. Upon illumination, an electron-hole pair is generated and driven by the potential gradient in the semiconductor materials to their respective side of the device (Fig. 1.2). In order to drive the water-splitting reaction (Eq. 1.1), the electron- hole pair would need to have at least 1.23 eV for the minimum thermodynamic requirement. Nevertheless, in a practical solar fuels device, pH difference, solution resistance, or non-radiative recombination reduce the electron-hole pair energy, thus requiring the light-absorbers to provide the voltage higher than the thermodynamic minimum.8
Figure 1.2. Schematics of the band alignment of a semiconductor in acid. (reproduced from Royal Society of Chemistry, RSC)9
In order to supply sufficient potential, the semiconducting materials must have large bandgaps, typically ~2.2 eV. However, materials with a 2.2 eV bandgap only absorb a small portion of the solar spectrum (Fig. 1.3). Instead of single-layer light-absorbing materials, tandem device structures can be utilized to allow for broader absorption while providing enough potential to drive the water-splitting reaction. One of the bandgap combinations for a tandem device is with a 1.7 eV bandgap top-cell and a 1.1 eV bandgap bottom-cell.8 Silicon (Si) is one of the most promising materials for the bottom cell because of its 1.1 eV bandgap, suitable band edge position, as well as established fabrication processes. The suitable top-cell with 1.7 eV bandgap still needs further development.
Figure 1.3. AM1.5 G irradiation (100 mW cm-2) with the shaded areas corresponding to the absorption upperbound of semiconductors with 2.3-eV, 1.7-eV, and 1.1-eV bandgap.
Stability of semiconductor electrodes
One of the major impediments for realizing practical solar fuels devices is their stability under operation.10 Since the devices typically need to operate under corrosive strong acid or strong alkaline electrolyte, the solar fuel devices typically have operational stability in an order of 1,000 to 10,000 of hours.11 Unlike corrosion behaviors of metals, the corrosion mechanisms of semiconductor electrodes are still lacking.
A general framework for defining stability of photoelectrodes is outlined in Fig. 1.4a, based on the relative energy levels of conduction band (CB) edge and the potentials of cathodic corrosion and solvent reduction (HER).12,13 If a competition for photogenerated electrons exists for cathodic corrosion reaction and HER (quasi-stable, type b), the semiconductor stability will be critically determined by the position of the quasi Fermi level (Eqf) or the kinetic over-potential. If the cathodic corrosion is thermodynamically more difficult compared with the HER, the semiconductor photocathode can be kinetically stabilized against cathodic corrosion by selectively steering all photogenerated electrons to perform HER. This framework also applies to OER where
the energetic levels between the semiconduction decomposition and OER need to compete for the generated holes. Manipulating the energetics at this semiconductor-electrolyte interface may allow for a stable device from otherwise thermodynamically unstable materials. For example, catalyst loading on the electrode’s surface may lower the band edge such that HER is more energetically favorable than the decomposition of the semiconductors (Fig. 1.4b). Understanding the kinetic effects towards the semiconductor corrosion will not only be useful for validating this framework, but also expand our fundamental understanding on stabilization of practical solar fuels devices.
Figure 1.4. Band alignment diagram outlining different corrosion behaviors (a) General framework for defining the photocathode stability (p-type semiconductor) based on the relative energetic positions of the conduction band (ECB), decomposition potential (Edecomp), and solvent reduction (Esolv). Three types of photocathodes can be classified: (i) Stable: Edecomp<ECB<Esolv; (ii) quasi-stable: ECB<Edecomp<Esolv; (iii) unstable: ECB<Esolv<
Edecomp. (Adapted from Gerischer et al12) (b) Proposed kinetic effects of HER catalysts over the semiconductor stability for the quasi-stable type.
Protective coatings
Instead of developing materials that are intrinsically stable under operation, applying protective coatings to the electrodes is also another promising way to increase the overall stability of the solar fuels devices. Since the generated electrons/holes need to reach the electrode surface to evolve oxygen/hydrogen, the main requirement for the protective
coatings of solar fuels devices is to provide electronic conductivity while separating the semiconductors from the electrolyte and providing sufficient transmission of the light to the underlying substrates. Although protective coatings are needed for both photoanodes and photocathodes, this work focuses on the protection for photoanodes as the anodes are typically prone to both passivation and decomposition because of the higher applied oxidative potential at the anode side.
Amorphous TiO2 (a-TiO2) grown by atomic layer deposition (ALD) is one of the promising protective layers for photoanodes.14 These a-TiO2 films mitigate parasitic absorbance due to a large band gap (3.3 eV), prevent corrosion due to the stability of a- TiO2 in alkaline and acidic media, and can maintain ohmic contact with the solution even with 100 nm thick films due to interaction of a Ti3+ defect band with metal catalysts.14–16 PEC systems incorporating an a-TiO2 protection layer have been demonstrated to be stable for hundreds of hours in both alkaline and acidic media.11
Although a-TiO2 film has been shown to increase the stability of the devices under operation, the failure modes for the film are still not fully understood. Microscopic defects and pinholes have been hypothesized to be the dominating attribution to the device failure.11,14,17–19 These pinholes are especially detrimental to non-passivating substrates such as III-V or II-VI semiconductors, since any exposure of the substrate to the electrolyte would rapidly corrode the underlying electrodes.17 Understanding the origins and the evolution of these pinholes on a-TiO2 would allow for better corrosion mitigation techniques and eventually realizing stable solar fuels devices.
Contents of this thesis
In this thesis, intrinsic stability and corrosion mechanisms of CdTe and ZnTe under conditions for HER are presented. Failure modes of ALD a-TiO2 films are investigated and fabrication processes for GaAs micro-island structures are developed to accompany defect isolation in the a-TiO2 films.
• In Chapter 2, chemical and electrochemical corrosion behaviors of CdTe and ZnTe cathodes are presented. The effects of Pt catalysts and a-TiO2 are also discussed.
• In Chapter 3, short-term failure modes of GaAs anodes coated a-TiO2 is presented.
The correlation between atmospheric particulates and microscopic pinholes on the as-deposited a-TiO2 is discussed. Simulation of the corrosion front at the exposed GaAs substrates is also provided.
• In Chapter 4, fabrication procedures for GaAs micro-island structures are presented The evolution of new pinhole sites developed from defect spots in the a-TiO2 film is discussed.
• In Appendix, preliminary results for the growth of oxynitride films for corrosion studies is presented.
References
(1) IEA. World Energy Outlook 2020; Paris, 2020.
(2) Pachauri, R. K.; Meyer, L. A. Climate Change 2014: Synthesis Report. Contribution of Working Groups I, II and III to the Fifth Assessment Report of the Intergovernmental Panel on Climate Change; 2015.
(3) Karl, T. R.; Melillo, J. M.; Peterson, T. C. Global Climate Change Impacts in the United States; 2009.
(4) Lewis, N. S. Research Opportunities to Advance Solar Energy Utilization. Science (80-. ). 2016, 351 (6271). https://doi.org/10.1126/science.aad1920.
(5) Jiang, C.; Moniz, S. J. A.; Wang, A.; Zhang, T.; Tang, J. Photoelectrochemical Devices for Solar Water Splitting – Materials and Challenges. Chem. Soc. Rev.
2017, 46 (15), 4645–4660. https://doi.org/10.1039/C6CS00306K.
(6) Murphy, P. Solar Update, in Solar Heating and Cooling Programme. 2020.
(7) California Independent System Operator. Renewable Fast Facts; 2016.
(8) Hu, S.; Xiang, C.; Haussener, S.; Berger, A. D.; Lewis, N. S. An Analysis of the Optimal Band Gaps of Light Absorbers in Integrated Tandem Photoelectrochemical Water-Splitting Systems. Energy Environ. Sci. 2013, 6 (10), 2984.
https://doi.org/10.1039/c3ee40453f.
(9) Walter, M.; Warren, E. Solar Water Splitting Cells. Chem. Rev. 2010, 110, 6446–
6473.
(10) Tan, M. X.; Laibinis, P. E.; Nguyen, S. T.; Kesselman, J. M.; Stanton, C. E.; Lewis, N. S. Principles and Applications of Semiconductor Photoelectrochemistry. In Progress in Inorganic Chemistry; John Wiley & Sons, Inc., 1994; pp 21–144.
https://doi.org/10.1002/9780470166420.ch2.
(11) Bae, D.; Seger, B.; Vesborg, P. C. K.; Hansen, O.; Chorkendorff, I. Strategies for Stable Water Splitting via Protected Photoelectrodes. Chem. Soc. Rev. 2017, 46 (7), 1933–1954. https://doi.org/10.1039/C6CS00918B.
(12) Gerischer, H.; Mindt, W. The Mechanisms of the Decomposition of Semiconductors
by Electrochemical Oxidation and Reduction. Electrochim. Acta 1968, 13 (6), 1329–
1341. https://doi.org/10.1016/0013-4686(68)80060-X.
(13) Gerischer, H. Electrolytic Decomposition and Photodecomposition of Compound Semiconductors in Contact with Electrolytes. J. Vac. Sci. Technol. 1978, 15 (4), 1422–1428. https://doi.org/10.1116/1.569800.
(14) Hu, S.; Shaner, M. R.; Beardslee, J. A.; Lichterman, M.; Brunschwig, B. S.; Lewis, N. S. Amorphous TiO2 Coatings Stabilize Si, GaAs, and GaP Photoanodes for Efficient Water Oxidation. Science 2014, 344 (6187), 1005–1009.
https://doi.org/10.1126/science.1251428.
(15) Hu, S.; Richter, M. H.; Lichterman, M. F.; Beardslee, J.; Mayer, T.; Brunschwig, B.
S.; Lewis, N. S. Electrical, Photoelectrochemical, and Photoelectron Spectroscopic Investigation of the Interfacial Transport and Energetics of Amorphous TiO2/Si Heterojunctions. J. Phys. Chem. C 2016, 120 (6), 3117–3129.
https://doi.org/10.1021/acs.jpcc.5b09121.
(16) Nunez, P.; Richter, M. H.; Piercy, B. D.; Roske, C. W.; Cabán-Acevedo, M.;
Losego, M. D.; Konezny, S. J.; Fermin, D. J.; Hu, S.; Brunschwig, B. S.; Lewis, N.
S. Characterization of Electronic Transport through Amorphous TiO 2 Produced by Atomic Layer Deposition. J. Phys. Chem. C 2019, 123 (33), 20116–20129.
https://doi.org/10.1021/acs.jpcc.9b04434.
(17) Verlage, E.; Hu, S.; Liu, R.; Jones, R. J. R.; Sun, K.; Xiang, C.; Lewis, N. S.;
Atwater, H. A. A Monolithically Integrated, Intrinsically Safe, 10% Efficient, Solar- Driven Water-Splitting System Based on Active, Stable Earth-Abundant Electrocatalysts in Conjunction with Tandem III–V Light Absorbers Protected by Amorphous TiO2 Films. Energy Environ. Sci. 2015, 8 (11), 3166–3172.
https://doi.org/10.1039/C5EE01786F.
(18) Ros, C.; Carretero, N. M.; David, J.; Arbiol, J.; Andreu, T.; Morante, J. R. Insight into the Degradation Mechanisms of Atomic Layer Deposited TiO2 as Photoanode Protective Layer. ACS Appl. Mater. Interfaces 2019, 11 (33), 29725–29735.
https://doi.org/10.1021/acsami.9b05724.
(19) Yu, Y.; Sun, C.; Yin, X.; Li, J.; Cao, S.; Zhang, C.; Voyles, P. M.; Wang, X.
Metastable Intermediates in Amorphous Titanium Oxide: A Hidden Role Leading to Ultra-Stable Photoanode Protection. Nano Lett. 2018, 18 (8), 5335–5342.
https://doi.org/10.1021/acs.nanolett.8b02559.
C h a p t e r 2
CHEMICAL AND ELECTROCHEMICAL CORROSION BEHAVIORS OF CdTe AND ZnTe ELECTRODES UNDER CONDITIONS RELEVANT
FOR HYDROGEN EVOLUTION REACTION
The following chapter discusses the chemical and electrochemical corrosion of CdTe and ZnTe substrates.
Content in this chapter is drawn from the following publication:
• Buabthong, P., Jiang, J., Yu, W., Moreno-Hernandez, I., Papadantonakis, K. M., Brunschwig, B. S., Lewis, N. S. “Chemical and Electrochemical Corrosion Behaviors of CdTe and ZnTe Electrodes under Conditions Relevant for Hydrogen Evolution Reaction.” In preparation.
Abstract
The corrosion behaviors of CdTe and ZnTe electrodes for hydrogen evolution reaction (HER) were studied in 1.0 M H2SO4 (aq) and 1.0 M KOH (aq) under applied potential as -100 mV vs. RHE and under open-circuit potential (OCV). Chemical corrosion was observed in both CdTe and ZnTe in acidic solution with the corrosion rate of 0.33 nm hr-1 and 0.10 nm hr-1 for CdTe under biased and under OCV, and 11 nm hr-1 for ZnTe in both conditions. Reduction of Cd2+ was found to be the primary pathway of CdTe corrosion in alkaline solution. Both oxidation of Te2- and reduction of Zn2+ were found to be the main corrosion pathway for ZnTe. Corrosion of CdTe in alkaline media can be mitigated by applying a thin Pt catalyst layer to compete with the reductive corrosion reaction. However, protective coating is needed to reduce the dissolution of ZnTe in the alkaline solution.
Introduction
Photoelectrochemical (PEC) water-splitting is one of the attractive ways to store solar energy into clean hydrogen fuels. Nevertheless, degradation of semiconductor photoelectrodes is a well-known impediment to implementing efficient and practical solar fuels systems.1,2 A great deal of information is available about the corrosion and passivation processes that lead to failure of photoanodes3,4, and much less is defined about the behavior of photocathodes, except for largely phenomenological observations of limited (seconds-hours) lifetimes of such systems in aqueous media.5–7
Silicon (Si) is one of the promising candidates for photoelectrodes, due to its small band gap, a suitable band edge position, and earth abundance.8 Extensive efforts have been made to protect Si photoelectrodes in acid and base.6,7,9 Recent developments provide a new opportunity to more fully understand, control, and mitigate failure of a variety of photoelectrodes for solar fuels production. Of specific interest are II-VI semiconductors such as CdTe and ZnTe, whose band gaps can be tuned by alloying, and pair well with stabilized Si photoanodes to potentially produce high-efficiency (>20% solar-to-hydrogen) tandem photoelectrochemical cells.8
CdTe and ZnTe have been demonstrated as photocathodes in photoelectrochemical fuels production system.10–12 The stability of CdTe and ZnTe under hydrogen evolution reaction have been studied but only to a limited extent where the device degradation was inferred from the decrease in photocurrent density.10,13 The Pourbaix diagrams of CdTe and ZnTe can help provide theoretical guidelines for thermodynamic stability of the electrodes.
However, experimental validation is still needed to confirm these thermodynamic predictions. Additionally, investigations of the corrosion kinetics of CdTe and ZnTe photoelectrodes are still needed in order to fully understand the corrosion behaviors and evaluate the usability of CdTe and ZnTe, or CdZnTe as potential semiconductor materials for stable photocathodes.
Herein, we describe the chemical and electrochemical corrosion behaviors of dark n-CdTe and n-ZnTe electrodes, biased at conditions relevant for hydrogen evolution
reaction (HER). The corrosion reactions of each condition were inferred from a comprehensive observation of the systems, namely, product dissolution, surface chemistry, and the morphology of the electrodes. We also examined the effect of Pt catalysts and thin TiO2 protective coatings on the stability of CdTe and ZnTe electrodes.
Results
Dissolution of n-CdTe and n-ZnTe
The corrosion mechanism of n-type semiconductors (n-SC), n-CdTe and n-ZnTe electrodes were tested at -100 mV vs. reversible hydrogen electrode (RHE). This primary potential (E) of interest is determined by the overpotential (η) of an active electrocatalyst (such as noble metals and metal phosphides) required to drive a current density (J) of 10 mA cm-2.14 The position of the surface potential or quasi Fermi-level (Eqf) of an illuminated p-type semiconductor (p-SC) photoelectrode, in the presence of HER catalyst, should closely follow that of an n-SC electrode held at -0.1 V vs. RHE in the dark (Fig. S2.1).
Hence, the thermodynamic environments regulating the semiconductor stability should be similar at the front surfaces of an n-SC in the dark and an illuminated p-SC with HER catalysts. Dark experiments moreover allow for probing the mechanism of semiconductor’s intrinsic corrosion under well-controlled conditions of HER (E~-100 mV vs. RHE), by eliminating any variation in the photoelectrochemical (PEC) response of illuminated electrode. Hence, these dark experiments will provide valuable insights into how the corrosion or dissolution of semiconductors under HER conditions correlates with the thermodynamic predictions from the Pourbiax diagrams.
Chronoamperometry profiles of both n-CdTe and n-ZnTe biased at -100 mV vs.
RHE in both 1.0 M H2SO4(aq) and 1.0 M KOH(aq) in the dark exhibit very small current densities as shown in a representative Fig. S2.2. The current densities stayed in the magnitude of μA cm-2 range.
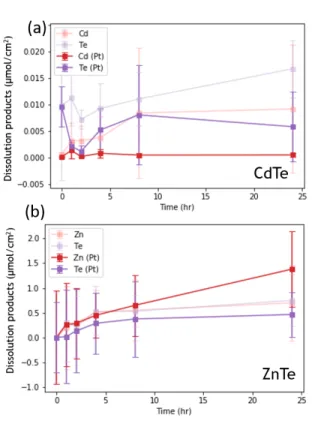
Figure 2.1a shows the total dissolution product as a function of time of n-CdTe electrodes in the dark biased at -100mV vs. RHE (“CA”, red) and under OCV (purple) in H2(g)-saturated 1.0 M H2SO4(aq) over 24 hours. The dissolution of each electrode was normalized to the electrode areas. The error bars represent variations between three electrochemical runs. The total dissolution concentrations are similar for both CA and
OCV. The dissolution in the first hour increased substantially from zero to
~0.05 µmol cm-2, then continued to increase at a much slower rate after 2 hours, and increased to the maximum of ~0.05 µmol cm-2 at 24 hours. Figure 1b shows the dissolution rate of Cd and Te species H2(g)-saturated 1.0 M H2SO4(aq), measured after the initial spike in the first hour. Cd and Te dissolution was ~0.8 µmol cm-2 hr-1 and ~0.4 µmol cm-2 hr-1 for the samples held under -100 mV vs. RHE, respectively. On the other hand, Cd and Te dissolution was ~0.4 µmol cm-2 hr-1 and ~0.8 µmol cm-2 hr-1 for the samples held under OCV.
Figure 2.1. Dissolution products of CdTe (a,c) Concentrations of dissolved Cd, Te species in the working compartment biased at -100 mV vs. RHE and OCV in the dark over 24 hours, normalized to the electrode area in H2(g)-saturated (a) 1.0 M H2SO4(aq) and (b) 1.0 M KOH(aq). (b, d) the dissolution rate measured after the initial dissolution in the first hour for the n-CdTe electrodes in (b)1.0 M H2SO4(aq) and (d) 1.0 M KOH(aq).
Figure 2.1c shows the total dissolution product as a function of time of n-CdTe electrodes in the dark biased at -100mV vs. RHE (“CA”, red) and under OCV (purple) in H2(g)-saturated 1.0 M KOH(aq) over 24 hours. The total dissolution concentrations are higher for the sample held under open-circuit potential, which increased substantially from zero to ~0.08 µmol cm-2 within the first hour, then continued to increase at a much slower rate after 2 hours. On the other hand, in the total dissolution for the samples held under -100mV vs. RHE, no initially dissolution spike was observed. Nevertheless, the total dissolution gradually increased to ~0.2 µmol cm-2 after 24 hours. Figure 2.1d shows the dissolution rate of Cd and Te species in H2(g)-saturated 1.0 M KOH(aq) measured after the initial spike in the first hour. For the samples held under -100mV vs. RHE, both Cd and Te dissolution rates were similar at ~0.25 µmol cm-2 hr-1. However, for the samples at open- circuit potential, the Te dissolution rate was substantially higher at ~1.5 µmol cm-2 hr-1 compared to that of Cd at ~0.08 µmol cm-2 hr-1.
Similarly, ZnTe electrodes were tested under -100mV vs. RHE and OCV while monitoring the dissolution products in the working-electrode compartment. Figure 2.2a shows the total dissolution product as a function of time of n-ZnTe electrodes in the dark biased at -100mV vs. RHE (“CA”, red) and under OCV (purple) in H2(g)-saturated 1.0 M H2SO4(aq) over 8 hours. The total dissolution concentrations are similar for both the samples held under open-circuit potential and held at -100mV vs. RHE. Unlike n-CdTe samples, no initial spikes were observed in the first hour; the dissolutions for n-ZnTe samples linearly increased from zero to 1.5 µmol cm-2 at 8 hours. Figure 2.2b shows the dissolution rate of Zn and Te species in H2(g)-saturated 1.0 M H2SO4(aq). Since the dissolution products increased linearly from the start, the rates were calculated from the whole time span of the electrochemical experiments. For all samples, both Zn and Te dissolution rates were similar at ~0.07 µmol cm-2 hr-1.
Figure 2.2. Dissolution products of ZnTe (a,c) Concentrations of dissolved Zn, Te species in the working compartment biased at -100 mV vs. RHE and OCV in the dark over 24 hours, normalized to the electrode area in H2(g)-saturated (a) 1.0 M H2SO4(aq) and (b) 1.0 M KOH(aq). (b, d) the dissolution rate for the n-ZnTe electrodes in (b)1.0 M H2SO4(aq) and (d) 1.0 M KOH(aq).
Figure 2.2c shows the total dissolution product as a function of time of n-ZnTe electrodes in the dark biased at -100mV vs. RHE (“CA”, red) and under OCV (purple) in H2(g)-saturated 1.0 M KOH(aq) over 8 hours. Similarly to the samples in 1.0 M H2SO4(aq), no initial spikes were observed in the first hour. Nevertheless, the total dissolution for the samples under OCV was slightly higher, increasing linearly from 0 to ~1.75 µmol cm-2 after 8 hours. The total dissolution concentration for the samples held at -100mV vs. RHE linearly increased from 0 to 1.0 µmol cm-2 at 8 hours. Figure 2.2d shows the dissolution rate of Zn and Te species in H2(g)-saturated 1.0 M KOH(aq). Since the dissolution products
increased linearly from the start, the rates were calculated from the whole time span of the experiments. Both Zn and Te dissolution rates were similar at ~0.08 µmol cm-2 hr-1 for the samples held under -100mV vs. RHE. On the other hand, the Zn dissolution rate was substantially higher in the samples under OCV at ~0.20 µmol cm-2 hr-1 compared to
~0.01 µmol cm-2 hr-1 for Te.
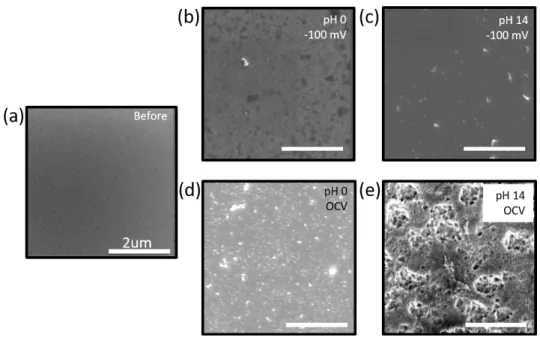
After the electrochemical experiments, all samples were inspected under a scanning electron microscope (SEM) for changes in the surface morphology. Figure 2.3 shows the SEM images of the n-CdTe electrodes (a) before and (b-e) after electrochemical testing.
Before the experiments, the n-CdTe electrode had a smooth surface. After being tested for 24 hours under -100mV vs. RHE, the n-CdTe showed small amounts of pits and material deposits (Fig. 2.3b,c). The n-CdTe electrode tested in 1.0 M H2SO4(aq) (Fig. 2.3b) showed more pits than the one tested in 1.0 M KOH(aq) (Fig. 2.3c). Nevertheless, both surfaces did not show substantial etched pits. In contrast, n-CdTe samples tested under open-circuit potential contained higher morphology changes. The sample tested in 1.0 M H2SO4(aq) contained many microscopic deposits on the surface (Fig. 2.3d). The sample tested under OCV in 1.0 M KOH (aq) had etched pits throughout the surface (Fig. 2.3e).
Figure 2.3. SEM images of n-CdTe electrodes (a) before test, and (b-e) after the chronoamperometry (b) biased at -100 mV vs. RHE in the dark over 24 hours in 1.0 M H2SO4(aq), (c) biased at -100 mV vs. RHE in the dark over 24 hours in 1.0 M KOH(aq), (d) under OCV in 1.0 M H2SO4(aq), and (e) under OCV in 1.0 M KOH(aq).
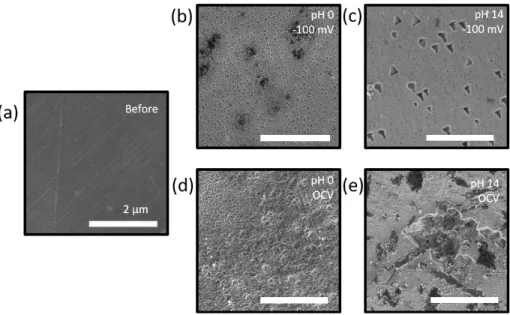
Figure 2.4 shows SEM images of the n-ZnTe electrodes (a) before and (b-e) after electrochemical testing. Before the experiments, the n-CdTe electrode had a relatively smooth surface, but still contained microscopic stripes on the surface which are most likely a result of wafer polishing (Fig. 2.4a). All n-ZnTe samples after testing contained some amount of etched pits at varying degrees. After being tested for 8 hours under -100mV vs.
RHE in 1.0 M H2SO4(aq), the sample developed triangular etched pits thoughout the surface (Fig. 2.4b). The sample tested under applied bias, but in 1.0 KOH (aq) showed fewer numbers of triangular etched pits, but with slightly larger in depth and lateral size (Fig. 2.4c). The sample tested under OCV in 1.0 M H2SO4(aq) mostly corroded uniformly throughout with no preferred etched orientation (Fig. 2.4d). The sample tested under OCV in 1.0 KOH (aq) also etched uniformly without any preferred orientation with more particle deposits on the surface.
Figure 2.4. SEM images of n-ZnTe electrodes (a) before test, and (b-e) after the chronoamperometry (b) biased at -100 mV vs. RHE in the dark over 24 hours in 1.0 M H2SO4(aq), (c) biased at -100 mV vs. RHE in the dark over 24 hours in 1.0 M KOH(aq), (d) under OCV in 1.0 M H2SO4(aq), and (e) under OCV in 1.0 M KOH(aq).
Surface compositions of n-CdTe and n-ZnTe
After the electrochemical operation, the electrodes were disassembled and transferred ex-situ to the loading chamber for x-ray photoelectron spectroscopy (XPS).
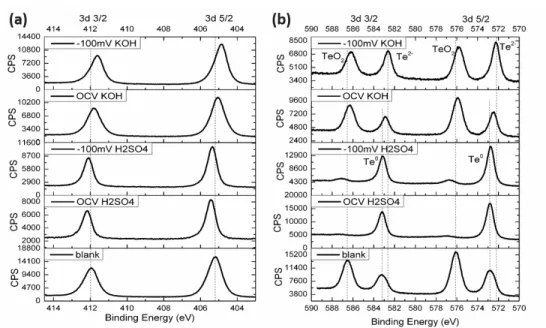
Figure 2.5 shows the Cd 3d (Fig. 2.5a) and Te 3d (Fig. 2.5b) XPS peaks of n-CdTe electrodes (dark) before and after 24-hour electrochemical tests at different conditions. No substantial changes were observed in the Cd 3d spectra. Some shifts in Te 3d peaks were observed. However, the shifts were reported to be very small relative to regular XPS shifts.15 Before test, n-CdTe showed an elemental Te 3d 5/2 component at 572.8 eV, an elemental Te 3d 3/2 component at 583.1 eV, and a 3d 5/2 peak at 576.1 eV and a 3d 3/2 peak at 586.5 eV corresponding to TeO2. For the samples tested under OCV in 1.0 M H2SO4(aq), the TeO2 peaks are gone, with only the elemental Te peaks remaining. After biased at -100 mV vs. RHE in 1.0 M H2SO4(aq), the surface contained small amounts of
TeO2 peaks and Te0, similarly to the one before testing. In 1.0 M KOH(aq), the TeO2 peaks remained in both applied potential and OCV cases. Nevertheless, new peaks at 572.2 eV, corresponding to Te2-, also arose in both conditions. Besides the TeO2 peaks, the n-CdTe after OCV in 1.0 M KOH(aq) had a Te 3d 5/2 peak at 572.5 eV and a Te 3d 3/2 peak at 583.0 eV which correspond to Te0 and Te2-.
Figure 2.5. XPS of (a) Cd 3d, (b) Te 3d peaks of n-CdTe electrodes (dark). From top to bottom: after 24 hours biased at -100 mV vs. RHE in H2(g)-saturated 1.0 M KOH(aq);
after 24 hours left at open circuit voltage in H2(g)-saturated 1.0 M KOH(aq); after 24 hours biased at -100 mV vs. RHE in H2(g)-saturated 1.0 M H2SO4(aq); after 24 hours left at open circuit voltage in H2(g)-saturated 1.0 M H2SO4(aq); before electrochemical test.
Similarly, n-ZnTe samples were transferred ex-situ to the loading chamber after testing. The Zn 2p XPS peaks were reported to contain little shift between each species.16 Therefore, only Te 3d peaks were used for the analysis of the surface compositions of n-ZnTe samples. Figure 6 shows Te 3d XPS spectra for the samples tested in (a) 1.0 M H2SO4 (aq) and (b) 1.0 M KOH. For the samples in 1.0 M H2SO4 (aq), Te2- peak and a small amount of Te-O (Te2+) were observed at 577.5 eV and 582 eV, respectively. After 8 hours of electrochemical testing, more oxidative peaks at 582 eV were observed. On the
other hand, all oxidative peaks were reduced and the surface was only left with Te-Zn peak at 577.5 eV for the sample tested under -100 mV vs. RHE (Fig. 2.6a). For 1.0 M KOH (aq), the sample tested under applied potential showed the same surface composition where all the oxide was reduced into the Te-Zn peak. The sample left under OCV, however, contained a slightly shifted Te0 peak at ~579 eV.
Figure 2.6. XPS of Te 3d peaks of n-ZnTe electrodes (dark) tested in (a) 1.0 M H2SO4(aq) and (b) 1.0 M KOH (aq). From top to bottom: after 8 hours biased at -100 mV vs. RHE, after 8 hours under OCV, and before electrochemical operation.
Corrosion behaviors of Pt-coated n-CdTe and n-ZnTe
For an analysis of the catalyst on the electrode’s corrosion, the samples were coated with sputtered 2-nm layer of Pt before the electrochemical operation. Figure 2.7 shows (a) CdTe and (b) ZnTe dissolution concentrations of the samples held at -100 mV vs. RHE in the dark over 24 hours in H2(g)-saturated 1.0 M KOH(aq). The concentrations were normalized to the electrode areas. The light red and light purple in both Fig. 2.7a and Fig. 2.7b represent the concentrations of the sample without Pt coating. For n-CdTe samples, dissolved Cd concentrations decreased from 0.008 μmol cm-2 to ~0 μmol cm-2 after 24 hours of testing. Similarly, dissolved Te concentrations decreased from
0.015 μmol cm-2 to 0.005 μmol cm-2. On the other hand, both Zn and Te dissolution concentrations in the n-ZnTe stayed approximate at the same level (~0.5 μmol cm-2).
Figure 2.7. Dissolution products as a function of time for Pt-coated (a) CdTe and (b) ZnTe samples held at -100 mV vs. RHE in H2(g)-saturated 1.0 M H2SO4 (aq).
Corrosion behaviors of TiO2-coated n-ZnTe
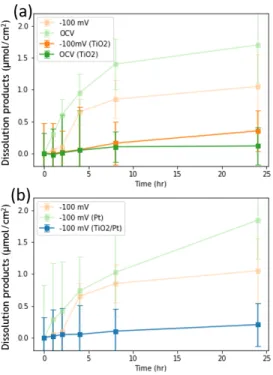
Amorphous a-TiO2 grown with atomic-layer deposition (ALD) was applied to n-ZnTe samples for an analysis of the protection layer. Figure 2.8 shows concentrations of the total dissolution products for a-TiO2-coated n-ZnTe samples. Figure 8a shows the total dissolution products of bare n-ZnTe samples tested under -100 mV vs. RHE (light orange), under OCV (light green), a-TiO2-coated n-ZnTe samples tested under -100 mV vs. RHE (orange), and under OCV (green). Both samples tested under applied bias and OCV showed decreases in the dissolution products after coated with a-TiO2 (Fig. 2.8a).
Additionally, the total dissolution products can be further reduced by applying 2-nm Pt catalyst overlayer after coated with a-TiO2 (Fig. 2.8b).
Figure 2.8. Dissolution of protected ZnTe electrodes (a,c) Concentrations of dissolved Zn, Te species in the working compartment biased at -100 mV vs. RHE and OCV in the dark over 24 hours, normalized to the electrode area in H2(g)-saturated.
Discussion
CdTe has been reported to form a native oxide layer in air, mainly consisting of TeO2 and CdTeO3, and the thickness of native oxide evolves over time.17 Chemical etching can obtain a consistent surface layer, and can decrease the surface roughness and remove structural damage resulting from the mechanical polishing process from factory production of CdTe substrates. Bromine/methanol (Br2/CH3OH) solutions of various concentrations are used as a common etchant.18 During the etching process, Br2 oxidizes the tellurium anions to neutrally charged tellurium, as shown in Equation 1.
(Eq. 2.1)
Br2/CH3OH etching results in an enrichment of elemental Te at the surface.19 The enrichment of Te increases the leakage current20, and the leakage current could potentially lead to a degradation of the semiconductor in photoelectrochemical cells21. Passivating the Br2/CH3OH etched, Te rich surface with hydrogen peroxide can develop a thin insulating oxide layer and minimize the leakage current.22 The reaction is shown in Equations 2.2, 2.3, and 2.4. Similar etching steps were also performed on the n-ZnTe samples to remove any residual native oxide layer. Nevertheless, the enrichment of elemental Te0 was not observed on the n-ZnTe samples (Fig. 6).
(Eq. 2.2)
(Eq. 2.3)
(Eq. 2.4)
To study the electrochemical stability of n-CdTe, the n-CdTe electrodes were biased at -100 mV vs. RHE for 24 hours (Fig. 2.1). Here, the current densities for all the tested electrodes were in a range of ~ 0.01 mA cm-2 in both 1.0 M H2SO4 (aq) and 1.0 M
2- - 0
Br +Te2 ¾¾®2Br +Te
0
2 2 2 2
2H O +Te ¾¾®TeO +2H O
2- +
2 2 2 2
3H O +Te +2H ¾¾®TeO +4H O
2 2 3 2
3H O +CdTe¾¾®CdTeO +3H O
KOH (aq), indicating sluggish HER kinetics on bare n-CdTe and n-ZnTe electrodes in the dark which were expected for bare electrodes without any HER catalysts.
To quantify the faradaic efficiencies of the corrosion, dissolution products were collected during the chronoamperometry measurements and analyzed using Inductively- Coupled Plasma Mass Spectrometry (ICP-MS). If the corrosion reaction was a 2-electron charge transfer corrosion process, the faradaic efficiencies, or the amount of charge transferred in the corrosion process divided by the total amount of charge passed by the potentiostat, would be 2.76% in 1.0 M H2SO4(aq), and 0.94% in 1.0 M KOH(aq) for n-CdTe samples. If the corrosion reaction was a 6-electron corrosion process, then the corrosion faradaic efficiencies would be 8.28% and 2.82%, respectively. These low faradaic efficiencies indicate that if the corrosion was electrochemically driven, then only a small portion of the currents came from corrosion, and most of the currents were going toward HER. The corrosion rates are also in good accord with the dissolution rate of the n-CdTe samples at 0.33 nm/h in 1.0 M H2SO4(aq), and about 0.10 nm/h in 1.0 M KOH(aq), respectively. In the Pourbaix diagram drawn by Zeng, C. et. al.22, CdTe remains stable from pH -2 to 14 between 0 and -0.5 V vs. RHE, and in the Pourbaix diagram drawn by Dremlyuzhenko, S. G. et. al.23, CdTe is in the form of Cd2+ + Te at -100 mV vs. RHE from pH -2 to 2, and in the form of CdTe at -100 mV. vs. RHE at pH 14. Another calculated Pourbaix diagram is plotted in Fig. S2.3, showing similar species in pH 0 and pH 14 ranges.23 The CdTe Pourbaix diagram predicts that at -100 mV vs. RHE, the following reactions should occur between CdTe and H+:
pH 0: CdTe + 2H+ = H2Te + Cd2+. (Eq. 2.5)
Notably, at ~0 V vs. RHE and pH 0, the formation of Te0 via an oxidation of Te2- anions should occur:
pH 0: CdTe + 2H+ = Te0 + Cd2+ + H2 (Eq. 2.6)
At E< -0.5 V vs. RHE, the electrochemical reduction of Cd2+ cations of CdTe into Cd0 should occur:
pH 0: CdTe + 2H+ + 2e- = Cd0 + H2Te. (Eq. 2.7)
For pH 14, a stable region of a CdTe phase slightly overlaps with the region of pH 14 at E<
0 V vs. RHE. For E < -0.1 V vs. RHE, the electrochemical reduction of Cd2+ cations into Cd0 should occur as:
pH 14: CdTe + H2O + 2e-= Cd0 + HTe- +OH-. (Eq. 2.8) Experimentally, the n-CdTe electrode tested under bias at -100 mV vs. RHE in 1.0 M H2SO4 (aq) was less stable than in 1.0 M KOH(aq), both from the dissolution results and the change in the surface morphology (Fig. 2.3). The lower stability of the samples in 1.0 M H2SO4(aq) is likely caused by the Cd2+ ions chemically leaching out from the n-CdTe lattice.
At 0 hour of the blank samples, Cd concentration was close to 0, which agrees with the use of high purity acid or base, confirming no impurity was present in the setup, but Te concentrations were generally higher and contained larger error bars. The larger error is most likely due to both variations in the samples and sensitivity limits of the ICP-MS. In the standard calibration solutions used for ICP-MS, the most diluted standard solution for Cd had a concentration of 0.17 ± 6.1 μg/L, but for Te, it was 0.80 ± 46 μg/L. Since the aloquats for the ICP-MS measurements were diluted to 1/5 of the original concentration, Te errors can be magnified by 5 times to 233.464 μg L-1. Nevertheless, this systematic error is small compared to the differences between the concentrations in different experimental conditions.
Since the corrosion faradaic efficiencies were small, less than 10% from previous calculations, to further investigate if the corrosion is driven by electrochemical reactions or chemical reactions, control samples of n-CdTe electrodes were tested at OCV in H2(g)- saturated 1.0 M H2SO4(aq) and 1.0 M KOH(aq). In 1.0 M H2SO4 (aq), although the total dissolution products are similar for both OCV and applied potential, the dissolution rates for Cd and Te were different. Under applied potential, the dissolution rate for Cd was higher, and under OCV, the dissolution rate Te was higher (Fig. 2.1). The SEM images also show slightly more deposits on the surface after testing on the samples tested under OCV.
Nevertheless, the Te 3d XPS peaks show similar surface composition for both samples.
Thus, Cd2+ likely leached out from the lattice under both conditions. However, on the OCV samples, the surface potential could be sufficiently high to allow dissolved Te to precipitate and form small deposits on the surface (Eq. 2.9). On the other hand, in the samples under applied potential, after Cd2+ was leached, Te ion in the lattice could react with the solution and form H2Te (aq) (Eq. 10). High Te0 in all samples are most likely from the etching step where CdTeO3 from Br2/CH3OH etching and H2O2 treatment (Eq. 2.4) was reduced to Te0 by the negative potential. This is in agreement with the Cd peak shifts in XPS (Fig. 2.5a) and the Te0 on the surface (Fig. 2.5b). TeO2 and CdTeO3 from surface treatment (Eq. 2.3 and Eq. 2.4) dissolved both in OCV and under -100 mV vs. RHE bias, and most of this surface oxide likely dissolved after being in the electrolyte for 1 hour, leading to high dissolution measured by ICP-MS in the first hour.
CdTe(s) + 2H+(aq) ⟷ Cd2+(aq) + Te(s) + H2 (Eq. 2.9) CdTe(s) + 2H+(aq) ⟷ Cd2+(aq) + H2Te(aq) (Eq. 2.10)
In 1.0 M KOH(aq), the dissolution of the samples under OCV was similar to that in 1.0 M H2SO4 (aq), while the dissolution of the samples under applied potential was substantially lower. For the samples held at OCV, almost all of the dissolution came from Te (Fig. 2.1d). The SEM image also shows much rougher morphology after testing for this sample. Unlike the samples in 1.0 M H2SO4, Te 3d XPS peaks representing TeOx still remained after the testing. Hence, under OCV, the samples likely underwent oxidative corrosion, leaching Te2- from the lattice, while leaving Cd to oxidize and form Cd2TeO6(s)
(Eq. 2.11). For the samples held at -100 mV vs. RHE, the dissolution rates for both species were similar. Nevertheless, at this potential, Cd2+ was observed to be reduced to Cd0 (Fig. 2.5). The Te 3d XPS peaks show more Te2- peaks compared to OCV. Hence, in addition to reduction of Cd2+ (Eq. 2.12, 2.14), reduction of residual metallic Te on the surface might also occur (Eq. 2.13).
3CdTe(s)+ 8H2O+4OH- ⟷ Cd3TeO6(s) + 2TeO32-
(aq) + 10H2 (Eq. 2.11)
CdTe(s) + 3OH- ⟷ CdO22-
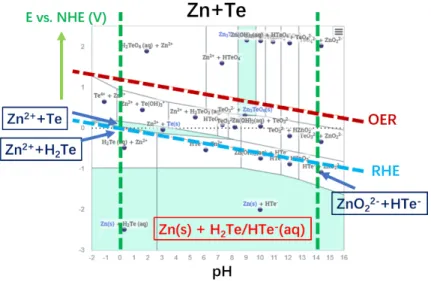
(aq)+HTe-(aq) + H2O (Eq. 2.12) Te(s) + H2 +OH- ⟷ H2O(l) + HTe-(aq) (Eq. 2.13) CdTe(s)+ H2 +OH- ⟷ Cd(s) + HTe-(aq) + H2O (Eq. 2.14) For n-ZnTe, the thermodynamic Pourbaix diagram is plotted in Fig. S2.4.23 The diagram predicts that at E = -0.1 V vs. RHE, the following reactions between ZnTe and H+/OH- should occur:
pH 0: ZnTe + 2H+ = H2Te + Zn2+ (Eq. 2.15) pH 14: ZnTe + 3OH- = HTe- + ZnO22- + H2O. (Eq. 2.16)
At ~0 V vs. RHE and pH 0, the formation of Te0 via an oxidation of Te2- anions should occur as:
pH 0: ZnTe + 2H+ = Te0 + Zn2+ + H2. (Eq. 2.17)
At E< -0.5 V vs. RHE, the electrochemical reduction of Zn2+ cations of ZnTe into Zn0 should occur:
pH 0: ZnTe + 2H+ + 2e- = Zn0 + H2Te (Eq. 2.18) pH 14: ZnTe + H2O + 2e-= Zn0 + HTe- +OH-. (Eq. 2.19)
Experimentally, unlike n-CdTe samples, all n-ZnTe electrodes sustained constant corrosion through the experiments. For the samples tested in 1.0 M H2SO4 (aq), the total dissolution for both samples under applied potential and under OCV increased linearly from 0 at the same rate. The dissolution rates for each species are also similar with Zn dissolution rate slightly higher for both potentials (Fig. 2.2). The SEM images show etched pits developed uniformly throughout the electrode surface (Fig. 2.4). The Te 3d peaks of the samples under both potential conditions are also similar with slightly higher TeO peaks in the samples tested under OCV (Fig. 2.6). Thus, the n-ZnTe electrodes most likely underwent chemical dissolution where Zn2+ ions were disassociated from the ZnTe lattice and leached into the solution (Eq. 2.20, 2.21). Although at this potential, the remaining Te2- could be oxidized to form metallic Te0(s) (Eq. 2.20), the dissolution rate of Zn from the
ZnTe was sufficiently high such that the surface morphology changed too fast to allow any Te(s) deposits.
ZnTe(s) + 2H+(aq) ⟷ Zn2+(aq) + Te(s) + H2 (Eq. 2.20) ZnTe(s) + 2H+ ⟷ Zn2+ + H2 Te(aq) (Eq. 2.21)
For the samples tested in 1.0 M KOH (aq), the total dissolution of the samples under OCV was slightly higher. Nevertheless, the electrodes under both conditions still showed similar behaviors with the dissolution increasing linearly from 0 hours (Fig. 2.2).
For the samples tested under bias at -100 mV vs. RHE, the dissolution rates for both species were similar. The SEM image for this sample shows some triangular etched pits, but not uniformly throughout the surface, indicating one facet of the lattice is more likely to corrode. Nevertheless, the Te 3d XPS peaks show similar surface composition to the samples before testing. Thus, at this lower biased potential, the n-ZnTe electrodes likely either underwent chemical dissolution (Eq. 2.22), or reduced Zn2+ to form Zn0 (Eq. 2.23).
The reduction of Zn2+, however, would still likely cause the remaining Te to leach out since the etched pits are a few µm wide (Fig. 2.4). It is unlikely to have preferential etching of one element in micrometer scale.
ZnTe(s) + 3OH- ⟷ ZnO22-(aq)+HTe-(aq) + H2O (Eq. 2.22) ZnTe(s) + H2 +OH- ⟷ Zn(s) + HTe-(aq) + H2O (Eq. 2.23) For the samples under OCV in 1.0 M KOH(aq), although the total dissolution was similar, the dissolution rate for Zn was substantially higher than the dissolution of Te. The SEM image of the surface also shows severe corrosion on the surface. However, many particle deposits were also observed (Fig. 2.4). Since Zn dissolution was higher, these deposits are most likely Te(s). The Te 3d XPS peaks for this electrode also show a small shift toward Te0(s), which is in good accord with the hypothesized Te deposits. Thus, under