Series Editors: Jiahua Chen · (Din) Ding-Geng Chen ICSA Book Series in Statistics
Wenqing He Liqun Wang Jiahua Chen
Chunfang Devon Lin Editors
Advances and
Innovations in
Statistics and
Data Science
Series Editors
Jiahua Chen, Department of Statistics, University of British Columbia, Vancouver, BC, Canada
Ding-Geng (Din) Chen, College of Health Solutions, Arizona State University, Tempe, AZ, USA
Chinese Statistical Association that has an international reach. It publishes books in statistical theory, applications, and statistical education. All books are associated with the ICSA or are authored by invited contributors. Books may be monographs, edited volumes, textbooks and proceedings.
Chunfang Devon Lin
Editors
Advances and Innovations in
Statistics and Data Science
Wenqing He
Department of Statistical and Actuarial Sciences
University of Western Ontario London, ON, Canada
Liqun Wang
Department of Statistics University of Manitoba Winnipeg, MB, Canada
Jiahua Chen
Department of Statistics University of British Columbia Vancouver, BC, Canada
Chunfang Devon Lin
Department of Mathematics and Statistics Queen’s University
Kingston, ON, Canada
ISSN 2199-0980 ISSN 2199-0999 (electronic) ICSA Book Series in Statistics
ISBN 978-3-031-08328-0 ISBN 978-3-031-08329-7 (eBook)
© The Editor(s) (if applicable) and The Author(s), under exclusive license to Springer Nature Switzerland AG 2022
This work is subject to copyright. All rights are solely and exclusively licensed by the Publisher, whether the whole or part of the material is concerned, specifically the rights of translation, reprinting, reuse of illustrations, recitation, broadcasting, reproduction on microfilms or in any other physical way, and transmission or information storage and retrieval, electronic adaptation, computer software, or by similar or dissimilar methodology now known or hereafter developed.
The use of general descriptive names, registered names, trademarks, service marks, etc. in this publication does not imply, even in the absence of a specific statement, that such names are exempt from the relevant protective laws and regulations and therefore free for general use.
The publisher, the authors, and the editors are safe to assume that the advice and information in this book are believed to be true and accurate at the date of publication. Neither the publisher nor the authors or the editors give a warranty, expressed or implied, with respect to the material contained herein or for any errors or omissions that may have been made. The publisher remains neutral with regard to jurisdictional claims in published maps and institutional affiliations.
This Springer imprint is published by the registered company Springer Nature Switzerland AG The registered company address is: Gewerbestrasse 11, 6330 Cham, Switzerland
and my daughter Joy He, for their love and support.
Wenqing He, PhD To my parents Lijun Huang and Xiuyong Lin.
Chunfang Devon Lin, PhD
This book is a compilation of the invited papers presented at or solicited papers from the invited speakers of the Fourth Symposium of the Canada Chapter of the International Chinese Statistical Association (ICSA-Canada) held at Queen’s University, Kingston, Ontario, Canada, August 9–11, 2019 (
chapter.org/symposium2019/). The Symposium’s theme was “Advances and Inno- vations in Statistics and Data Science,” and the goal of the Symposium is to promote advances and innovations in statistics and data science and to offer the opportunity for researchers to exchange research ideas and disseminate their results.
The Symposium has diverse topics and sessions in both statistics and data sciences, including statistical challenges in high-dimensional data, survival data, missing data and data with measurement error, longitudinal data and functional data analysis, and statistical inference for biomarkers.
This book aims to provide a platform for the research ideas presented at the Symposium to promote further advanced and innovative research in statistics and data science. In this book, we collected 15 articles which are divided into two parts. Part I includes six articles that discuss the advanced methodology in data science, while PartIIcontains nine papers that investigate a variety of development in statistical science.
Part I: Methodology Development in Data Science (Chapters 1–6)
In Chapter 1, Henry Linder and Yuping Zhang present an integrated, graphical regression model to endogenize the directed miRNA-gene target interactions and control their effects on signalling pathway disturbance. They identify prominent miRNA-gene interactions and propose a graphical representation of the targeting.
The network is merged with signalling pathway networks to obtain a cross- functional graph representation of regulatory relationships between genes and
vii
miRNAs. Gene expression and miRNA expression are integrated, in tandem with graphical integration of epigenetic and transcriptomic data types, to estimate a statistical model.
Chapter 2 deals with feature screening commonly used to handle ultrahigh- dimensional data before being formally analyzed. Li-Pang Chen and Grace Y.
Yi consider error-prone ultrahigh-dimensional survival data and propose a robust feature screening method. In addition, they develop an iterative algorithm to improve the performance of retaining all informative covariates. Theoretical results are established for the proposed method.
Controlling the false discovery rate (FDR) and maintaining the high sensitivity are key desiderata in post-selection inference in high-dimensional data analysis. In Chapter3, Bangxin Zhao and Wenqing He propose a method to control the FDR and sensitivity simultaneously for high-dimensional post-selection inference using Least Angle Regression (LARS), termed Cosine PoSI. Cosine PoSI focuses on the geometric aspect of Least Angle Regression: in each step of the LARS algorithm, the proposed Cosine PoSI method makes use of the angle between the entering variable and current residual and treats this angle as a random variable that follows a cosine distribution. Given the collection of the possible angles, the variable selection path is stopped using a hypothesis testing based on the limiting distribution of the maximum angle that can be obtained through the order statistics of the cosine distribution. It is shown that both the sensitivity and the FDR can be controlled by using the stopping criteria.
When a population exhibits heterogeneity, a finite mixture model is often invoked to decompose the population into several different but homogeneous subpopu- lations. Contemporary practice favors learning the mixtures by maximizing the likelihood for statistical efficiency and the convenient EM-algorithm for numerical computation. Yet the maximum likelihood estimate (MLE) is not well defined for finite location-scale mixture in general. In Chapter4, Qiong Zhang and Jiahua Chen investigate feasible alternatives to MLE, such as minimum distance estimators.
Specifically, they use the Wasserstein distance that has intuitive geometric inter- pretation and is successfully employed in many new applications. They find that the minimum Wasserstein distance estimator (MWDE) is consistent, and derive a numerical solution under finite location-scale mixtures. The robustness of MWDE against outliers and mild model mis-specifications is studied. They found that the MWDE suffers some efficiency loss against a penalized version of MLE in general without a noticeable gain in robustness and reaffirmed the general superiority of the likelihood-based learning strategies, even for the non-regular finite location-scale mixtures.
Automatically ranking comments by relevance plays an important role in text mining. In Chapter 5, Yuyang Zhang and Hao Yu present a new text digitization method, the bag of word clusters model, by grouping semantic-related words as clusters using pre-trained word2vec word embeddings and representing each comment as a distribution of word clusters. This method extracts both semantic and statistical information from texts. They then propose an unsupervised ranking algorithm that identifies relevant comments by their distance to the “ideal” com-
ment. This “ideal” comment is the maximum general entropy comment with respect to the global word cluster distribution. The “ideal” comment highlights aspects of a product that many other comments frequently mention and thus is regarded as a standard to judge a comment’s relevance to this product.
Chapter6deals with statistical quality control for high-dimensional non-normal data. M. Rauf Ahmad and S. Ejaz Ahmed propose a modification to the limit of the Hotelling’sT2-statistic for statistical control under high-dimensional settings and evaluate its robustness to the normality assumption. The limit, evaluated for high- dimensional asymptotics, is shown to be robust under a few mild assumptions and a general multivariate model covering normality as a special case. Further, the limit holds without any dimension reduction or preprocessing.
Part II: Challenges in Statistical Analysis (Chapters 7–15)
In the functional linear regression models, many methods have been proposed and studied to estimate the slope function, while the functional predictors were observed in the entire domain. However, works on functional linear regression models with partially observed trajectories have received less attention. In Chapter 7, Yafei Wang, Tingyu Lai, Bei Jian, Linglong Kong, and Zhongzhan Zhang consider the scenario where individual functional predictors may be observed only on the part of the domain to fill the gap. Two methods are developed depending on whether the measurement error is presented in functional predictors. One is based on linear functionals of the observed part of the trajectory, and the other one uses conditional principal component scores.
In Chapter 8, Yanqing Sun and Fang Fang study several profile estimation methods for the generalized semiparametric varying-coefficient additive model for longitudinal data by utilizing the within-subject correlations. The model is flexible in allowing time-varying effects for some covariates and constant effects for others, and in having the option to choose different link functions which can be used to analyze both discrete and continuous longitudinal responses. They investigated the profile generalized estimating equation (GEE) approaches and the profile quadratic inference function (QIF) approach. The profile estimations are assisted with the local linear smoothing technique to estimate the time-varying effects.
Several approaches that incorporate the within-subject correlations are investigated, including the quasi-likelihood (QL), the minimum generalized variance (MGV), the quadratic inference function, and the weighted least squares (WLS). The proposed estimation procedures can accommodate flexible sampling schemes. These methods provide a unified approach that works well for discrete longitudinal responses as well as for continuous longitudinal responses.
In Chapter 9, Riyadh Rustam Al-Mosawi and Xuewen Lu propose to esti- mate both the regression coefficients and the baseline survival function of the semiparametric linear transformation model with left-truncated and current status data using the Sieve maximum likelihood estimation method based on techniques
of constrained Bernstein polynomials. They proved that the obtained estimators are semiparametrically efficient and asymptotically normally distributed based on the conditional likelihood given the truncation time, and the estimator for the nonparametric baseline survival function achieves the optimal rate of convergence.
Compositional data arise in many applications across various disciplines such as ecology, geology, demography, and economics. For some time, log-ratio methods have been a popular approach for analyzing compositional data and have motivated much of the recent research in the area. In Chapter 10, Michail Tsagris and Connie Stewart review two recently proposed transformations for data defined on the simplex. The firstα transformation transforms the data from the simplex to a subset of Euclidean space, and the other one is a more complex transformation involving folding, resulting in data with Euclidean sample space. In both cases, the transformed data are assumed to follow a multivariate normal distribution, and the parameter α provides flexibility compared to the traditional log-ratio transformations.
The autoregressive conditional heteroscedasticity (ARCH) model and its various generalizations have been widely used to analyze economic and financial data.
Although many variables like GDP, inflation, and commodity prices are imprecisely measured, research focusing on the mismeasured response processes in GARCH models is sparse. In Chapter11, Mustafa Salamh and Liqun Wang study a dynamic model with ARCH error where the underlying process is latent and subject to additive measurement error. They show that, in contrast to the case of covariate measurement error, this model is identifiable by using the observations of the proxy process only, and no extra information is needed. They construct generalized method of moments (GMM) estimators for the unknown parameters, which are consistent and asymptotically normally distributed under general conditions. They also propose a procedure to test the presence of measurement error, which avoids the usual boundary problem of testing variance parameters.
Chapter12deals with skewed, truncated, or contaminated data with outliers. Sijia Xiang and Weixin Yao introduce a new regression tool, named modal regression, that aims to find the most probable conditional value (mode) of a dependent variable Y given covariates X rather than the mean that is used by the traditional mean regression. The modal regression can reveal new interesting data structure that is possibly missed by the conditional mean or quantiles. In addition, modal regression is resistant to outliers and heavy-tailed data, and can provide shorter prediction intervals when the data are skewed. Furthermore, unlike traditional mean regression, the modal regression can be directly applied to the truncated data. Modal regression could be a potentially very useful regression tool that can complement the traditional mean and quantile regressions.
The Galveston Bay Recovery Study conducted a longitudinal survey of residents of two counties in Texas in the aftermath of Hurricane Ike, which made landfall on September 13, 2008, and caused widespread damage. An important objective was to chart the extent of symptoms of post-traumatic stress disorder (PTSD) in the resident population over the following months. In Chapter13, Mary E. Thompson, Gang Meng, Joseph Sedransk, Qixuan Chen, and Rebecca Anthopoulos model the
course of the repeated PTSD measures as a function of individual characteristics and area segment, and to examine the analytical and visual evidence for spatial correlation of the area segment effect. The composite likelihood approach is used in the multilevel analysis to incorporate design information. The authors compare their proposed method with a Bayesian multilevel analysis and discuss the estimability of the model when the cluster level variation has spatial dependence.
Lasso regression has attracted significant attention in statistical learning and data science. However, there is sporadic work on constructing efficient data collection for regularized regression. In Chapter14, Peter Chien, Xinwei Deng, and Chunfang Devon Lin propose an experimental design approach using nearly orthogonal Latin hypercube designs to enhance the variable selection accuracy of Lasso regression.
Systematic methods for constructing such designs are presented.
In Chapter15, Xinyi Ge, Yingwei Peng, and Dongsheng Tu present a selective overview of statistical methods for identifying the treatment-sensitive subsets of patients. Identifying a subset of patients who may benefit from or be sensitive to a specific type of treatment has become a critical research topic in clinical trials and other types of clinical research. Statistical methods are essential in helping clinical researchers to identify the subset. They consider first the cases where the outcome of the clinical studies is time-to-event or survival time, and the subset is defined by one continuous covariate, such as the expression level of a gene, or by multiple covariates which can be continuous or categorical, such as mutation statuses of multiple genes. The cases where the outcomes of the clinical studies are longitudinal or repeated measurements, such as patient-reported quality of life scores before, during, and after a treatment, are considered next. Gaps between the needs in clinical research and the methods available in statistical literature are identified, and future research topics to bridge these gaps are discussed based on this overview.
We have organized the book chapters to be self-contained, with their separate references, to provide readers with the complete materials for each topic.
We sincerely thank the organizations and individuals for their support of the Symposium. We owe a big thank you to the local organization team at Queen’s University led by Drs. Devon Lin and Wenyu Jiang. We thank the program committee for organizing the eye-catching scientific sessions of the Symposium:
Drs. Jiguo Cao at Simon Fraser University, Wenqing He at the University of Western Ontario, Linglong Kong at the University of Alberta, Longhai Li at the University of Saskatchewan, Xuewen Lu at the University of Calgary, Liqun Wang at the University of Manitoba, Lang Wu at the University of British Columbia, and Ying Zhang at Acadia University.
The editors would like to thank the authors of this book’s chapters for their expertise, knowledge, and time contribution. Our sincere gratitude goes to the spon- sors of the Fourth Symposium of the ICSA-Canada for their financial support: the Canadian Statistical Science Institute (CANSSI), the Department of Mathematics and Statistics, and the Faculty of Arts and Sciences at Queen’s University. We are also grateful to the volunteers and staff of Queen’s University for their assistance at
the Symposium. Without their support, the Symposium, as well as this book, would not be possible.
We would also like to acknowledge the professional support from the publication team at Springer.
We welcome readers’ comments and suggestions for the book. This book is a collective contribution from the authors. Please send your suggestions and comments to the chapter authors or any of the co-editors below. We will be delighted to pass your suggestions and comments to the chapter corresponding authors.
London, ON, Canada Wenqing He
Winnipeg, MB, Canada Liqun Wang
Vancouver, BC, Canada Jiahua Chen
Kingston, ON, Canada Chunfang Devon Lin
August 2022
Part I Methodology Development in Data Science MiRNA–Gene Activity Interaction Networks (miGAIN):
Integrated Joint Models of miRNA–Gene Targeting and
Disturbance in Signaling Pathways. . . 3 Henry Linder and Yuping Zhang
Robust Feature Screening for Ultrahigh-Dimensional Censored
Data Subject to Measurement Error. . . 23 Li-Pang Chen and Grace Y. Yi
Simultaneous Control of False Discovery Rate and Sensitivity
Using Least Angle Regressions in High-Dimensional Data Analysis. . . 55 Bangxin Zhao and Wenqing He
Minimum Wasserstein Distance Estimator Under Finite
Location-Scale Mixtures. . . 69 Qiong Zhang and Jiahua Chen
An Entropy-Based Comment Ranking Method with Word
Embedding Clustering. . . 99 Yuyang Zhang and Hao Yu
A Robust Approach to Statistical Quality Control for
High-Dimensional Non-Normal Data. . . 121 M. Rauf Ahmad and S. Ejaz Ahmed
Part II Challenges in Statistical Analysis
Functional Linear Regression for Partially Observed Functional Data . . . 137 Yafei Wang, Tingyu Lai, Bei Jiang, Linglong Kong,
and Zhongzhan Zhang
xiii
Profile Estimation of Generalized Semiparametric Varying-Coefficient Additive Models for Longitudinal
Data with Within-Subject Correlations. . . 159 Yanqing Sun and Fang Fang
Sieve Estimation of Semiparametric Linear Transformation
Model with Left-Truncated and Current Status Data. . . 181 Riyadh Rustam Al-Mosawi and Xuewen Lu
A Review of Flexible Transformations for Modeling
Compositional Data. . . 225 Michail Tsagris and Connie Stewart
Identifiability and Estimation of Autoregressive ARCH Models
with Measurement Error. . . 235 Mustafa Salamh and Liqun Wang
Modal Regression for Skewed, Truncated, or Contaminated Data
with Outliers. . . 257 Sijia Xiang and Weixin Yao
Spatial Multilevel Modelling in the Galveston Bay Recovery
Study Survey. . . 275 Mary E. Thompson, Gang Meng, Joseph Sedransk, Qixuan Chen,
and Rebecca Anthopolos
Efficient Experimental Design for Lasso Regression. . . 295 Peter Chien, Xinwei Deng, and Chunfang Devon Lin
A Selective Overview of Statistical Methods for Identification of
the Treatment-Sensitive Subsets of Patients. . . 311 Xinyi Ge, Yingwei Peng, and Dongsheng Tu
Index. . . 331
M. Rauf Ahmad Department of Statistics, Uppsala University, Uppsala, Sweden S. Ejaz Ahmed Department of Mathematics and Statistics, Brock University, St.
Catharines, ON, Canada
Riyadh Rustam Al-Mosawi Department of Mathematics, College of Computer Science and Mathematics, University of Thi-Qar, Thi-Qar, Iraq
Rebecca Anthopolos New York University, NY, USA
Jiahua Chen Department of Statistics, University of British Columbia, Vancouver, BC, Canada
Li-Pang Chen Department of Statistical and Actuarial Sciences, University of Western Ontario, London, ON, Canada
Department of Statistics, National Chengchi University, Taipei, Taiwan
Qixuan Chen Department of Biostatistics, Columbia University New York, NY, USA
Peter Chien Department of Statistics, University of Wisconsin-Madison, Madison, WI, SA
Xinwei Deng Department of Statistics, Virginia Tech, Blacksburg, VA, USA Fang Fang Corporate Model Risk at Wells Fargo, Charlotte, NC, USA
Xinyi Ge Department of Mathematics and Statistics, Queen’s University, Kingston, ON, Canada
Wenqing He Department of Statistical and Actuarial Sciences, University of Western Ontario, London, ON, Canada
Bei Jiang Department of Mathematical and Statistical Sciences, University of Alberta, Edmonton, AB, Canada
xv
Linglong Kong Department of Mathematical and Statistical Sciences, Faculty of Science, University of Alberta, Edmonton, AB, Canada
Tingyu Lai Beijing University of Technology, Beijing, China
Chunfang Devon Lin Department of Mathematics and Statistics, Queen’s Univer- sity, Kingston, ON, Canada
Henry Linder Department of Statistics, University of Connecticut, Storrs, CT, USA
Xuewen Lu Department of Mathematics and Statistics, University of Calgary, Calgary, AB, Canada
Gang Meng Department of Statistics and Actuarial Sciences, University of Water- loo, Waterloo, ON, Canada
Yingwei Peng Departments of Public Health Sciences and Mathematics and Statistics, Queen’s University, Kingston, ON, Canada
Mustafa Salamh Department of Statistics, Cairo University, Giza, Egypt Joseph Sedransk University of Maryland, College Park, MD, USA
Connie Stewart Department of Mathematics and Statistics, University of New Brunswick, Saint John, NB, Canada
Yanqing Sun Department of Mathematics and Statistics, University of North Carolina at Charlotte, Charlotte, NC, USA
Michail Tsagris Department of Economics, University of Crete, Rethymnon, Greece
Mary E. Thompson Department of Statistics and Actuarial Sciences, University of Waterloo, Waterloo, ON, Canada
Dongsheng Tu Departments of Public Health Sciences and Mathematics and Statistics, Queen’s University, Kingston, ON, Canada
Liqun Wang Department of Statistics, University of Manitoba, Winnipeg, MB, Canada
Yafei Wang Department of Statistics and Data Science, Faculty of Science, Beijing University of Technology, Beijing, China
Department of Mathematical and Statistical Sciences, Faculty of Science, University of Alberta, Edmonton, AB, Canada
Sijia Xiang School of Data Sciences, Zhejiang University of Finance and Eco- nomics, Hangzhou, China
Weixin Yao Department of Statistics, University of California at Riverside, River- side, CA, USA
Grace Y. Yi Department of Statistical and Actuarial Sciences, University of Western Ontario, London, ON, Canada
Department of Computer Science, University of Western Ontario, London, ON, Canada
Hao Yu Department of Statistical and Actuarial Sciences, University of Western Ontario, London, ON, Canada
Qiong Zhang Department of Statistics, University of British Columbia, Vancou- ver, BC, Canada
Yuping Zhang Department of Statistics, University of Connecticut, Storrs, CT, USA
Yuyang Zhang Department of Statistical and Actuarial Sciences, University of Western Ontario, London, ON, Canada
Zhongzhan Zhang Beijing University of Technology, Beijing, China
Bangxin Zhao Department of Statistical and Actuarial Sciences, University of Western Ontario, London, ON, Canada
Methodology Development in Data Science
Networks (miGAIN): Integrated Joint Models of miRNA–Gene Targeting and Disturbance in Signaling Pathways
Henry Linder and Yuping Zhang
Abstract Omics data are now inexpensive to collect in vast quantities, across a wide variety of not only multiple data platform, but also distinct functional units. These bioinformatic datasets can enable scientific analysis of system-level cellular processes, including complex diseases such as cancers. Recent experimen- tal research has found significant interactions between non-coding microRNAs (miRNAs) and genes. We propose an integrated, graphical regression model to endogenize the directed miRNA–gene target interactions and control for their effects in signaling pathway disturbance. We identify prominent miRNA–gene interactions and propose a graphical representation of the targeting. We merge this network with signaling pathway networks to obtain a cross-functional graph representation of regulatory relationships between genes and miRNAs. We integrate gene expression and miRNA expression, in tandem with graphical integration of epigenetic and transcriptomic data types, and estimate a statistical model. We find that our integration approach improves the statistical power, using a simulation study. We demonstrate our integrated model with an application to disturbance of the BRAF signaling pathway across 9 cancers. We find that integration of miRNA–gene targets clarifies the differential activity between healthy and tumor tissues, which in turn reflects different roles for the pathway across the different cancers.
Keywords Data integration · Network analysis · Statistical inference
1 Introduction
The widespread availability of genomic data has dramatically increased the scope of quantitative research into biology at the molecular, genomic, and systems levels. The diversity of data available for study improves the detail available to characterize the
H. Linder · Y. Zhang ()
Department of Statistics, University of Connecticut, Storrs, CT, USA e-mail:
© The Author(s), under exclusive license to Springer Nature Switzerland AG 2022 W. He et al. (eds.),Advances and Innovations in Statistics and Data Science, ICSA Book Series in Statistics,
3
functional processes of the genome. Significantly, these data may provide valuable new insight into the drivers of complex diseases. Multi-view datasets are now routinely collected in multiple modalities across separate biological structures, and large-scale research studies coordinate to improve the quality and quantity of data available to advance knowledge, treatment, and prevention.
To analyze these high-resolution omics data, robust methods are essential to ensure scientific rigor and validity. New experimental techniques should be complemented by statistical methods that reflect the biology in a sophisticated way.
Increasingly, data is collected for genomic entities other than the gene, such as non- coding microRNAs (miRNAs).
Notably, miRNA research is fundamentally integrative in nature. Individual miRNAs are believed to target genes in a functional manner (Lewis et al.2005), and it is often the case that single miRNAs target multiple genes. To model correlated gene activity due to a shared miRNA parent, miRNA–gene target interactions must be known and available to researchers. Early miRNA–gene target research validated individual targets experimentally, but the combinatoric problems introduced by large numbers of genes and miRNAs motivated meta-analytic and computational approaches. One such study of miRNA–gene targets was miRTarBase (Hsu et al.
2010), which identified gene targets for fewer than 700 miRNAs by manual aggregation of experimental evidence. Modern informatic methods permit large- scale analyses to identify miRNA targets. Frameworks such as miRTarBase and DIANA-miRPath (Vlachos et al.2015) utilize web interfaces to access and explore association analyses between miRNAs and genes. DIANA-miRPath adapts methods originally applied to gene expression. In addition to Fisher’s exact test, they also test for differential activity in miRNAs using the enrichment analysis method of Bleazard et al. (2015). Computational approaches have been used to identify targets, too. Hsu et al. (2011) proposed miRTar, a successor to miRTarBase that used gene set enrichment analysis for significance testing of differential activity. These are often applied to specific phenomena or systems. Other databases include DIANA- TarBase (Karagkouni et al.2017) and TargetScan (Agarwal et al.2015). Coll et al.
(2015) used correlation analysis to identify miRNA–gene targets related to cirrhosis of liver tissue.
Integrative analysis unifies multiple data types into a single whole. However, real-world analysis is often highly restrictive in its assumptions and the sophis- tication of its representation of biological systems. In many cases, “integrated”
analysis refers to qualitative aggregation of separate marginal analyses on different data types, as well as correlation analysis between data types. Early statistical analyses of miRNAs were characterized by straightforward statistical methods. The CORNA method of Wu and Watson (2009) applied hypergeometric and Fisher’s exact tests to assess differential activity in miRNA–gene interactions and networks.
Du and Zhang (2015) integrated methylation in a small-sample analysis of lung cancer that also included expression in genes and miRNAs. They used miRNA–
gene target databases, but the interactions were excluded from gene enrichment analysis. Godard and van Eyll (2015) performed pathway analysis of miRNA in the context of Alzheimer’s disease, also using a hypergeometric enrichment test.
Their procedure also treated pathways as simple gene sets, thereby ignoring known
structural information about the signaling pathways. Miao et al. (2017) analyzed the relationship between miRNAs and DNA methylation in sheep. They identified gene–miRNA networks on the basis of a correlation analysis but only applied a basic t-test for differential activity across gene sets, ignoring network topology. Moreover, their integration was largely restricted to correlation analysis to cluster genes targeted by the same miRNAs. Volinia and Croce (2013) analyzed gene expression and miRNA expression for a breast cancer dataset. Their analysis focused on survival outcomes, and the extent of their data integration was to include both genes and miRNAs as covariates, rather than a structural or model-based integration.
Cava et al. (2014) considered copy number as well as gene and miRNA expression.
But, genes and miRNAs were only heuristically integrated, by performing separate marginal analyses, as well as comparing up- and downregulation across the different data types.
This lack of a single coherent integration scheme is also found in miRNA analyses applied to cancer datasets. Enerly et al. (2011) studied miRNA suppression in a novel miRNA and gene expression breast tumor dataset. But, their integration was limited to correlation analysis and separate studies on each data type. Likewise, Yu et al. (2019) identified specific biomarkers with differential survival outcomes in lung cancer, and Li et al. (2018) used differential correlation analysis between miRNAs and genes in cancer, both using correlation analysis.
We address this lack of technical statistical methods for joint integrative analysis of data observed on genes and miRNAs. We identify prominent miRNA–gene interactions and construct a graphical model to represent the targets. We merge this network with signaling pathways to estimate pathway activity while controlling network effects and coexpression of genes due to the miRNAs. We extend the NetGSA regression model for analysis of signaling pathways, which was restricted to gene-level measurements, originally only gene expression (E) in Shojaie and Michailidis (2009) and Shojaie and Michailidis (2010). Zhang et al. (2017) extended the signaling pathway network to include gene methylation (M) and copy number (C), and we use their EMC-NetGSA model to integrate gene-level omics obser- vations. In this chapter, we also incorporate miRNAs into the statistical model.
Furthermore, we also introduce a semi-parametric bootstrap procedure to assess the robustness of the statistical inference.
This chapter proceeds as follows. In Sect.2, we give an overview of the omics datasets we use for integrative analysis. In Sect.3, we give details of the network integration and pathway model. In Sect.4, we first perform simulation studies to examine the statistical level and power of the proposed method in Sect.4.1and then conduct a data analysis of pathway disturbance in the BRAF signaling pathway in 9 cancers in Sect.4.2. Finally, we conclude our paper with discussion in Sect.5.
2 Data
We consider a multi-platform omics dataset assembled from observations published by The Cancer Genome Atlas (TCGA). TCGA is an ongoing, international study
funded by the National Cancer Institute (NCI) that collects tumorous tissue samples in patients with more than 30 distinct cancers (Tomczak et al. 2015). For each cancer, we obtained measurements of gene expression, copy number variation (CNV), and methylation, as well as miRNA expression. In order to analyze differential activity by cancer, we downloaded omics data for all tumor samples, as well as matched healthy control tissue samples. We describe in Sect. 4.2our steps to aggregate methylation and copy number at the level of individual genes.
Unlike gene-level integration of methylation and copy number features, no standard, direct mapping exists between genes and miRNAs. Instead, we use resources on functional miRNA–gene targets to construct an integrated statistical model. Substantial work has been done to identify miRNA–gene targets. One resource that quantifies the degree of experimental evidence in support of a given miRNA–gene target interaction is mirDIP. Tokar et al. (2017) compiled the database as a meta-analysis to integrate predicted miRNA–gene targets from 30 separate sources of experimentally validated interactions. It includes information on the degree to which the source databases overlap in their conclusion.
3 Methods
We integrate the omics data described in the previous section through a statistical model across the four data types collected across miRNAs and genes. At a high level, we start with a known genetic signaling pathway, specified as a directed graph on vertices representing genes. We identify likely miRNA–gene targets and integrate these with directed edges. We use a similar approach to integrate gene methylation and copy number within each gene. Finally, the graph adjacency matrix of the fully integrated omics network is used to form a design matrix for a mixed linear model. This enables hypothesis testing for differential pathway activity between two populations.
We introduce our integrated graphical network constructively. We start with a genetic signaling pathway specifying known functional relationships between genes. We define a directed graphG= {V,E}. Initially,Vcontainspgraph vertices, andEcontains the directed edges between elements of the genesVthat comprise the signaling pathway. In general, the graph vertices inVrepresent biological features, while the edges inErepresent the functional interactions.
GraphGcan be represented by ap×padjacency matrix,AE. The subscript “E”
emphasizes that the graph relations inAEspecify relationships between vertices for gene expression. The elementαj kofAEis an indicator for the presence of a directed edge from vertexkto vertexj, for allj, k=1, . . . , p.αj kis nonzero when genej is conditionally dependent on genek. For each gene, we observe gene expression as a vectoryi1ofpelements, wherei=1, . . . , Nindexes tissue samples.
Suppose theppathway genes are targeted bygmiRNAs, and for each sample, we observe a vector ofgelementsyi2, the values of which measure miRNA expression.
We add g vertices to V integrated the miRNA–gene target interactions, and we
construct thep ×g graph adjacency matrix Ami. The elementτj ∈ Ami is an indicator value for miRNAtargeting genej,j = 1, . . . , p, =1, . . . , g. Each miRNA–gene target is represented by a directed edge which we add toE.
We construct the(p+g)×(p+g)integrated adjacency matrixAmiEthat spans both the genetic pathway and the miRNA–gene targets and contains elements of 0 and 1:
AmiE=
AE Ami Og×p Og×g
, (1)
whereOm×nis am×nmatrix of zeros.
Moreover, for each gene inyi1, we also observe copy number and methylation, contained in the vectors yi3 and yi4, respectively. We adopt the EMC-NetGSA model (Zhang et al.2017) to integrate {yi1,yi3,yi4}by adding 2p vertices toV, one for each gene for copy number and methylation, and 2p directed edges toE, from the copy number and methylation vertices to their counterpart gene expression vertices. This produces a fully integrated adjacency matrix,AmiEMC:
AmiEMC=
AE Ami Ip×p Ip×p
O(g+2p)×p O(g+2p)×g O(g+2p)×p O(g+2p)×p
. (2)
In real-world datasets, individual elements ofyi2,yi3, andyi4may be missing across allN samples. An advantage of our unidirectional integration, which does not model directed interactions from genes to the other omics features, is that we may simply omit the columns and rows for the corresponding miRNA, copy number, and methylation features inAmiEMCprior to the pathway analysis. Without loss of generality, we consider the full(g+3p)×(g+3p)adjacency matrixAmiEMC, with the knowledge that its true dimensionqis such thatq ≤(g+3p).
The network in Eq.2 composes three distinct network layers: (1) the primary signaling network on elements ofyi1; (2) the miRNA integration layer of directed relationships, possibly many-to-one, from miRNAs inyi2to genes inyi1; and (3) a within-gene layer integrating copy number inyi3and methylation inyi4. Therefore, the graph simultaneously provides for causal relationships between genes, allows correlation between genes, and reduces noise by controlling for epigenetic and transcriptional effects. Each of the three components is supported by scientific knowledge of the complex underlying biological processes.
For expositional clarity, definem= (g+3p),yi = (yi1,yi2,yi3,yi4),A ≡ AmiEMC, and the elements ofAbyδj k,j, k=1, . . . , m.
Gaussian graphical models formalize the conditional dependence of vertexj on vertexkas the partial correlationρj k between gene-level random variablesYj,Yk, controlling for the effects of the remaining(m−2)vertices inV. Writing the random variables for the remaining(m−2)vertices byZ,ρj k =corr(Yj\Z, Yk\Z), where Yj\Z =Yj−PZYj is the orthogonal complement ofYj with respect toZ, andPZ is a projection ontoZ(Krämer et al.2009).
We estimateρj k with the sample partial correlationrj k. We first estimate two separate regressions, one ofYjonZand the other ofYkonZ. Then, we estimaterj k by the Pearson correlation coefficient between the residuals of the two regressions (Kim2015). Finally, we form a weighted adjacency matrixAwith elementsaj k = rj kαj k, j, k = 1, . . . , m. Elements of A thus take either the value 0, when no interaction exists, or a value in the interval(−1,1)corresponding to the strength of conditional association between two vertices with a functional interaction.
The effect of coexpression due to the graph topology G can be summarized by a transformation of A, called the influence matrix. As detailed in Shojaie and Michailidis (2009), in the special case of directed acyclic graphs (DAGs), it can be shown that = (Im −A)−1. This definition extends to all graphs for which the adjacency matrix has eigenvalues all of which are smaller than 1 in magnitude. Shojaie and Michailidis (2010) extended the definition to non-DAG, non-substochastic graphs. They used a limit approximation to induce in arbitrary directed graphs the necessary eigenvalue properties ofA.
The NetGSA statistical model uses to structure the mean of yi, by setting Eyi =βfor an unknown vector ofmregression coefficientsβ.βis the network- adjusted activity parameter, giving the mean values for themobserved elements ofyi, controlling for pass-through network effect due toG. The influence matrix also structures the covariance ofyi. The NetGSA model parameterizes variability in individuals’ mean expression via a mixed effects linear regression model:yi = β+γi+i,γi ∼Nm(0m, σγ2Im),i ∼Nm(0m, σ2Im), whereγi is a sample- level random effect, andi=1, . . . , N.
In proposing the NetGSA model, Shojaie and Michailidis (2009) also proposed a hypothesis test for difference in mean vectors between two populations. Denote the population label for sampleibyci, whereci ∈ {C,T}, “C” corresponds to control, and “T” corresponds to treatment. In our pathway analysis of cancerous tumors, we assign healthy tissue samples the label of “control,” and tumor tissues the label
“treatment.” We estimate separate weighted adjacency matrices AC,AT, yielding distinct influence matricesC,T, and population-specific mean parametersβC, βT.
We test for differential activity in subsets of the pathway features, corresponding to elements inβC,βT, using an indicator vectorbfor the omics features of interest.
The NetGSA network contrast is = (−b·bC,b·bT), and this yields a test statisticT ∝β,β=(βC,βT).T follows a Student’stdistribution with degrees of freedom estimated using Satterthwaite’s approximation.
The above inference depends upon both the assumption of normality and the composition of the control population. In practice, the size of the healthy sample population is very small, and we may wish to assess the robustness of the inference to the specific control samples. Therefore, we propose a semi-parametric bootstrap test based on the principles discussed by MacKinnon (2009).
Specifically, we generateBpairwise bootstrap replicates under the null hypothe- sis of no difference in the network-adjusted mean parameters in the two populations.
We randomly select pairs of population labels and omics observations, with replacement. If a sample contains fewer than 10 observations in the control (healthy)
population, we re-generate the bootstrap sample. Because the distribution of the NetGSA test statistic is approximated using a function of the estimated variance, the distributions of the test statistic are not comparable between bootstrap replicates, as the degrees of freedom vary substantially. Instead, when the empiricalp-value is nominally significant, we calculate a 95% bootstrap upper confidence bound.
Inversely, for ap-value that is nominally not significant, we calculate a 5% bootstrap lower bound.
This bootstrap procedure offers a semi-parametric criterion for assessing the robustness of the outcome of a hypothesis test. The procedure still depends upon the underlying assumptions of the mixed linear model but instead addresses the robustness of the procedure to small sample sizes in the control population.
4 Results
First, we use a simulation study to demonstrate the improved power of our method due to the integration of miRNA–gene target information. We then apply our method to the TCGA dataset introduced in Sect. 2 for pathway analysis of the BRAF pathway.
4.1 Simulations
Our simulation study borrows the ideas on simulation designs in the EMC-NetGSA paper (Zhang et al.2017). Broadly, we construct a pathway composed of a binary tree signaling pathway; we model miRNA–gene targets that drive correlated gene expression, and we integrate the methylation and copy number within genes.
This supplies three separate layers of network information that may contribute to gene expression, and we examine the relationship between omics integration and statistical power.
We modeled a signaling pathway consisting of a five-level binary tree containing 31 genes. We integrated miRNA with directed edges from miRNA to corresponding genes. For every gene, we added three distinct miRNA vertices, i.e., each had out- degree 1. We then partitioned the genes inV into disjoint sets of two, proceeding from the root node. We assigned to each pair of genes one shared miRNA, i.e., with out-degree 2. Finally, we repeated this procedure for sets of three genes. We assigned each triplet one miRNA with out-degree 3. The network topology for the control population signaling pathway used the same integrated binary tree structure, with all edges in the tree’s left branch removed. For EMC-NetGSA integration, we addGdirected edges into each gene from two vertices representing methylation and copy number.
We set the correlation between expression vertices to 0.8 in the top third (two levels) of the tree; association is 0.5 in the middle third (third level); and association
0.2 in the final third (final level). We set the magnitude of the association strength between miRNA and their gene targets to 0.4. In the TCGA dataset, we found that the partial correlation coefficients between miRNA and expression were generally symmetric. Therefore, we assigned alternating edges from miRNAs to genes to have positive and negative association, respectively. This may be understood as simulating cases where miRNAs with multiple gene targets have the same sign for association, as well as different associations with different genes for a single miRNA. We set the association 0.5 between copy number and gene expression and
−0.25 between methylation and expression.
We generated observation vectorsyi, i = 1, . . . , N, from the NetGSA linear mixed model, whereN=NC+NT. The number of control samples wasNC=50, and the number of treatment samples wasNT =150. This reflects the imbalanced sample sizes in the real cancer datasets. We set the variance parameters asσγ2 =5 andσ2=0.5.
Denoting the mean vectors for gene expression, miRNA expression, gene copy number, and gene methylation byβc1,βc2,βc3,βc4, we simulated two scenarios for the network-adjusted mean parameterβ. Here,c∈ {C,T}indexes the control and treatment populations. In the first scenario, we assignedβcj =0,c∈ {C,T},j = 1,2,3,4. In the second mean scenario, we heldβCj =0for allj. For the top two- thirds levels of the binary tree, we set(βT1, βT2, βT3, βT4)=(0.25,0.5,1.0,0.5).
In the bottom third of the binary tree, we maintained(βT1, βT2, βT3, βT4)=0, as in the first scenario.
For each simulated dataset, we tested four gene sets for differential activation: (1) the full binary tree; (2) the top third of the tree; (3) the top two-thirds of the tree; and (4) the bottom third of the tree. We estimated the miEMC-NetGSA model for the entire simulated dataset, as well as the NetGSA variants with the adjacency matrices AmiE,AEMC, andAE, as well as the corresponding hypothesis test for each network.
We ran 1000 replicates of the simulation. We calculated the power for each method by the proportion of hypothesis testp-values that were significant at theα=0.05 level, i.e., the proportion of replicates for which we reject the null hypothesis of no difference in pathway-adjusted mean parameters.
Figure 1 shows boxplots of the −log10p-values from the significance tests.
The left-hand panel shows the results of the first mean scenario, in which no features are differentially expressed. The right-hand panel shows the second mean scenario, in which the top two-thirds of the binary tree signaling pathway are differentially expressed. We compare the performance of miEMC-NetGSA with the other integrated models described above.
The first mean scenario permits assessment of the false positive rate under different omics integration schemes. We observe that in all gene sets that we tested, all four NetGSA-based methods have low false positive rates. Most importantly, integration of miRNA with expression alone (“miE”) does not cause an elevated false positive rate over the original NetGSA method. Likewise, although the false positive rate is somewhat elevated in miEMC-NetGSA, we observe that it is not elevated significantly over the existing EMC-NetGSA method. Therefore, we do not attribute to the miRNA integration a meaningful increase of the type I error rate.
−log10(p)
miEMC miE EMC E
051015
Method Test set: All genes
−log10(p)
miEMC miE EMC E
051015
Method Test set: Top 1/3
−log10(p)
miEMC miE EMC E
051015
Method Test set: Top 2/3
−log10(p)
miEMC miE EMC E
051015
Method Test set: Last level
−log10(p)
miEMC miE EMC E
010203040
Method Test set: All genes
−log10(p)
miEMC miE EMC E
010203040
Method Test set: Top 1/3
−log10(p)
miEMC miE EMC E
010203040
Method Test set: Top 2/3
−log10(p)
miEMC miE EMC E
010203040
Method Test set: Last level
Fig. 1 Boxplots of−log10p-values from simulation study. The left-hand panel shows signifi- cance tests for four gene sets of interest, under the first mean scenario in which no omics features exhibit differential activation. The right-hand panel shows the second mean scenario, in which the top two-thirds of the simulated binary tree signaling pathway is differentially activated, but the final third is equal in the control and treatment populations. miEMC-NetGSA is shown in green, miE-NetGSA in yellow, EMC-NetGSA in blue, and NetGSA (“E”) on expression only in white
Further, we note that the number of miRNAs is large relative to the number of genes. This causes the type I error rate to belowerfor the methods that integrate miRNA–gene targets, shown in the test set of the top 1/3 genes. The reason is that the larger overall number of features provides increased accuracy to miEMC-NetGSA and miE integration, so more substantial information is available to the inference procedure than the methods with only gene-level network features.
The second mean scenario provides an assessment of the method’s power. We observe that in the three test sets that contain differentially activated features, the power of models that integrate miRNA–gene targets dominates the gene- only analyses. In fact, an integrated model of miRNA and expression has power comparable to EMC-NetGSA integration of methylation and copy number, although miRNA–gene expression remains under-powered relative to EMC-NetGSA.
Also prominent is the increased power of the new method, which integrates both the miRNA–gene targets and gene copy number and methylation. Integration of miRNA reduces the type II error rate of the EMC-NetGSA model; equivalently, it increases the analytic power. Finally, the miRNA methods continue to exhibit low rates of type I errors for the gene set that is not differentially activated.
Taken in tandem, the results of the two simulation scenarios confirm the value of pathway analysis that integrates miRNA–gene targets. We find miRNA contributes to pathway analyses improved statistical power, relative to analyses conducted solely at the level of individual genes. At the same time, we find that miRNA integration does not artificially elevate the false positive rate. Finally, although the addition of miRNA to an expression-only analysis improves power, the increase
is marginally less substantial than is provided by integrating copy number and methylation. But, our composition of these two integration schemes achieves the highest statistical power and does not noticeably increase the type I error rate.
4.2 Data Analysis
Prior to analysis, we formatted the dataset described in Sect.2. We downloaded level 3 TCGA data for 33 cancers from the NCI Genomic Data Commons (Grossman et al.2016), using the R packageTCGA-Assembler, version 2.0.0 (Zhu et al.
2014; Wei et al.2017).
Starting with gene expression data measured using RNASeqV2, we used a normalization of the read counts provided by TCGA, fragments per kilobase of transcript per million mapped reads upper quartile (FPKM-UQ) (Grossman et al.
2016). We further took a log2transformation of the normalized read counts. We used CNV data with common germ-line copy number variants removed and averaged gene-level CNV across the corresponding DNA regions. We aggregated observed methylation beta values across CpG sites by gene and took the mean.
Similar to gene expression, miRNA expression data are available from TCGA in two formats: raw read counts and normalized reads per million (RPM). Raw read counts were collected on the miRNASeq platform, and the TCGA processing pipeline outlined by Chu et al. (2015) is consistent with procedures in comparable projects, such as ENCODE (ENCODE Project Consortium et al. 2012). After alignment and read trimming, a library of approximately 22 base pairs of mature strands was used with an insert length of approximately 22.
Typical miRNASeq analyses use methods traditionally developed for RNASeq.
For example, Stokowy et al. (2014) employed RPM normalization and cited its original definition from Mortazavi et al. (2008), in the context of gene expression.
They cited other work that applies RPM normalization to miRNASeq data, including Chen et al. (2013). Following RPM normalization but prior to the primary analysis, those authors applied a log2transformation. Han et al. (2018) integrated gene and miRNA expression. They first applied FPKM-UQ normalization RNASeq gene expression values, then calculated RPM for miRNASeq values, and transformed logarithmically. TCGA provides RPM-normalized transformation of the data, so for our integrative analysis, we applied a log2transformation to the RPM-normalized values. Empirically, we observed that this normalization was comparable to FPKM- UQ applied to the raw read counts.
To demonstrate our procedure, we performed data analysis of the BRAF pathway, a genetic signaling pathway previously studied by Zhang et al. (2017). The left-hand panel of Fig.2shows the network topology of the BRAF pathway. It consists of 10 genes—AKT1, BRAF, MAP2K1, MAP2K2, MAPK1, MTOR, NRAS, PIK3CA, PTEN, and RAF1—which are connected by 12 directed edges. The BRAF pathway is a DAG, and this property is preserved under integration with miRNA, copy number, and methylation.
AKT1
BRAF
MAP2K1
MAP2K2 MAPK1
MTOR
NRAS PIK3CA
PTEN
RAF1
AKT1
BRAF
MAP2K1
MAP2K2 MAPK1
MTOR
NRAS PIK3CA
PTEN
RAF1
Fig. 2 Network diagrams for the BRAF signaling pathway. The left-hand network is the directed graph representing the BRAF genetic signaling pathway, consisting of 10 genes with 12 directed edges between. The right-hand network contains the same 10 gene vertices, but edges represent a shared miRNA parent. In other words, two genes that share an edge are both targets of a single miRNA and possibly several. The graph contains 25 such edges. miRNA–gene targets are chosen as those entries in the mirDIP database with an “very high” confidence score. Neither the NRAS nor PTEN genes are targeted by any other genes. MAP2K1, MAP2K2, MAPK1, and PIK3CA each have in-degree 2 from other genes. The remaining genes in the network each in-degree 1 from genes. The density of miRNA–gene targets is much higher: in-degree from miRNAs ranges from 10–50 (AKT1, MAP2K1, MTOR, PIK3CA, RAF1) to 143 (PTEN), and BRAF and MAP2K2 are not targeted by any miRNAs
The mirDIP database compiled by Tokar et al. (2017) aggregates predicted miRNA–gene target relationships from several experimentally validated sources.
The database assigns each miRNA–gene pair found across any of the 30 sources a composite integrative score. The score, valued on the interval [0,1], quantifies the strength of experimental evidence that supports the existence of the interaction.
The scores are stratified by the so-called confidence classes, expressed in the labels
“very high,” “high,” “medium”, and “low” confidence. These classes, respectively, represent the top 1% of scores (very high), the next 4% of scores (high), remainder of top 33% of scores (medium), and all other scores (low). The classes offer a discrete criterion for determining whether to include inAmiEMCa specific miRNA–
gene interaction. We downloaded their mirDIP unidirectional database, version 4.1, and we considered both 3’ and 5’ UTR miRNA entries for miRNAs that were also present in the TCGA dataset.
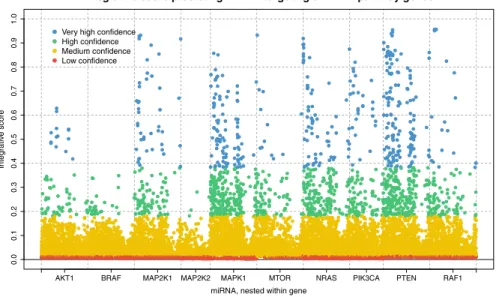
Figure3 shows a scatter plot of the miRNA–gene target scores from mirDIP for all genes in the BRAF pathway. For a given gene, we identified all miRNAs in the database that target that gene. In the figure, the scores are grouped by gene and colored by confidence class: blue represents very high confidence, green is high confidence, yellow is medium confidence, and red is low confidence.
In our analysis, we used the subset of miRNA–gene targets for which the scores in Fig.3belong to the “very high” confidence class. We can construct the secondary
Integrative score predicting miRNA targeting of BRAF pathway genes
miRNA, nested within gene
Integrative score
AKT1 BRAF MAP2K1 MAP2K2 MAPK1 MTOR NRAS PIK3CA PTEN RAF1
0.00.10.20.30.40.50.60.70.80.91.0
Very high confidence High confidence Medium confidence Low confidence
Fig. 3 miRNA–gene interaction scores for all miRNA in TCGA dataset that target any of the 10 genes that comprise the BRAF pathway. Scores are grouped by gene and colored by confidence class: very high, high, medium, and low confidence are colored blue, green, yellow, and red, respectively. For our data analysis, we included only miRNA–gene target interactions with “very high” confidence that the interaction exists, i.e., the blue scores
graph formed between genes that are both targeted by a mutual miRNA parent.
Compared with the genetic signaling pathway, this secondary network has a far denser edge set: whereas the BRAF pathway contains 12 edges, the miRNA co- target graph contains 25 edges.
More generally, this larger edge set due to miRNA–gene targets indicates that miRNA integration substantially complexifies the network structure used as input for the pathway analysis. This contrasts with the underlying simplicity of the original graph: whereas the signaling pathway consists of 10 genes, miRNA integration introduces to the network 238 vertices for miRNA observations. Nearly, half of these miRNAs target multiple genes in the BRAF pathway.
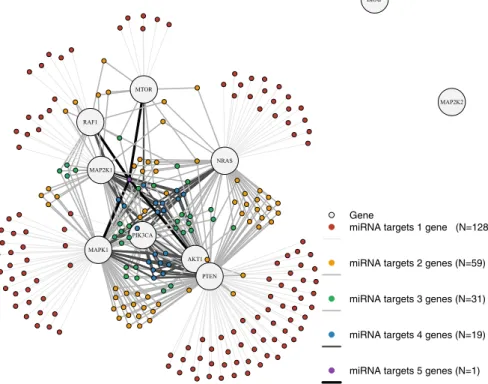
The miRNA–gene target subnetwork, corresponding to the unweighted adja- cency matrixAmi in Eq.2, is shown in Fig.4. This graph shows the subnetwork produced by the directed edges from miRNA vertices to genes, based on miRNA–
gene targets. The number of miRNAs targeting a given gene varies substantially, from as many as 143 miRNAs targeting PTEN to as few as to 0. These in-degrees from miRNA vertices are given in the caption to Fig.2.
Although most miRNAs in the TCGA dataset target a single gene in the BRAF pathway, 47% of the miRNAs target two or more genes. In the network diagram in Fig.4, miRNAs and their edges are colored according to the degree of the miRNA node, that is, the number of genes in the BRAF pathway targeted by the miRNA.
Although there are 128 miRNAs that target only a single gene, the remaining 110
AKT1
BRAF
MAP2K1
MAP2K2
MAPK1 MTOR
NRAS
PIK3CA
PTEN RAF1
Gene
miRNA targets 1 gene (N=128)
miRNA targets 2 genes (N=59)
miRNA targets 3 genes (N=31)
miRNA targets 4 genes (N=19)
miRNA targets 5 genes (N=1)
Fig. 4 Topology of subnetwork of the integrated BRAF signaling pathway corresponding to the unweighted adjacency matrixAmi in Eq.2, namely, the graph formed by miRNA–gene targets.
All edges are directed from the miRNA vertex to the gene vertex. The miRNA node colors, edge widths, and edge colors correspond to the degree of the miRNA vertex, that is, the number of genes in the BRAF pathway targeted by a given miRNA. Gray graph nodes are genes, while colored graph nodes are miRNAs, targeting 1 gene (red), 2 genes (yellow), 3 genes (green), 4 genes (blue), and 5 genes (purple). The genes BRAF and MAP2K2 are not targeted by any genes. Darker edge colors correspond to higher out-degree of the associated miRNA
target multiple genes. This intricate structure is not balanced, in neither the in-degree of gene nodes nor the out-degree of miRNA nodes. The number of unique miRNAs that target each gene varies from 58 (PTEN) to 4 (PIK3CA); while one miRNA targets 5 genes, there are 19 that target 4, 31 that target 3, and 59 that target 2.
We ob