Studies of Chamber Organic Aerosol Using an Aerodyne High-Resolution Time-of-Flight Aerosol Mass Spectrometer
Thesis by
Puneet Singh Chhabra
In Partial Fulfillment of the Requirements for the Degree of
Doctor of Philosophy
California Institute of Technology Pasadena, California
2011
(Defended May 5, 2011)
© 2011 Puneet Singh Chhabra
All Rights Reserved
inrBau Bey sgl Bau imitAw rwKy rwKnhwry ] AYsI dwiq qyrI pRB myry kwrj sgl svwry ]3]
Awsw mhlw 5, p. 383
To Mom and Dad
Acknowledgements
I am truly blessed to have had the support of so many loving and motivating individuals during my tenure at Caltech. They have made these last six years in California an incredible experience I will forever cherish. This work would not have been possible without them.
When I first mentioned that I wanted to pursue graduate research in environmental quality and air pollution, my undergraduate research advisor at the University of Illiniois at Urbana-Champaign, Professor Richard Braatz, emphatically advised me to “Work for John Seinfeld and Rick Flagan at Caltech.” Considerably ignorant of the field of atmospheric chemistry, I naively visited Caltech and met with both John and Rick and learned about their research. I was immediately impressed by their zeal for scientific inquiry, the quality of their work, and their standing in the scientific community;
however being a young adult from Chicago, I was most impressed by Southern California weather and geography.
Once I began research at Caltech, I started to understand what a privilege it was to have John and Rick as advisors. Initially, John was aware of my research inexperience and gave me a small aerosol thermodynamics problem to get me started. By meeting with him regularly and showing him my progress, I steadily gained confidence in my abilities as a scientist. Over time as I developed research skills and intuition, John gave me more independence, and soon I was in charge of my own instrument in the Roof Lab. His role as an advisor eventually evolved into that of a colleague; he has treated me professionally and as an equal, trusting my analysis and experimental decisions. I am very grateful for his management, which has consistently challenged me and rewarded me to a point where I can effectively pass my knowledge to younger students and independently tackle scientific questions. He was a clear and organized teacher, and being a TA for him was a pleasure,
never a chore. I am most thankful for his patience and ability to motivate me when I needed it. I will always look up to him as my role model for a manager, mentor, and scientist.
I am extremely lucky to have Rick Flagan as a second advisor during my time at Caltech.
His breadth of scientific and engineering knowledge never ceases to amaze me. Whenever I had a technical problem that no one seemed able to understand or solve, Rick would have a solution (or several), and he would not hesitate to help me in lab. Aside from science, I felt I could talk to him regarding any subject like teaching, administration, lab safety, or our general well-being. He could always entertain us about stories of students past and was so gracious enough to host several social events at his house. I am very grateful for his advice and friendship.
Much of the day-to-day laboratory and analysis skills I have learned have been passed down to me by several mentors. In AMS discipleship at Caltech, Jose-Luis Jimenez discipled Roya Bahreini who discipled Shane Murphy who in turn passed his knowledge to me. Shane was a wonderful mentor who taught me to question every bit of analysis I did for consistency and never let me “hand-wave”
anything. His hardware and technical expertise were available to me at all hours of the day. Jesse Kroll and I overlapped for only a short while, yet he taught me different ways of understanding the organic aerosol system. He was very supportive and appreciative of my contributions when I was struggling on Roof Lab’s steep learning curve. Sally Ng, probably the most popular member of the Roof Lab, extended to me a friendship that I enjoy to this day. Her warm, cheerful personality is complimented by a scientific rigor recognized by many in the aerosol community. I am grateful that I am able to collaborate with her even after she left Caltech.
I cannot imagine life at Caltech without my friend and colleague Arthur Chan. I often called him “my brother” because I have worked with him under John, studied with him, lived with him, and traveled with him. I have learned so much about running a lab while working with him and from having many scientific discussions with him. When we were not discussing science, we were undoubtedly cracking jokes. I look foward to progressing through academia with him in the future.
The rest of the Seinfeld/Flagan group have been unforgettable. I joined the group with Andrew Metcalf and Havala Pye, both of whom are great scientists and whose expertise I have come to rely
on. I want to thank Jason Surratt and Joey Ensberg for putting up with me as a roommate and colleague at the same time; so many late nights were spent discussing the profound and the silly.
The postdocs in our group have been like older siblings to me; Beth Kautzman, Andreas K¨urten, and Andi Zuend have been great mentors. The Roof Lab is now run by an amazing pair of scientists, Lindsay Yee and Christine Loza. I wish them the best of luck in the new lab. A very, very special thanks to Jill Craven. I was a great pleasure to be her AMS mentor and her friend and older brother of sorts. Her enthusiasm for all things is well recognized in the lab and in the AMS community. I know I will see her achieve many things in the years to come. A big thanks to everyone else: Armin Sorooshian, Harmony Gates, Man Nin Chan, Kate Schilling, Xerxes Lopez-Yglesias, Andy Downard, Mandy Grantz, Scott Hersey, Jason Gamba, Tristan Day, Ruoyu Zhang, Wei-Ting (Anne) Chen, Chinghang (Candy) Tong, Daven Henze, Amir Hakami, Phillip Stier, Zach Lebo, Yi-Chun (Jean) Chen, Alan Kwan, Nathan Eddingsaas, Fabien Paulot, John Crounse, Jason St. Clair, and Melinda Beaver. Thank you Yvette Grant, you are my Dearheart too. Thank you to my Sikh sangat and Jakara for their spiritual support.
Graduate life was so much easier with the AMS community to support me. John Jayne, Joel Kimmel, Doug Worsnop, Manjula Canagaratna, Donna Sueper, Jose-Luis Jimenez, Bill Brooks, James Allan, John Shilling, Tim Onasch, and Achim Trimborn have all helped me at some point.
I could not have made it through the first year of graduate school without my war buddies:
Mary, Yvonne, Andy, Andrew May, Leo, Kate, Eric, Erik, Diana, Kathleen, and Morgan. Thank you, thank you, thank you.
I thank God everyday for giving me a beautiful family who has taken care of me at every step of the way and shown me the love only family can. Thank you Rami Maasi, Narinder Uncle, Aman, and Harpreet for giving me a home away from home and especially for taking me in during the hard times. This thesis is dedicated to my Mom and Dad. Their sacrifices for me are unparalleled. I love you so much.
Abstract
Secondary organic aerosol (SOA) contributes a substantial fraction to total ambient particulate mass. SOA is a complex mixture of different organic species formed via many gas- and particle- phase reaction pathways. The Aerodyne aerosol mass spectrometer (AMS) has become a standard tool in measuring the bulk chemical composition of SOA in realtime. In addition to acquiring mass spectra of SOA, the high-resolution time-of-flight AMS, or HR-ToF-AMS, can distinguish and quantify ions with the same nominal mass but different elemental compositions. This thesis presents results from several studies in which the HR-ToF-AMS is used to chemically characterize SOA generated in chamber experiments.
Glyoxal is a common oxidation product of both biogenic and anthropogenic volatile organic compounds (VOCs) and is known to partition into wet inorganic aerosol. Chamber studies of glyoxal uptake onto ammonium sulfate aerosol are conducted to better understand the mechanisms controlling glyoxal uptake onto ambient aerosol. Organic growth due to glyoxal uptake was found to be reversible under dark conditions. HR-ToF-AMS spectra provide evidence for glyoxal dimers and trimers existing in the particle phase. HR-ToF-AMS spectra indicate the irreversible formation of carbon-nitrogen compounds in the aerosol. Organosulfates are not detected under dark conditions;
however, active photochemistry was found to occur within aerosol during irradiated experiments.
Carboxylic acids and organic esters are identified within the aerosol. An organosulfate, which had been previously assigned as glyoxal sulfate in ambient samples and chamber studies of isoprene oxidation, is observed only in the irradiated experiments. Comparison with a laboratory-synthesized standard and chemical considerations strongly suggest that this organosulfate is glycolic acid sulfate, an isomer of the previously proposed glyoxal sulfate.
Developments in HR-ToF-AMS data analysis have allowed for the measurement of the elemental composition of SOA. Additional graphical representations of AMS spectra and elemental composi- tion have been developed to explain the oxidative and aging processes of SOA. It has been shown previously that oxygenated organic aerosol (OOA) components from ambient and laboratory data fall within a triangular region in the f44 vs. f43 space, where f44 and f43 are the ratios of the or- ganic signal at m/z 44 and 43 to the total organic signal, respectively; we refer to this model as the “triangle plot.” Alternatively, the Van Krevelen diagram has been used to plot the elemental composition of SOA and describe the evolution of functional groups in SOA. The variability of SOA formed in chamber experiments from twelve different precursors in both “triangle plot” and Van Krevelen domains are investigated. Spectral and elemental data from the high-resolution Aerodyne aerosol mass spectrometer are compared to offline species identification analysis and FTIR filter analysis to better understand the changes in functional and elemental composition inherent in SOA formation and aging. SOA formed under high- and low-NOx conditions occupy similar areas in the “triangle plot” and Van Krevelen diagram, and SOA generated from already-oxidized precur- sors starts higher on the “triangle plot.” The most oxidized SOA come from the photooxidation of methoxyphenol precursors which yielded SOA O/C ratios near unity. α-pinene ozonolysis and naphthalene photooxidation SOA systems have had the highest degree of mass closure in previous chemical characterization studies and also show the best agreement between AMS elemental com- position measurements and elemental composition of identified species. In general the elemental composition of chamber SOA follows a slope shallower than−1 on the Van Krevelen diagram. From the spectra of SOA studied, the triangular region originally constructed with ambient OOA compo- nents with chamber aerosol can be reproduced. Ambient data in the middle of the triangle represent the ensemble average of many different SOA precursors, ages, and oxidative processes.
Contents
Acknowledgements iv
Abstract vii
1 Introduction 1
2 Glyoxal Uptake on Ammonium Sulfate Seed Aerosol: Reaction Products and Reversibility of Uptake under Dark and Irradiated Conditions 5
2.1 Abstract . . . 5
2.2 Introduction . . . 6
2.3 Experimental Procedures . . . 10
2.3.1 Teflon Filter Collection and Offline Chemical Analysis . . . 12
2.3.2 Aerodyne Aerosol Mass Spectrometer . . . 13
2.3.3 Madison Laser-Induced Phosphorescence Instrument . . . 13
2.4 Results . . . 14
2.4.1 Glyoxal Uptake in the Absence of Light . . . 14
2.4.2 Glyoxal Uptake in the Presence of Light . . . 15
2.5 Discussion . . . 16
2.5.1 Organosulfate Formation . . . 16
2.5.2 Carbon-Nitrogen Containing Compound Formation . . . 18
2.5.3 Overall Organic Growth and Glyoxal Oligomer Formation . . . 21
2.5.4 Glyoxal Uptake under Irradiated Conditions . . . 23
2.5.5 Implications to Ambient Aerosol . . . 25
2.6 Conclusions . . . 26
2.7 Acknowledgements . . . 27
3 Elemental Analysis of Chamber Organic Aerosol Using an Aerodyne High-Resolution Aerosol Mass Spectrometer 49 3.1 Abstract . . . 49
3.2 Introduction . . . 50
3.3 Experimental Section . . . 53
3.3.1 Chamber Operation . . . 53
3.3.2 High-Resolution Time-of-Flight Aerosol Mass Spectrometer . . . 54
3.4 Results . . . 57
3.4.1 SOA from Reactive Uptake of Glyoxal . . . 57
3.4.2 α-pinene Ozonolysis SOA . . . 59
3.4.3 Isoprene SOA . . . 61
3.4.4 Single-Ring Aromatic SOA . . . 64
3.4.5 Naphthalene SOA . . . 66
3.5 Discussion . . . 67
3.5.1 Overall Trends in O/C Ratios from Laboratory Chamber-Generated SOA . . 67
3.5.2 Comparisons with Offline Analytical Techniques . . . 69
3.5.3 Uncertainty in the AMS Elemental Analysis . . . 71
3.5.4 AMS Marker Ions and SOA Oxygenation . . . 74
3.6 Comparison of Chamber and Ambient Elemental Ratios and Spectra . . . 75
3.7 Acknowledgements . . . 78
4 Elemental Composition and Oxidation of Chamber Organic Aerosol 110 4.1 Abstract . . . 110
4.2 Introduction . . . 111
4.3 Experimental Section . . . 114
4.3.1 Chamber Operation . . . 114
4.3.2 High-Resolution Time-of-Flight Aerosol Mass Spectrometer . . . 115
4.3.3 Fourier Transform Infrared Spectroscopy (FTIR) . . . 115
4.4 Results . . . 116
4.4.1 α-pinene SOA . . . 117
4.4.2 Isoprene SOA . . . 118
4.4.3 Single-Ring Aromatic SOA . . . 119
4.4.4 Naphthalene SOA . . . 120
4.4.5 Phenol and Methoxyphenol SOA . . . 121
4.4.6 Unsaturated Aldehyde SOA . . . 121
4.4.7 SOA from Reactive Uptake of Glyoxal . . . 122
4.5 Discussion and Conclusions . . . 123
4.6 Acknowledgements . . . 126
5 Conclusions 148
A Supplementary Material for “Elemental Analysis of Chamber Organic Aerosol Using an Aerodyne High-Resolution Aerosol Mass Spectrometer” 151
B Supplementary Material for “Elemental Composition and Oxidation of Chamber
Organic Aerosol” 163
C Changes in Organic Aerosol Composition with Aging Inferred from Aerosol Mass
Spectra 176
D Organic Aerosol Components Observed in Northern Hemispheric Datasets from
Aerosol Mass Spectrometry 186
E Role of Aldehyde Chemistry and NOx Concentrations in Secondary Organic
Aerosol Formation 204
F Modeling of Secondary Organic Aerosol Yields from Laboratory Chamber Data225
List of Tables
2.1 Experimental conditions of dark experiments . . . 36
2.2 Experimental conditions of irradiated experiments . . . 37
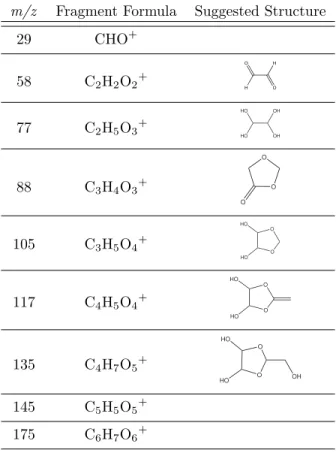
2.3 GL fragments observed via AMS and suggested structures from which the fragments are formed . . . 38
2.4 Fragments containing both carbon and nitrogen observed and suggested chemical formulas 39 3.1 Experimental conditions and results . . . 91
3.2 Elemental composition of each SOA system . . . 92
3.3 O/C ratios of various laboratory SOA systems . . . 93
4.1 Experimental conditions and results . . . 138
List of Figures
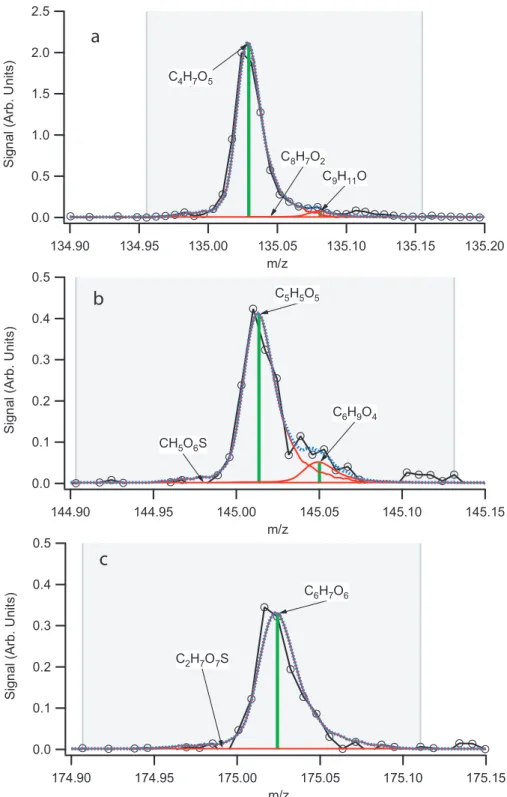
2.1 Processes contributing to GL uptake on AS seed aerosol. . . 40 2.2 Proposed structures form/z 155; glyoxal sulfate and glycolic acid sulfate. . . 41 2.3 Representative unit-mass AMS spectrum. . . 42 2.4 High-resolution (“W-mode”) AMS peaks allow unequivocal assignment of a C4H7O5+
formula to them/z 135, C5H5O5+ formula to them/z 145, and C6H7O6+ formula to them/z 175 fragment ions. . . 43 2.5 UPLC/ESI-TOFMS extracted ion chromatograms (EICs) ofm/z 155 for selected GL
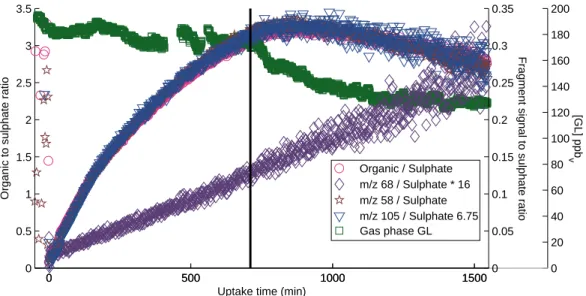
experiments. . . 44 2.6 The time traces of total organic,m/z 58, 105, and 68 fragment ions normalized by the
sulfate ion signal along with gas phase GL concentrations for a dilution experiment. . 45 2.7 The sulfate normalized GL and GL oligomer marker signalsm/z 58 and 105. . . 46 2.8 High-resolution (W-mode) AMS peaks allow unequivocal assignment of a C3H4N2+
formula to them/z 68, C4H4N2O+ formula to them/z 96 fragment ions. . . 47 2.9 Proposed formation mechanism of 1H-imidazole-2-carboxaldehyde and observedm/z68
and 96 fragment ion. . . 48
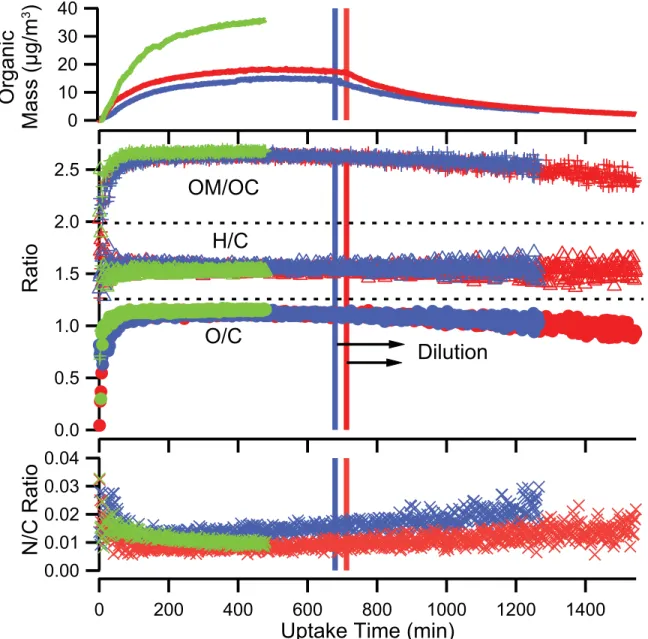
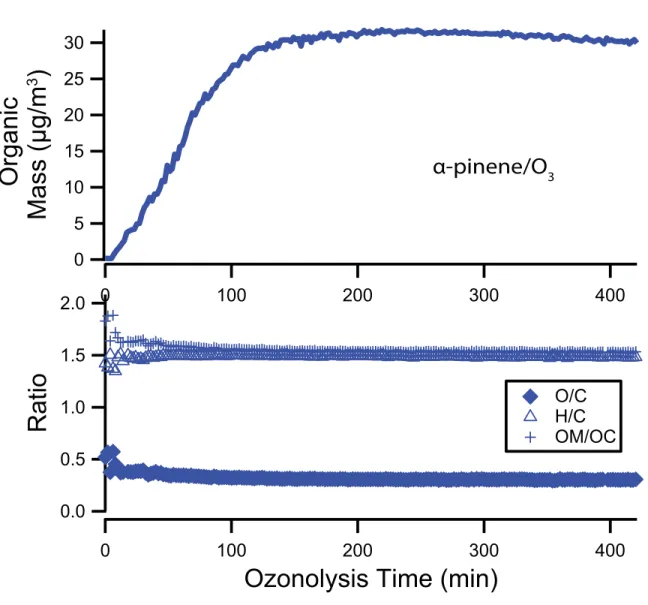
3.1 Experimental profile of AMS organic mass, elemental ratios, and OM/OC for glyoxal uptake experiments. . . 94 3.2 High-resolution mass spectra of glyoxal andα-pinene. . . 95 3.3 AMS organic mass, O/C, H/C and OM/OC ratios for a typical α-pinene ozonolysis
experiment . . . 96
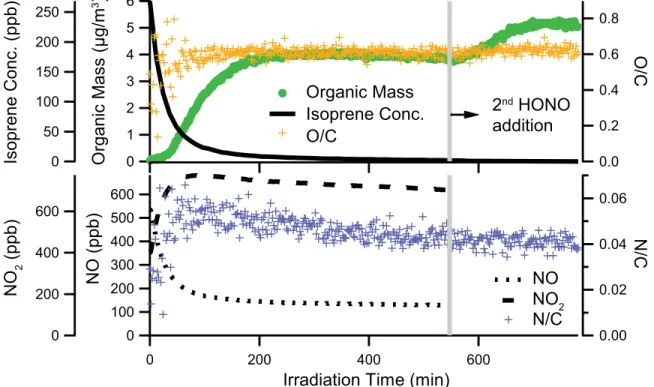
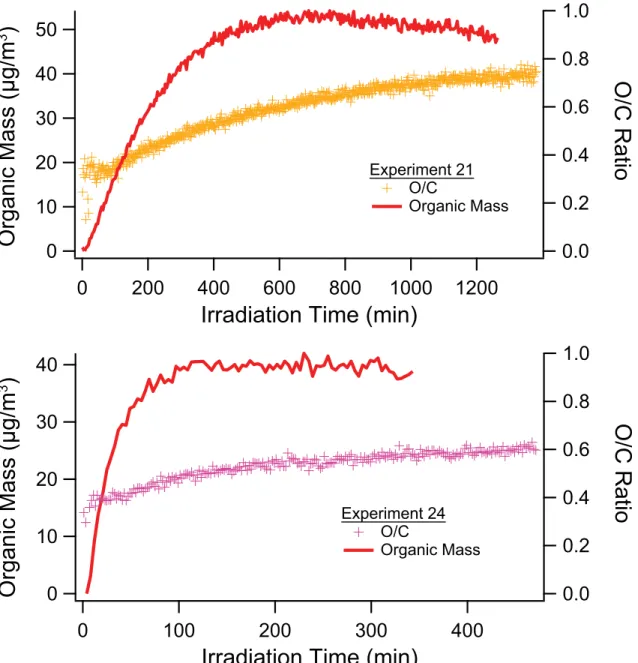
3.4 AMS organic mass loading and O/C, H/C and OM/OC ratios of isoprene SOA formed under low-NOx conditions. . . 97 3.5 High-resolution mass spectra of isoprene SOA. . . 98 3.6 AMS organic mass, elemental ratios, and OM/OC for isoprene high-NOx experiments. 99 3.7 Experimental conditions for Experiment 12. . . 100 3.8 AMS organic mass, elemental ratios, and OM/OC for single-ring aromatic experiments. 101 3.9 High-resolution mass spectra of toluene SOA. . . 102 3.10 High-resolution mass spectra ofm-xylene SOA. . . 103 3.11 Organic mass, elemental ratios, and OM/OC for naphthalene high-NOx experiments. 104 3.12 Organic mass, elemental ratios, and OM/OC for naphthalene low-NOx experiments. . 105 3.13 Organic mass and O/C ratio as a function of time for typical naphthalene photooxida-
tion experiments. . . 106 3.14 High-resolution mass spectra of naphthalene-SOA. . . 107 3.15 O/CHR vs. f44 for ambient Mexico City OA and chamber OA. . . 108 3.16 O/C ratios for ambient Mexico City organic aerosol, typical AMS components derived
from positive matrix factorization (PMF), and chamber SOA as a function of precursor carbon number. . . 109
4.1 Structures of the SOA precursors presented in this study. . . 139 4.2 Triangle plot and Van Krevelen diagrams for α-pinene SOA formed from ozonolysis
and high- and low-NOx photooxidation. . . 140 4.3 Triangle plot and Van Krevelen diagram for SOA formed from photooxidation of isoprene.141 4.4 Triangle plot and Van Krevelen diagram for SOA formed from photooxidation of toluene
andm-xylene. . . 142 4.5 Triangle plot and Van Krevelen diagram for SOA formed from photooxidation of naph-
thalene. . . 143 4.6 Triangle plot and Van Krevelen diagram for SOA formed from the photooxidation of
methoxyphenols. . . 144
4.7 Triangle plot and Van Krevelen diagram for SOA formed from unsaturated aldehydes. 145 4.8 Triangle plot and Van Krevelen diagram for SOA formed from the reactive uptake of
glyoxal onto wet ammonium sulfate aerosol. . . 146 4.9 Triangle plot and Van Krevelen diagram for all systems. . . 147
Chapter 1
Introduction
Ambient aerosols are liquid or solid particles suspended in air, and they play an important role in many natural processes. Particulate matter can directly influence climate by scattering and absorbing solar and terrestrial radiation (IPCC, 2007). Indirectly, particulate matter can influence the climate by acting as cloud condensation nuclei, thereby affecting cloud formation, albedo, and lifetime. Aerosols also can adversely affect human health and have been correlated with increased mortality rates (Pope and Dockery, 2006). Therefore, understanding the formation and properties of aerosols is crucial to predicting their effects on climate and health.
Recent studies have shown that organic compounds can contribute up to 90% of total aerosol mass (Hallquist et al., 2009). Organic aerosol (OA) is either directly emitted into the atmosphere as primary organic aerosol (POA) or formed in situ via gas-phase oxidation and subsequent partitioning of anthropogenic and biogenic volatile organic compounds (VOCs). This type of aerosol is known as secondary organic aerosol (SOA) and is comprised of a complex mixture of many different organic compounds formed as a result of the variety of reaction pathways leading to semivolatile products.
Many different techniques have been developed to chemically characterize SOA. Offline analysis techniques can typically quantify only a small portion of the wide array of compounds present in SOA. Though generally not able to provide detailed, composition profiles of organic aerosol (OA), bulk, real-time mass spectrometric analysis has become standard in chemically characterizing OA.
The widely used Aerodyne aerosol mass spectrometer (AMS) uses thermal vaporization followed by electron impact ionization and a mass spectrometer to quantify the nonrefractory portion of submicron aerosol mass (Jayne et al., 2000; Jimenez et al., 2003; Canagaratna et al., 2007). Recent technological upgrades have led to the development of the high-resolution time-of-flight aerosol mass spectrometer (HR-ToF-AMS) which can distinguish and quantify ions with the same nominal mass but different elemental compositions. The additional information in high-resolution spectra allows for a more detailed analysis of SOA formation mechanisms and the elemental composition of SOA.
Laboratory chambers enable the investigation of a specific SOA system in which the precursor VOC can be chosen and the oxidative environment controlled. Chamber experiments are crucial to constraining SOA models and providing insight into the mechanisms involved in the formation
and evolution of SOA (Kroll and Seinfeld, 2008). This thesis presents several studies in which the HR-ToF-AMS is used to chemically characterize chamber SOA. In chapter 2, the uptake of glyoxal onto wet ammonium sulfate seed aerosol in dark conditions and in the presence of light is examined.
In chapters 3 and 4, the elemental composition of chamber SOA from a comprehensive suite of SOA systems is studied. In addition, HR-ToF-AMS data are compared to other laboratory composition and discrepancies and sources of uncertainty are identified. Particularly, in chapter 4, HR-ToF- AMS data of chamber SOA are presented in two different graphical representations to explain the oxidative and aging processes of SOA.
Bibliography
Canagaratna, M. R., Jayne, J. T., Jimenez, J. L., Allan, J. D., Alfarra, M. R., Zhang, Q., Onasch, T. B., Drewnick, F., Coe, H., Middlebrook, A., Delia, A., Williams, L. R., Trimborn, A. M., Northway, M. J., DeCarlo, P. F., Kolb, C. E., Davidovits, P., and Worsnop, D. R.: Chemical and microphysical characterization of ambient aerosols with the aerodyne aerosol mass spectrometer, Mass Spectrom. Rev., 26, 185–222, doi:10.1002/Mas.20115, 2007.
Hallquist, M., Wenger, J. C., Baltensperger, U., Rudich, Y., Simpson, D., Claeys, M., Dommen, J., Donahue, N. M., George, C., Goldstein, A. H., Hamilton, J. F., Herrmann, H., Hoffmann, T., Iinuma, Y., Jang, M., Jenkin, M. E., Jimenez, J. L., Kiendler-Scharr, A., Maenhaut, W., McFiggans, G., Mentel, T. F., Monod, A., Prevot, A. S. H., Seinfeld, J. H., Surratt, J. D., Szmigielski, R., and Wildt, J.: The formation, properties and impact of secondary organic aerosol:
current and emerging issues, Atmos. Chem. Phys., 9, 5155–5236, doi:10.5194/acp-9-5155-2009, 2009.
Intergovernmental Panel on Climate Change (IPCC): Climate Change 2007: The Physical Science Basis, Cambridge Univ. Press, Cambridge, United Kingdom, 2007.
Jayne, J. T., Leard, D. C., Zhang, X. F., Davidovits, P., Smith, K. A., Kolb, C. E., and Worsnop,
D. R.: Development of an aerosol mass spectrometer for size and composition analysis of submicron particles, Aerosol Sci. Technol., 33, 49–70, doi:10.1080/027868200410840, 2000.
Jimenez, J. L., Jayne, J. T., Shi, Q., Kolb, C. E., Worsnop, D. R., Yourshaw, I., Seinfeld, J. H., Flagan, R. C., Zhang, X. F., Smith, K. A., Morris, J. W., and Davidovits, P.: Ambient aerosol sampling using the Aerodyne Aerosol Mass Spectrometer, J. Geophys. Res.-Atmos., 108(D7), 8425, doi:10.1029/2001jd001213, 2003.
Kroll, J. H. and Seinfeld, J. H.: Chemistry of secondary organic aerosol: Formation and evolution of low-volatility organics in the atmosphere, Atmos. Environ., 42, 3593–3624, doi:10.1016/j.atmosenv.2008.01.003, 2008.
Pope III, C. A. and Dockery, D. W.: Health effects of fine particulate air pollution: Lines that connect, J. Air Waste Manage., 56, 709–742, 2006.
Chapter 2
Glyoxal Uptake on Ammonium Sulfate Seed Aerosol: Reaction Products and Reversibility of
Uptake under Dark and Irradiated Conditions ∗
2.1 Abstract
Chamber studies of glyoxal uptake onto ammonium sulfate aerosol were performed under dark and irradiated conditions to gain further insight into processes controlling glyoxal uptake onto ambient aerosol. Organic fragments from glyoxal dimers and trimers were observed within the aerosol under dark and irradiated conditions. Glyoxal monomers and oligomers were the dominant organic com- pounds formed under the conditions of this study; glyoxal oligomer formation and overall organic growth were found to be reversible under dark conditions. Analysis of high-resolution time-of-flight aerosol mass spectra provides evidence for irreversible formation of carbon-nitrogen (C-N) com- pounds in the aerosol. We have identified 1H-imidazole-2-carboxaldehyde as one C-N product. To the authors’ knowledge, this is the first time C-N compounds resulting from condensed phase reac- tions with ammonium sulfate seed have been detected in aerosol. Organosulfates were not detected
∗Reproduced with permission from “Glyoxal uptake on ammonium sulphate seed aerosol: reaction products and reversibility of uptake under dark and irradiated conditions” by M. M. Galloway, P. S. Chhabra, A. W. H. Chan, J. D. Surratt, R. C. Flagan, J. H. Seinfeld, and F. N. Keutsch,Atmospheric Chemistry and Physics, 9, 3331–3345, doi:10.5194/acp-9-3331-2009. Copyright 2009 by the Authors. CC Attribution 3.0 License.
under dark conditions. However, active photochemistry was found to occur within aerosol during irradiated experiments. Carboxylic acids and organic esters were identified within the aerosol. An organosulfate, which had been previously assigned as glyoxal sulfate in ambient samples and cham- ber studies of isoprene oxidation, was observed only in the irradiated experiments. Comparison with a laboratory-synthesized standard and chemical considerations strongly suggest that this organosul- fate is glycolic acid sulfate, an isomer of the previously proposed glyoxal sulfate. Our study shows that reversibility of glyoxal uptake should be taken into account in SOA models and also demon- strates the need for further investigation of C-N compound formation and photochemical processes, in particular organosulfate formation.
2.2 Introduction
Organic aerosol has been detected in substantial concentrations in urban and rural atmospheres (Zhang et al., 2007). Secondary organic aerosol (SOA) contributes significantly to particulate mat- ter, though current models considerably underestimate SOA formation (de Gouw et al., 2005; Heald et al., 2005; Volkamer et al., 2006). In order to understand the possible health and climate ef- fects of particulate matter, it is critical that the physical and chemical models of SOA formation be improved. Glyoxal (GL) is produced by a wide variety of biogenic and anthropogenic volatile organic compounds (VOCs), many of which are SOA precursors, and is considered a tracer for SOA formation. One current model estimates global GL production of 45 Tg/yr, with roughly half due to isoprene photooxidation (Fu et al., 2008), and another estimates 56 Tg/yr of global GL production with 70% being produced from biogenic hydrocarbon oxidation (Myriokefalitakis et al., 2008). In addition to acting as a tracer for SOA formation, GL has been suggested as a direct contributor to SOA (Sorooshian et al., 2006; Volkamer et al., 2007; Carlton et al., 2007; Ervens et al., 2008; Fu et al., 2008; Volkamer et al., 2009). A study comparing observed and modelled GL has suggested that GL could contribute at least 15% of the SOA in Mexico City (Volkamer et al., 2007), while a study using the GEOS-Chem model found the modelled GL contribution to SOA to be 2.6 Tg C/year out of a total of 29 Tg C/year (Fu et al., 2008).
Despite existing research aimed at elucidating SOA formation by GL, further quantification of SOA yields as a function of conditions such as relative humidity, irradiation, gas-phase GL mixing ratio, and seed aerosol composition and pH are required in order to allow for the application of laboratory findings to ambient conditions. On a more fundamental level, it is desirable to achieve a detailed understanding of the processes contributing to SOA formation from GL as a function of the above conditions. GL is also promising as an interesting model system for compounds that can yield SOA via purely physical absorption processes and via complex condensed phase processes, such as oligomerization, organosulfate formation, condensation, and photochemical reactions.
The standard models that have been employed to explain organic gas-particle partitioning have generally assumed physical absorption processes (Pankow, 1994a,b; Odum et al., 1996). On this basis, GL, the smallest dicarbonyl, should have virtually no SOA yield because of its high vapour pressure (220 torr at 20◦C (Kielhorn et al., 2004)). However, GL partitions strongly to aqueous condensed-phase systems, which is reflected in a surprisingly high effective Henry’s law constant, KH,aq∗ =3.6×10⁵M/atm for seawater (Zhou and Mopper, 1990) and 4.19×10⁵M/atm in water (Ip et al., 2009). The effective Henry’s law constant of GL is higher than that of atmospherically relevant monocarboxylic acids including glyoxylic acid,KH,aq∗ =1×10⁴M/atm (Ip et al., 2009), the acid that results from oxidation of one of the aldehyde groups in GL. Glycolic acid, an isomer of glyoxal monohydrate, also has a lower effective Henry’s law constant of 2.83×10⁴M/atm (Ip et al., 2009).
The high effective Henry’s law constant of GL has been explained by the hydration of the aldehyde groups, producing an effectively lower vapor pressure species in aqueous solution. In addition to the physical absorption processes, particle-phase chemical reactions have been identified as a possible driving force for uptake. Carbonyl containing species are known to participate in aldol, acetal, and esterification reactions, which form low-volatility compounds that add to SOA mass. Field and laboratory studies have also yielded evidence for the formation of high molecular weight products within SOA (Gross et al., 2006; Reinhardt et al., 2007; Denkenberger et al., 2007) and it is well known that GL will polymerize in the presence of water (Whipple, 1970; Loeffler et al., 2006).
These properties of GL, together with its production via oxidation of many VOCs, have inspired
chamber investigations into GL partitioning onto a variety of seed particles (Jang et al., 2002;
Liggio et al., 2005a,b; Kroll et al., 2005; Corrigan et al., 2008; Volkamer et al., 2009). Liggio et al. (2005b) have demonstrated reactive uptake of GL onto several different types of seed aerosol using an Aerodyne aerosol mass spectrometer (AMS). This study suggested that GL uptake onto ammonium sulfate (AS) aerosol is irreversible and enhanced with acidified seed. However, Kroll et al.
(2005) observed negligible acid effect and reversible GL uptake onto AS seed aerosol that is possibly controlled by ionic strength. The authors concluded that GL uptake obeys a modified effective Henry’s Law at equilibrium (KH,AS∗ =2.6×10⁷M/atm; using a density of 1 g/cm3 to convert volume growth to organic mass and normalizing by the seed volume). Both Liggio et al. (2005b) and Kroll et al. (2005) observed hydration and oligomerization of GL within aerosol and, in addition, Liggio et al. (2005b) proposed irreversible formation of the organosulfate of GL (GL sulfate) to explain certain peaks in the AMS mass spectra. Volkamer et al. (2009) demonstrated that acetylene is an SOA precursor and estimated that almost all particle-phase organic growth was due to its oxidation product, GL. SOA yields were shown to correlate with the liquid water content (LWC) of the AS seed.
Therefore, the authors introduced a modified definition of molarity, calculating GL concentrations with respect to LWC fraction of the seed volume, which gaveKH,AS∗∗ =1.65×10⁸M/atm. Evaluating the data from Kroll et al. (2005) in this manner givesKH,AS∗∗ =1.07×10⁸M/atm. However, in addition to the larger effective Henry’s law constant in the study of Volkamer et al. (2009), this uptake in the presence of OH radicals and UV light was achieved in 90 seconds compared to many hours under dark conditions in the work by Kroll et al. (2005).
The difference between the Henry’s law constant of water and AS aerosol is substantial and the reasons for this are not well understood. Recently, Ip et al. (2009) found that the effective Henry’s Law increases with increasing sulfate concentration. At a sodium sulfate ionic strength of 0.03 mol/L (M), KH∗=2.40×10⁷M/atm. This is 50 times higher thanKH,aq∗ and 12 times higher than with a sodium chloride ionic strength of 0.05 M. Ip et al. (2009) concluded that the presence of sulfate has a greater effect on the effective Henry’s Law than ionic strength alone. Increasing the ionic strength of sulfate to 0.225 M increases the KH∗ to the point that it could not be measured,
a value suggested to be ≥109M/atm. This sulfate concentration is still substantially lower than that in the AS aerosol studies, but the suggested effective Henry’s law constant is substantially larger than for the AS aerosol. It is possible that with increasing sulfate concentration and thus decreasing LWC,KH∗ of GL first increases up to a maximum and then decreases again. A similar effect was found by Ip et al. (2009) for sodium chloride solutions. This indicates that the amount of GL partitioning to the condensed phase is dependent on more than just the LWC over the entire range of sulfate concentrations. The mechanism that is at work is still unknown, and the importance of this observation over the more limited sulfate concentration range of ambient aerosol is unclear.
Bulk studies have also provided valuable insight into the aqueous GL system. Carlton et al. (2007) performed photochemical reactions of GL and hydrogen peroxide and demonstrated that SOA yield from GL depends on photochemical processing. Recent work by Nozi`ere et al. (2009) showed that GL reacts to form high molecular weight compounds and postulated that the ammonium ion is a catalyst for condensed phase GL reactions such as oligomerization. In a different study, Shapiro et al. (2009) showed that light-absorbing complexes were observed in solutions containing AS and GL but not in sodium sulfate or sodium chloride solutions, indicating that nitrogen is central to the formation of light-absorbing complexes.
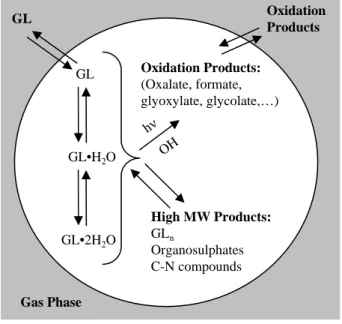
In light of these investigations, it is clear that particle-phase chemistry plays a crucial role in the gas/particle partitioning of GL, though the processes controlling uptake are still not clear. In this study, we examine the uptake processes onto wet AS seed aerosol using a variety of instrumentation in dark conditions and in the presence of light. Figure 2.1 shows the major processes that could be contributing to GL uptake. The processes that have been identified by previous studies are:
1. GL-hydrate formation is fast and reversible (Schweitzer et al., 1998). Hydration equilibria up to GL·2H2O, the dominant form of GL in dilute aqueous solutions, are included inKH,aq∗ (Zhou and Mopper, 1990). Some studies have demonstrated correlation of organic growth with water content of aerosol (Volkamer et al., 2009), whereas others have shown growth at extremely low water content and noted that GL·nH2O concentrations appear to be independent of gas-phase GL concentrations (Corrigan et al., 2008).
2. Glyoxal oligomers (GLn) have been detected by time-of-flight and quadrupole AMS studies of aerosol growth from GL uptake in chamber experiments (Kroll et al., 2005; Liggio et al., 2005b); no definitive evidence for GLnin field samples has been found, likely due to analytical challenges. GLnformation is reversible and slow (many minutes to hour timescales) in aqueous GL/H2O solutions (Whipple, 1970; Fratzke and Reilly, 1986), and there are indications from a previous study that it is reversible in AS aerosol (Kroll et al., 2005).
3. The proposed GL sulfate (C2H3SO6−
, Fig. 4.1) is of much interest as it has been detected via filter sampling methods in field samples (Surratt et al., 2007, 2008; G´omez-Gonz´alez et al., 2008) and in chamber studies of isoprene oxidation under intermediate- to high-NOxconditions (Surratt et al., 2008). The formation conditions for C2H3SO6− as well as its contribution to KH,AS∗ are unclear. Irreversible formation of C2H3SO6− would not contribute to KH,AS∗ , however, reversible formation would have an effect onKH,AS∗ .
In this study we aim to investigate the processes contributing to overall GL uptake as well as which of these processes are effectively reversible, meaning reversible over aerosol lifetimes. These questions are important for evaluating applicability of laboratory studies to ambient conditions and net SOA yields from GL. If most GL uptake is effectively reversible, the organic aerosol will revolatilize at lower GL gas-phase concentrations upon transport away from GL sources or at night.
Net SOA yields from a specific process will be higher if that process is irreversible.
2.3 Experimental Procedures
Experiments were performed in Caltech’s indoor, dual 28 m3Teflon environmental chambers (Cocker et al., 2001; Keywood et al., 2004). The experimental conditions are summarized in Tables 2.1 and 2.2. Each chamber has a dedicated Differential Mobility Analyzer (DMA, TSI model 3081) coupled with a condensation nucleus counter (TSI model 3760) for measuring aerosol size distribution, and number and volume concentration. Temperature, relative humidity (RH), O3, NO, and NOx were continuously monitored. AS seed particles were generated by atomization of a 0.015 M aqueous AS
solution using a constant rate atomizer. Acidic seed particles were generated by atomization of a 0.015 M aqueous AS solution containing 0.015 M sulphuric acid. GL was prepared by heating a mixture of solid GL trimer dihydrate (Sigma, minimum 97%) and phosphorus pentoxide (P2O5) to
∼160◦C under vacuum. The monomer was collected in an LN2 trap as a yellow solid and stored overnight at −20◦C. Before each experiment, the frozen monomer was allowed to vaporize into a 500 mL glass bulb and introduced into the chamber using a gentle air stream. The chamber was kept at ∼60% RH. The concentration of an inert tracer, cyclohexane, was monitored using a gas- chromatograph with flame ionization detector (GC-FID, Agilent 6890N).
Dark experiments typically began by introducing gas-phase GL into a dark chamber and allowing the concentration to equilibrate over∼10 h. Approximately 160 ppbv(part-per-billion by volume) of cyclohexane was also added as a tracer for dilution. Once the gas-phase GL concentration reached a steady state, AS seed was introduced, and the resulting organic growth was monitored by both the DMA and a high resolution time-of-flight AMS (HR-ToF-AMS, hereby referred to as AMS).
After organic growth levelled off, the chamber air mass was diluted with clean hydrocarbon-free air to investigate the reversibility of uptake. The amount of dilution was calculated by monitoring the cyclohexane concentration with the GC-FID. In some experiments, AS seed was added first and then GL, though the results are the same.
Experiments with irradiation began similarly to dark experiments but when the addition of GL or AS seed was complete, the chamber lights were turned on. No external OH or NOx source was added, and no dilution was performed in irradiated experiments.
Two blank experiments (Exp. 7 and 11) were conducted in which wet AS seed was atomized into a humid chamber without GL present. A negligible organic signal was measured in the absence of radiation, most likely due to background organics from the chamber walls. Under irradiation, miniscule organic growth was observed.
2.3.1 Teflon Filter Collection and Offline Chemical Analysis
Teflon filters (PALL Life Sciences, 47 mm diameter, 1.0µm pore size, teflo membrane) were collected from each experiment for offline chemical analysis. Filter sampling was initiated when the aerosol volume reached its maximum (constant) value, as determined by the DMA. Depending on the total volume concentration of aerosol in the chamber, the duration of filter sampling was 3.6–4.1 h, which resulted in∼5.1–5.8 m3of total chamber air sampled. Collected filters were extracted in high-purity methanol, dried, and then reconstituted with 250µL of a 1:1 (v/v) solvent mixture of 0.1% acetic acid in water and 0.1% acetic acid in methanol (Surratt et al., 2008). All filter extracts were analyzed by a Waters ACQUITY ultra performance liquid chromatography (UPLC) system, coupled to a Waters LCT Premier XT time-of-flight mass spectrometer (TOFMS) equipped with an electrospray ionization (ESI) source. The ESI source was operated in both negative (−) and positive (+) ion mode; acidic GL SOA components were detected in the negative ion mode, whereas C-N compounds (e.g., imidazoles) were detected in the positive ion mode. All other operating conditions for this technique have been fully described elsewhere (Surratt et al., 2008).
Blank Teflon filters were extracted and treated in the same manner as the samples; none of the SOA products detected on the filter samples collected from the GL chamber experiments were observed in these blanks, indicating that these SOA components were not introduced during sample storage and/or preparation. Furthermore, to ensure that the SOA components observed were not an artifact formed from the collection of gaseous GL onto filter media, a blank filter was collected under dark conditions from the chamber containing a well-mixed concentration of GL (∼2 ppmv) and analyzed with UPLC/ESI-HR-TOFMS. This blank was sampled for the same duration as a sample filter. No SOA components characterized in the present study or significant contaminants were observed, consistent with the lack of observed aerosol growth in the absence of light and AS seed aerosol. All filters used for UPLC/ESI-HR-TOFMS analysis were examined within 1–2 days of the filter extraction/sample preparation. Following their initial analysis, sample extract solutions were stored at−20◦C. Selected samples were reanalyzed a month after initial extraction and showed no signs of degradation.
2.3.2 Aerodyne Aerosol Mass Spectrometer
Real-time particle mass spectra were collected continuously by the AMS, which is described in detail elsewhere (DeCarlo et al., 2006; Canagaratna et al., 2007, and references therein). The AMS switched once every minute between a high resolution “W-mode” and a lower resolution, higher sensitivity
“V-mode.” The “V-mode” data were analyzed using a fragmentation table to separate out sulfate, ammonium, and organic spectra and to time-trace specific mass-to-charge ratios. “W-mode” data were analyzed using a separate high-resolution spectra toolbox known as PIKA to determine the chemical formulas contributing to distinct mass-to-charge ratios (DeCarlo et al., 2006). Since GL easily fragments to produce CH2O+, the fragmentation table was corrected so that the organic signal at m/z 30 was equal to its total signal minus the contribution from air. The nitrate contribution was changed to approximately 1.3 times the nitrate signal atm/z 46 as this was them/z 30/46 ratio during ammonium nitrate calibrations.
To determine elemental ratios, the computational toolbox known as Analytical Procedure for Elemental Separation (APES) was used. This toolbox applies the analysis procedure described in Aiken et al. (2007) to the high-resolution “W-mode data.” The particle-phase signal of CO+ and the organic contribution to HxO+ ions were estimated as described in Aiken et al. (2008).
2.3.3 Madison Laser-Induced Phosphorescence Instrument
Gas-phase GL was detected with high specificity via Laser-Induced Phosphorescence (LIP) using the Madison LIP Instrument described in Huisman et al. (2008). This instrument utilizes a White- type multipass cell in a 2-pass configuration with gated photon counting and is highly sensitive, permitting specific, direct, in situ measurement of GL with a one-minute limit of detection (3σ) of 6 pptv (part-per-trillion by volume) per minute in a 32-pass configuration.
2.4 Results
2.4.1 Glyoxal Uptake in the Absence of Light
For a typical experiment, gas-phase GL was present in the chamber and equilibrated with the chamber walls prior to the introduction of AS seed particles. Organic growth began immediately upon particle addition, and reached a maximum after approximately 10 h; over this time period, sulfate and ammonium decreased due to particle wall losses. A representative unit-mass AMS spectrum is shown in Fig. 2.3. The fragments of interest to this study are summarized in Tables 2.3 and 2.4. The most significant fragments are m/z 44, 58, 68, 135, 145, and 175. The observed fragments are in general accord with those observed by Liggio et al. (2005a), though certain masses such as m/z 192 and 193 have lower signals in this study. Proposed precursor structures for the fragment masses marked in Fig. 2.3 are listed in Table 2.3. The fragment chemical formulae are unequivocally confirmed by the high-resolution spectra obtained in “W-mode,” verifying many of the assignments made by Liggio et al. (2005a). Masses listed in Table 2.3 which are larger than or equal tom/z 77 represent ion fragments of oligomers; as an example, the high-resolution peak for m/z 135 is shown in Fig. 2.4a. In the high resolution spectra, the only fragment ion found to contain both sulphur and carbon ism/z 79 (CH3SO2+); however, the signal intensity is similar to that in the blank experiment (Exp. 7). Filter sample analysis did not detect any organosulfates under dark conditions in neutral (Exp. 4) or acidic seed (Fig. 2.5c, Exp. 5 and 6), as can be seen in the comparison between experiments carried out under irradiated conditions (Fig. 2.5a, Exp. 10) and experiments performed in the dark (Fig. 2.5b, Exp. 3).
After particle growth has stopped, the chamber was diluted with clean air (Exp. 1 and 3) to investigate the reversibility of GL uptake. Upon dilution, the concentrations of tracer, gas-phase GL, and particle-phase organic, sulfate, and ammonium decreased. To remove the effect of the decrease in overall particle volume due to wall loss and to dilution, the organic and several marker signals are normalized to sulfate. This normalized signal is proportional to the condensed phase concentration of each species. The normalized organic signal and GL markers at m/z 58 andm/z 105 decrease
after dilution by 15%–25% and 18%–30%, respectively. The gas-phase GL concentration decreased by 25%–40% of the initial concentration and the overall organic signal decreased relative to the tracer signal. Figure 2.6 shows this for a typical dilution experiment (Exp. 3).
Several fragments were observed by the AMS to have different temporal characteristics (and thus uptake kinetics) than the total organic or GLn signal. Relatively strong signals occurred at m/z 41, 68, 69, and 70. Weaker signals, approximately 5–10 times lower in magnitude, were also detected at other masses, the largest fragment occurring atm/z 96. The signal atm/z 68 increased immediately upon seed injection and grew steadily, even after no further change in total organic growth was observable within the uncertainty of that measurement. Furthermore, during dilution, the signal continued to increase when normalized to the sulfate signal. These compounds contribute only ∼0.5% of total organic mass measured by the AMS, but the sensitivity for these compounds or the GLn has not been calibrated, and it is unlikely such a calibration can be achieved for the oligomers. Dilution has very little effect on the relative growth ofm/z 68, implying that the reactions are irreversible with respect to the lifetime of chamber aerosol. The high-resolution spectra obtained with the AMS in “W-mode” show unequivocally that these fragments originate from compounds containing carbon and nitrogen, as discussed below. Filter sample analysis also showed the presence of several nitrogen containing species in positive mode, including a species withm/z 97.
2.4.2 Glyoxal Uptake in the Presence of Light
The AMS spectra in irradiated experiments initially resembled those of dark uptake experiments, with many of the same marker fragments prominent, but then changed quickly. As under nonirra- diated conditions, gaseous GL partitioned immediately to the AS seed under UV light. The organic signal increased quickly upon addition of AS aerosol, but began to decrease soon after irradiation began. Upon reaching a maximum, the GL marker signal decayed faster than wall loss and the max- imum is reached earlier than in the experiments under dark conditions. No dilution was performed in the irradiated experiments. The fractional contribution of m/z 44 and m/z 68 increased upon irradiation (Fig. 2.7). The irradiation resulted in a temperature increase of ∼5◦C and a drop in
relative humidity (see Table 2.2). As a result, the liquid water content (LWC) was lowered and the total aerosol volume decreased, which made it impossible to determine the mass of GL taken up into the aerosol from the DMA data. The fragment with m/z 44 can be confidently assigned as CO2+, and in AMS spectra is considered an indicator of the oxidation state of organic aerosol. Its increase in irradiated experiments points to the fact that the amount of oxidized organic species is increas- ing in these experiments. In agreement with this, numerous highly oxidized organic species were detected via the UPLC/ESI-HR-TOFMS analysis, including glyoxylic, glycolic, and formic acids.
Filter sample analysis also showed the presence of a sulphur containing compound withm/z155. No OH source was added in these experiments but a small amount of OH is potentially being produced via photolysis of GL, resulting in formation of the carboxylic acids. In one experiment, Fe was added to the seed (Exp. 9). The results closely resembled those of the other irradiated experiments (Exp. 8 and 10). Although carboxylic acids are formed, the O:C ratio of the organic fraction of the aerosol is not increasing but rather decreasing. In contrast the H:C and N:C ratios both increase in these experiments. The ammonium fraction of the aerosol is excluded in the calculation of N:C ratio.
2.5 Discussion
2.5.1 Organosulfate Formation
The fragment ions m/z 145 and 175, which were previously assigned the formulas CH5O6S+ and C2H7O7S+, respectively by Liggio et al. (2005a), were unequivocally determined to be C5H5O5+
and C6H7O6+, respectively (Fig. 2.4a and b) with the AMS in “W-mode.” The detection of these fragments demonstrates the existence of trimers or larger GLn in the aerosol. Liggio et al. (2005a) suggested that these fragments correspond to fragmentation products of GL sulfates formed from a proposed aqueous reaction of sulfate or bisulfate with GL. If this proposed mechanism were correct, it would be the only evidence prior to the work presented here for the formation of GL sulfates in chamber aerosol resulting from GL uptake. The current study is in the unique position to unambiguously determine the chemical formulas of both fragment ions due to the employment of
the high-resolution “W-mode,” which is not possible with a quadrupole AMS. No sulfate esters were detected by the UPLC/ESI-HR-TOFMS analysis of filter samples in nonirradiated conditions with neutral or acidic seed (Fig. 2.5b and 2.5c). This evidence suggests that GL sulfate does not form in dark GL uptake experiments with AS seed.
Our results do not rule out that sulfates were formed in the study by Liggio et al. (2005b), and our irradiated experiments clearly demonstrate that organosulfates can form. Figure 2.5a shows that m/z 155, which corresponds to glycolic acid sulfate (C2H3SO6−, see below), is measured in filter samples obtained during irradiated experiments (Exp. 8 and 10). The AMS did not detect this sulfate, most likely due to a high degree of fragmentation. The same organosulfate (as judged by elution time and formula) C2H3SO6− has previously been detected in filter samples from iso- prene photooxidation experiments conducted in the Caltech chamber (Surratt et al., 2008) under intermediate- and high-NOx conditions, which favour GL production, but only with acidic seed.
Ambient organic aerosol collected from K-puszta, Hungary (G´omez-Gonz´alez et al., 2008) and from the southeastern US (Surratt et al., 2008) has also been found to contain this C2H3SO6− organosul- fate. In the previous work this sulfate was proposed to be GL sulfate. In all of these studies the filter extraction was performed in methanol. As sulfate is a better leaving group than methoxy, it appeared likely that the initially proposed GL sulfate would not be observed with the methanol ex- traction method, as it should dissociate. Thus, isomers of C2H3SO6−were investigated, and glycolic acid sulfate was chosen as a likely candidate since this sulfate should be more stable in methanol, and as a different glycolic acid ester was proposed as one of the products of the light induced ex- periments in the work presented here, which suggests that a pathway for glycolic acid production exists. We subsequently synthesized the glycolic acid sulfate and verified that the mass and elution time of the standard and the C2H3SO6−
sulfate observed in this and previous studies were identical using UPLC/ESI-HR-TOFMS (Fig. 2.5d). This analysis shows that previous assignments of glyoxal sulfate that were obtained via filter extraction involving methanol or related solvents, such as in the chamber and ambient aerosol studies mentioned above, should be revisited as carbonyl sulfates are not stable under these conditions. However, this does not rule out the existence of carbonyl sulfates
under the conditions present in aerosol.
This is the first report of glycolic acid sulfate measured in chamber filter samples of GL uptake, and one of the few organosulfates to be positively identified in ambient aerosol. Acid catalysis has been traditionally been implicated in the formation of organosulfates. However, this study shows no sulfate formation under acidic conditions in the absence of light (Exp. 5 and 6) and recent studies have questioned this pathway for lower tropospheric conditions and instead proposed an epoxide pathway (Minerath et al., 2008; Minerath and Elrod, 2009). In contrast, the glycolic acid sulfate formation observed in this work requires a light induced pathway as it is only observed in the presence of light (Exp. 8 and 10), even in neutral seed aerosol. Although the identification of C2H3SO6− as glycolic acid sulfate reconciles the expected chemical stability to methanol extraction, it is unclear how glycolic acid or its sulfate are formed, although the increasingm/z 44 marker shows that there is active oxidative chemistry occurring in the presence of UV light. However, glycolic acid is not an oxidation product of GL but rather a disproportionation product. We are currently investigating the pathway for glycolic acid sulfate formation, which is unlikely to involve an epoxide.
2.5.2 Carbon-Nitrogen Containing Compound Formation
Although no significant AMS fragments containing both sulphur and carbon are found, several frag- ments in the high-resolution spectra are found to contain nitrogen together with carbon, hydrogen and occasionally oxygen (Table 2.4). In addition, filter samples analyzed with UPLC/ESI-HR-TOFMS in positive mode showed compounds containing carbon and nitrogen (C-N compounds), listed in Ta- ble 2.4. The identification of the species corresponding to the chemical formulae listed in Table 2.4 is ongoing, but we have achieved a positive identification of three masses in the AMS spectra; the strong signals at m/z 41 (C2H3N) and 68 (C3H4N2, Fig. 2.8a), and a weaker signal at m/z 96 (C4H4N2O, Fig. 2.8b). The carrier ofm/z 97 from the filter samples also had the formula C4H4N2O (after the subtraction of a proton) in high-resolution positive mode ESI and had the same elu- tion time as a standard of 1H-imidazole-2-carboxaldehyde (Sigma-Aldrich). The AMS fragments are also consistent with 1H-imidazole-2-carboxaldehyde. The high-resolution masses observed with
UPLC/ESI-HR-TOFMS and the AMS, the AMS fragmentation pattern and the observed elution time provide strong support for the assignment of the carrier of this signal to 1H-imidazole-2- carboxaldehyde. In further support of this finding, the general Debus mechanism for imidazole formation (see following paragraph) predicts the formation of 1H-imidazole-2-carboxaldehyde as shown in Fig. 2.9. Other C-N containing products were observed, but have not been positively identified. The production of a very stable aromatic compound such as an imidazole may be the thermodynamic driving force behind this reaction and explains why carbon-nitrogen containing frag- ments are observed in the AMS. This is in contrast to the case of organic nitrates, which fragment easily via loss of the nitrogen moiety.
Since no NOx was present or added to the chamber before GL addition, the only source of labile nitrogen is ammonium from AS. Therefore, the C-N ions likely arise from fragmentation of products of a reaction between GL and ammonium. Although the ammonium ion is not a nucleophile and is not expected to react with GL, there will be a non-negligible concentration of ammonia in equilibrium with ammonium at the pH found in AS aerosol. The reaction of GL and ammonia is an established organic reaction for synthesis of imidazole and was described in 1858 (Debus, 1858).
In view of recent literature describing the observation of light absorbing complexes and higher molecular weight compounds from reaction of bulk solutions containing AS and GL (Nozi`ere et al., 2009; Shapiro et al., 2009), it is interesting to note the observations by Debus (1858). Debus (1858) describes formation of a brown solution as well as two colorless products; imidazole (C3H4N2) and C6H6N4, most likely 2,2’-bi-1H-imidazole, which is available commercially as a colored compound.
Thus the reaction of GL with ammonia has a long history. In addition to reaction with ammonia, the reaction of GL with AS in bulk solution is well-established. In fact, a method for reaction of GL with formaldehyde and AS in bulk aqueous solution with 69% yield has been published and patented (Schulze, 1973). The author states the yield of imidazole is surprisingly high, which could be a result of catalytic activity by ammonium (proposed recently by Nozi`ere et al. (2009)) in addition to being a reactant, although this is complicated by the pronounced effect of anions on GL (Ip et al., 2009). A similar method for the production of 2,2’-bi-1H-imidazole in bulk aqueous solution via
reaction of GL in AS with 43–54% yield has also been published and patented (Cho et al., 2003).
Thus, reaction of GL with AS in bulk solutions to form coloured compounds has a well-established history. Other studies have addressed the effect of added gas-phase ammonia (Na et al., 2006, 2007), organic amines (Angelino et al., 2001; Murphy et al., 2007; Silva et al., 2008), and amino acids (De Haan et al., 2009) on SOA formation as well as bulk phase reactions between AS and GL (Nozi`ere et al., 2009; Shapiro et al., 2009) and amino acids and GL (De Haan et al., 2009), but to the authors’ knowledge, imidazole compounds have not been previously detected in AS seed aerosol chamber studies. The mass spectrum published by Liggio et al. (2005a) does not show a peak at m/z 68. However, subsequent to the initial publication of our work, De Haan et al. (2009) identified substituted imidazole compounds formed from the reaction of GL and amino acids in both the bulk phase and in solid phase aerosols. We report the first observation of the formation of C-N containing compounds from reaction of a carbonyl in AS seed aerosol, but this finding is not surprising given the recent findings by De Haan et al. (2009) and the well established chemistry reported for bulk solutions.
Little experimental data are available on the physical properties of 1H-imidazole-2-carboxaldehyde, though it is predicted to have a vapor pressure of 1.43×10⁻³torr (SciFinder Scholar, 2008). Un- der mildly acidic conditions, this molecule would be protonated, lowering the vapor pressure and making it a viable candidate for an SOA constituent. The pKB of imidazole is 7, so 50% will be protonated in neutral solutions. Thus at the pH of AS (∼5) most of the imidazole will be proto- nated and the low volatility is evidenced by the fact that the carrier of them/z 68 signal does not repartition to the gas phase in the dilution or irradiated experiments. The imidazole and other C-N compounds only contribute a small amount to the total organic mass. It is possible that reaction of otherα-dicarbonyls and aldehydes could increase this contribution. However, as mentioned above, some of the reaction products of GL and AS are strongly light absorbing (Shapiro et al., 2009) and even amounts that do not add significantly to SOA mass could affect aerosol optical properties. As the imidazole is formed irreversibly, it could be used as a tracer for atmospheric carbonyl–nitrogen reactivity with implications for changing aerosol optical properties.
2.5.3 Overall Organic Growth and Glyoxal Oligomer Formation
Analysis of the AMS spectra collected indicates strong evidence for GLn within the aerosol (see Fig. 2.3). It is important to note that fragments with one or two carbons do not necessarily arise only from GL monomers in the particle phase. They can also be fragmentation products of larger oligomers; thus C1 and C2 fragments are a result of fragmentation of at least a monomer, C3 and C4 fragments are the result of fragmentation from at least a dimer, and so on. The GL and GLnmass fragments stop growing in parallel with overall organic growth and show analogous behaviour to total organic growth upon dilution. Organic growth in our study reached a plateau, providing evidence for a steady-state point, which could either be due to a depletion of a reactant in an intrinsically irreversible process or because equilibrium, with a corresponding modified effective Henry’s law constant, is achieved. The dilution experiments, in which the chamber air mass was diluted with GL-free air, provide key evidence that this plateau is not caused by the depletion of a reactant.
The dilution process itself reduces the gas-phase GL concentration and aerosol number density and thus total aerosol volume but does not change the composition of the aerosol phase. However, if the aerosol-phase composition was achieved via equilibrium with the gas-phase GL, reduction of the gas-phase GL concentration via dilution disturbs this equilibrium. As a result the aerosol-phase organic content immediately after dilution is higher than the equilibrium value for the reduced gas- phase concentration would predict. The system will respond by repartitioning GL to the gas phase.
In our dilution experiments, which reduce the gas-phase GL concentration by 25%–40% (Fig. 2.6), the organic:sulfate ratio decreases by 15%–25%, which shows that organic aerosol content decreases relative to sulfate, implying a loss of GL from the aerosol phase. This shows that GL uptake onto AS aerosol is reversible; GL will partition from the aerosol to gas phase in the event of lowered gas phase concentrations in the case of reversible uptake. The fact that the aerosol phase organic content decreased a little less than the gas-phase GL concentration is expected from the (slow) kinetics.
For the dark GL uptake experiments, only C-N compounds, GL and GLn were identified, while no organosulfate was found. C-N compounds are clearly formed irreversibly, since no loss from the aerosol was seen upon dilution. The fact that they only contribute a small part of the organic
AMS signal and that overall organic growth as well as GL and GLn growth are reversible, suggests strongly that overall growth is dominated by GL and GLn. The studies by Liggio et al. (2005a,b) were conducted on timescales (∼4 h) in which equilibrium was not yet achieved in our studies. We have therefore compared our organic growth during the first 4 h with that of Liggio et al. (2005a,b) for experiments at similar relative humidities of 49% (Liggio et al., 2005a,b) and 55% (this study) and gas-phase GL concentrations of 5.1 ppbv(Liggio et al., 2005a,b) and∼70 ppbv (this study). The organic/sulfate ratio after 4 h in the work by Liggio et al. (2005a) is∼16, which is more than an order of magnitude larger than in this study (∼0.35), and we expect that the difference would have been even larger if we had employed the lower GL mixing ratios of the work by Liggio et al. (2005a,b).
Although the first two hours of our data can be interpreted with a linear slope, the curvature of 2-4 hrs in the study presented here shows a decreasing uptake rate in agreement with the fact that equilibrium is achieved after about 10 h. It is hard to interpret a clear curvature in the work by Liggio et al. (2005a). The average aerodynamic diameter of the seed aerosol in the study by Liggio et al. (2005a) is initially smaller, and thus the uptake rate per volume of seed aerosol is expected to be faster than in this study, but it is unlikely that this alone can explain the discrepancy. In a more recent study, Volkamer et al. (2009) showed that photochemical uptake was higher within 90 seconds than over several hours in our study and the study of Kroll et al. (2005). The presence of OH in the study by Volkamer et al. (2009) represents a significant difference, which could explain the large difference in uptake rate. However, we also currently cannot determine a particular reason why the non-irradiated studies potentially show two different types of uptake (irreversible and reversible) at different rates, information that is critical if understanding of these processes is to be applied to ambient studies.
Although the primary focus of this work are the condensed phase reactions of GL and the reversibility of uptake onto AS aerosol, effective Henry’s Law values for GL were also calculated.
Kroll et al. (2005) assumed a unit density of 1 g/cm3and used the seed volume to calculate aerosol GL concentrations. In this manner the authors obtained a value ofKH,mod∗ =2.6×10⁷M/atm. However, the densities of GL trimer dihydrate (in our lab) and GL aerosol derived from drying aerosolized 40%
w/w GL solutions (D. De Haan, personal communication, 2009) have since been measured. These densities were determined to be 1.67 g/cm3 and 1.71 g/cm3, respectively. Therefore, the density of GL used in this work is ρ=1.69 g/cm3, which is likely a lower limit due to partial molar volume effects in solution. Using this density, we calculate an effective Henry’s Law value of 3.4×10⁷M/atm for the data from Kroll et al. (2005) and a value between 4.2×10⁷M/atm and 7.0×10⁷M/atm from this study. The study by Volkamer et al. (2009) used a density ofρ=2 g/cm3 and used the fraction of seed volume corresponding to LWC to calculate a modified GL concentration. In this manner they obtained a value of KH,mod∗∗ =1.65×10⁸M/atm. Using this method and density, we calculate a value between 1.51×10⁸M/atm and 2.52×10⁸M/atm for our study, reflecting the experimental uncertainty. However, it should be noted that the two studies were conducted under different conditions, as the study Volkamer et al. (2009) had an OH source present, and thus the corresponding Henry’s Law constants cannot be directly compared. More work is needed to determine the effect of GL concentration, AS and LWC on the effective Henry’s Law constant of GL.
2.5.4 Glyoxal Uptake under Irradiated Conditions
We present the first analysis of organic reaction products formed during irradiated GL uptake with AS seed aerosol. Within the framework of Fig. 2.1, the light induced reactions that are occurring should add additional product channels in the condensed phase, so a higher uptake would be expected under irradiated conditions. No OH source was added in our study and thus conditions are not identical to those employed by Volkamer et al. (2009). However, there is a marked difference in the fate of GL in the particle phase for the irradiated conditions compared to dark conditions in our study, even without an added OH source: an organosulfate and organic acids are formed. As discussed earlier, the organosulfate formation is a result of a light induced mechanism, as can be seen in the lack of organosulfate formed even in highly acidic aerosol under non-irradiated conditions.
The relative signal strength of m/z 44, an indicator of oxidized organic aerosol in the AMS spectra, shows that a substantial amount of oxidized organics are formed over the duration of the irradiated experiments. This is supported by the organic acids found in filter sample analysis:
formic, glyoxylic and glycolic acids, the latter a disproportionation product of GL, all of which have smaller Henry’s law constants than GL. The formic acid and glycolic acid are observed as an ester, a higher molecular weight condensation product. Although no OH source was added, the observation of glyoxal oxidation products strongly indicates that the irradiation resulted in radical chemistry. Whether this chemistry occurred via OH or some other radical mechanism cannot be ascertained. If oxidation to more volatile products, such as glyoxylic acid, is not significantly faster than cond