SUMMARY
P
olicymakers in economies hit hard by the global inancial crisis have been concerned about weak growth in credit, considered a main factor in the slow economic recovery. Many countries with near-zero or nega- tive credit growth for a number of years sense that the strategy of very accommodative macroeconomic policies has been insuicient in reviving credit activity. Authorities have therefore implemented a host of policies to target credit creation (which are documented in an appendix to the chapter).1Efectively targeting these policies requires identifying the factors that underlie the weakness in credit. In credit markets, these factors center around the buildup of excessive debt in households and irms, reducing their credit demand, as well as excessive leverage (or a shortage of capital) in banks, restricting their ability or willingness to provide additional loans. he government could also usefully alleviate a shortage of collateral (perhaps resulting from large declines in asset values), which could constrain credit activity.
To address such a technically challenging exercise, this chapter takes a stepwise approach. he irst step is an attempt to identify the constraints to credit through the use of lending surveys—trying to disentangle whether banks are unwilling to lend (on the supply side) or whether irms or households are reluctant to borrow (on the demand side). his distinction helps narrow down the set of policies to consider, which difer depending on the side of the market that faces the major constraint. A more challenging second step—which is hampered by the lack of suicient data for many countries—is to identify the individual factors that are constraining credit, speciically what makes banks unwilling to lend or households and irms reluctant to borrow.
Using this approach for several countries that have suicient data, the analysis inds that the constraints in credit markets difer by country and evolve over time. his reinforces the importance of a careful country-by-country assessment and the need for better data on new lending. In many cases, demand- and supply-oriented policies will be complementary, but their relative magnitude and sequencing will be important. For example, relieving excessive debt in irms will help only if the banking sector is adequately capitalized. Policymakers should also recognize the limits of credit policies and not attempt to do too much. Because many policies will take time to have an impact, assessment of their efectiveness and the need for additional measures should not be rushed.
When credit policies work well to support credit growth and an economic recovery, inancial stability is enhanced, but policymakers should also be cognizant of longer-term potential risks to inancial stability. he main risks center on increased credit risk, including a relaxation of underwriting standards and the risk of “evergreen- ing” existing loans. Mitigation of these risks may not be necessary or appropriate while the economic recovery is still weak, as it could run counter to the objectives of the credit policies (which are often designed to increase risk taking); still, policymakers will need to continually weigh the near-term beneits against the longer-run costs of policies aimed to boost credit.
1Appendix 2.1 is available online on the GFSR page at both www.imf.org and http://elibrary.imf.org.
2
CHAPTER ASSESSING POLICIES TO REVIVE CREDIT MARKETS
Introduction
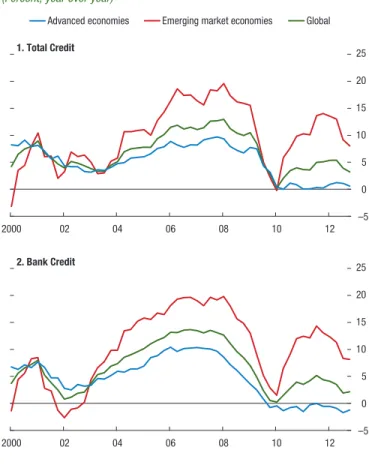
his chapter examines possible reasons behind the weakness in private credit in many countries since 2008, and it ofers a framework for assessing the various policies that have been implemented to revive credit markets. hese policies were put in place in the wake of a sharp decline in lending growth in most advanced economies and some emerging markets (Figure 2.1). Total credit to the private sector showed sluggish growth, while credit extended by domestic banks declined for advanced economies.
Policymakers want to support credit markets because the decline in lending is seen to be a primary factor in the slow recovery. Well-functioning credit markets make major contributions to growth and macroeco- nomic stability, and restarting credit plays an impor- tant role in economic recovery after a downturn.
Recent studies show that creditless recoveries are typi- cally slower than those with more robust credit growth, at least for the irst few years, especially after recessions that feature large declines in asset prices, a characteris- tic of this inancial crisis.2
Credit-supporting policies are most efective if they target the constraints that underlie the weakness in credit. Policymakers are sensing that the exception- ally accommodative macroeconomic policies imple- mented since the crisis have been insuicient and that additional measures targeting credit creation could further underpin the recovery. To target such policies efectively, policymakers must determine the factors that constrain lending activity. his chapter provides a framework for this purpose.3
In the past, a clear case for government intervention emerged only when there were market failures or exter- nalities, but this crisis showed that such developments in credit markets can be prevalent, amplifying upturns and downturns. his is leading to some rethinking that the role of government policies, particularly macropru- dential policies, may be larger than previously con-
he authors of this chapter are S. Erik Oppers (team leader), Nicolas Arregui, Johannes Ehrentraud, Frederic Lambert, and Kenichi Ueda. Research support was provided by Yoon Sook Kim.
Fabian Valencia shared data and methodology.
2he importance of credit in supporting economic recovery has been discussed at length in the literature. See Table 2.7 for a sum- mary of these studies, under the heading “Creditless Recovery.”
3Focusing on these potential constraints to credit (rather than simply its weakness) could also prevent policymakers from doing too much. In some cases, it may be that an expansion of credit is not desirable; deleveraging by irms or households may in fact be impor- tant to pave the way for more sustainable economic growth.
sidered. In addition to exacerbating the current crisis, these amplifying tendencies appear also to be present in upswings, as the current crisis was in part precipitated by excessive credit creation during the preceding boom.
herefore, policymakers need also to mitigate exces- sive credit creation during economic upswings, which would lower the risk of similar future crises, and thus in turn obviate the need for credit-supporting policies.
Although well-designed credit policies can support credit intermediation and a more robust economic recovery, the choice of policies should also take into account direct or indirect iscal costs and unintended consequences for inancial stability. Although many policies have been implemented in a range of coun- tries, which helped to keep inancial instability from worsening and the supply of credit from slipping
–5 0 5 10 15 20 25 Advanced economies Emerging market economies Global
Sources: Bank for International Settlements (BIS); and IMF staff estimates.
Note: Unweighted average of real credit growth rates across countries. Total credit includes private sector borrowing (loans and debt instruments) from domestic banks and all other sources (“other credit”), such as other domestic nonbanks and foreign lenders (see BIS, 2013).
Advanced economies include Australia, Austria, Belgium, Canada (not included in panel 2), Czech Republic, Denmark, Finland, France, Germany, Greece, Ireland, Italy, Japan, Korea, Luxembourg (from 2004:Q1), Netherlands, Norway, Portugal, Singapore, Spain, Sweden, Switzerland, United Kingdom, and United States; emerging market economies include Argentina, Brazil, China, Hungary, Indonesia, India, Malaysia, Mexico, Poland, Russia, South Africa, Thailand, and Turkey. Global consists of advanced and emerging market economies identified above.
Figure 2.1. Real Credit Growth
(Percent; year over year)
2000 02 04 06 08 10 12
1. Total Credit
–5 0 5 10 15 20 25
2000 02 04 06 08 10 12
2. Bank Credit
even further, there is not always a clearly favorable cost-beneit nexus. In particular, policymakers should be mindful of possible consequences for inancial stability in the medium term, especially if new credit is extended without adequate attention to the risks involved (including if credit is extended by nonbanks).
In addition, these policies may have iscal costs, and policymakers should make sure that initiatives are as cost-efective as possible.
In connection with recent eforts to revive credit mar- kets, the chapter addresses the following questions:
• Which countries have seen weak credit growth recently, and what are the potential causes?
• What policies have been put in place in various countries to support credit?
• Have the policies targeted the constraints that underlie the weakness in credit?
• What, if anything, can policymakers do to make credit policies more effective?
he analysis conirms that constraints in credit markets difer by country, and policies to support credit should be based on a country-speciic analysis of the constraints that government policy may alleviate. As expected, higher bank funding costs and lower bank capital have reduced the ability of banks to supply loans, and high debt levels in irms and households (along with lower GDP growth forecasts) have lowered credit demand (and afected credit supply). hese factors are present to diferent degrees in diferent countries. Policymakers should be mindful of interactions with other policies, including regulatory mea- sures, direct and contingent costs to the government, and potential longer-term inancial stability implications. If appropriate, prudential measures to mitigate such stability risks should be put in place.
Recent Developments in Credit Markets
Where has Credit Growth Been Weak?
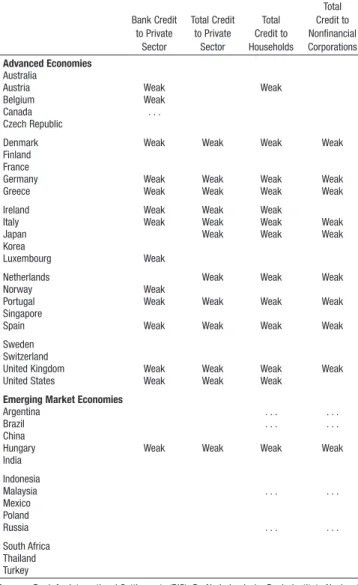
To ind where credit growth has been weak, a simple rule can be applied. A transparent operational rule used in the literature deines weak credit growth as negative average real credit growth over a certain period.4 To identify where credit is currently still weak several years into the crisis, this rule is applied to a number of countries, using data from the Bank for International Settlements (BIS) and other sources. A
4For instance, Abiad, Dell’Ariccia, and Li (2011) and Sugawara and Zalduendo (2013) use negative average credit growth over recov- ery periods to identify creditless recoveries.
separate determination is made for particular segments of credit markets when disaggregated data are available.
Many advanced economies have experienced weak bank credit growth (Table 2.1), including the United Kingdom and the United States, as have many euro area countries (including Austria, Belgium, Germany, Greece, Ireland, Italy, Portugal, and Spain).5 Interestingly,
5he selection of countries is mostly unchanged if only the last year of credit is considered. he Netherlands would join the group of countries with weak bank credit growth, and the United States and Luxembourg would drop from the list. Austria, Belgium,
Table 2.1. Identifying Countries with Weak Credit Growth, BIS Data
Bank Credit to Private
Sector
Total Credit to Private
Sector
Total Credit to Households
Total Credit to Nonfinancial Corporations Advanced Economies
Australia
Austria Weak Weak
Belgium Weak
Canada . . .
Czech Republic
Denmark Weak Weak Weak Weak
Finland France
Germany Weak Weak Weak Weak
Greece Weak Weak Weak Weak
Ireland Weak Weak Weak
Italy Weak Weak Weak Weak
Japan Weak Weak Weak
Korea
Luxembourg Weak
Netherlands Weak Weak Weak
Norway Weak
Portugal Weak Weak Weak Weak
Singapore
Spain Weak Weak Weak Weak
Sweden Switzerland
United Kingdom Weak Weak Weak Weak
United States Weak Weak Weak
Emerging Market Economies
Argentina . . . . . .
Brazil . . . . . .
China
Hungary Weak Weak Weak Weak
India Indonesia
Malaysia . . . . . .
Mexico Poland
Russia . . . . . .
South Africa Thailand Turkey
Sources: Bank for International Settlements (BIS); De Nederlandsche Bank; Instituto Nacional de Estadistica y Censos (INDEC); IMF, World Economic Outlook; Banca d’Italia; and IMF staff estimates.
Note: Weak credit is identified if the average year-over-year credit growth (deflated by con- sumer price index inflation; official wage index inflation for Argentina) is negative over a two- year window (2011:Q1–2012:Q4). Growth rates are computed using stocks in local currency and not adjusted for exchange rate variations. Cells are blank if this criterion is not met. Cells with “. . .” indicate that the data are not available, except for bank credit in Canada, which is ignored because of a break in the series. Total credit includes private sector borrowing (loans and debt instruments) from domestic banks and from all other sources (“other credit”), such as domestic nonbanks and foreign lenders (see BIS, 2013).
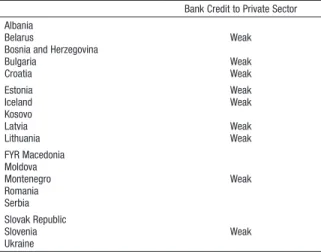
Ireland and the United States show weak credit growth (from all sources) to households but not to noninancial corporations.6,7 In addition, data from non-BIS sources indicate that many countries in central, eastern, and southeastern Europe, including Bulgaria, Croatia, Slove- nia, and the Baltic countries, have also recently seen weak bank credit growth (Table 2.2).
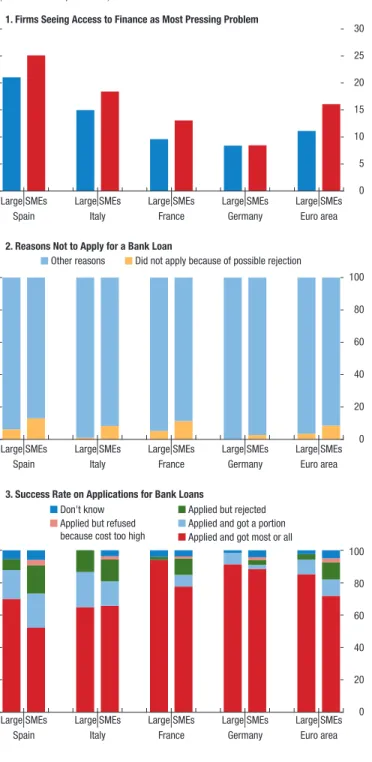
Survey data indicate particular challenges faced by small and medium enterprises (SMEs) as they attempt to access credit. he most recent European Central Bank (ECB) Survey on the Access to Finance of SMEs in the euro area (SAFE) (ECB, 2013) shows that SMEs tend to report access to inance as their most pressing problem more often than do large companies (Figure 2.2). Also, their loan applications were less success- ful than those of large corporations. In addition, the survey showed that SMEs were discouraged more often than larger irms from applying for a loan because of the anticipation of rejection. A reluctance to apply may also be a result of the higher lending rates they
Luxembourg, and Norway had mildly negative bank credit growth and actually had positive average real credit growth if other sources of credit (in addition to banks) are included.
6Ireland showed negative real growth of credit to noninancial corporations in the last quarter of 2012.
7Alternative deinitions of weak credit growth could be based on either real credit or a ratio of credit to GDP signiicantly below trend. Most of the countries selected with this chapter’s basic rule are also selected by at least one of these additional criteria. hese deinitions are the converse of methodologies in the literature that identify credit booms, including Borio and Lowe (2002); Mendoza and Terrones (2008); Borio and Drehmann (2009); and Drehmann, Borio, and Tsatsaronis (2011).
Table 2.2. Identifying Countries with Weak Credit Growth, Other Data Sources
Bank Credit to Private Sector Albania
Belarus Weak
Bosnia and Herzegovina
Bulgaria Weak
Croatia Weak
Estonia Weak
Iceland Weak
Kosovo
Latvia Weak
Lithuania Weak
FYR Macedonia Moldova
Montenegro Weak
Romania Serbia Slovak Republic
Slovenia Weak
Ukraine
Sources: European Central Bank; IMF, International Financial Statistics and World Economic Outlook; Haver Analytics; and IMF staff estimates.
Note: Weak credit is identified if the average year-over-year credit growth (deflated by consumer price index inflation) is negative over a two-year window (2011:Q1–2012:Q4). Growth rates are computed using stocks in local currency and not adjusted for exchange rate variations. Column is blank if this criterion is not met.
1. Firms Seeing Access to Finance as Most Pressing Problem
0 5 10 15 20 25 30
Large
Spain Italy France Euro area
2. Reasons Not to Apply for a Bank Loan
0 20 40 60 80 100 Other reasons Did not apply because of possible rejection
3. Success Rate on Applications for Bank Loans
0 20 40 60 80 100 Don't know
Applied but refused because cost too high
Applied but rejected Applied and got a portion Applied and got most or all
SMEs LargeSMEs LargeSMEs LargeSMEs
Germany LargeSMEs
Large
Spain Italy France Euro area
SMEs LargeSMEs LargeSMEs LargeSMEs
Germany LargeSMEs
Large
Spain Italy France Euro area
SMEs LargeSMEs LargeSMEs LargeSMEs
Germany LargeSMEs
Source: European Central Bank (2013).
Note: SMEs = small and medium enterprises. The distinction between large corporations and SMEs is available only for the countries shown.
Figure 2.2. Perceived Obstacles in Access to Finance
(Percent of respondents)
face relative to other corporations (see Chapter 1 and Figure 2.3).
What Factors May Be Constraining Credit?
heoretically, credit markets sufer from potential dii- culties that may be ampliied in recessions (Annex 2.1).
Some major factors that may constrain credit include the following:
• Collateral constraints: To secure a loan, a borrower must often post collateral (an asset), because there is an information asymmetry: the lender does not know the borrower’s repayment behavior. A drop in the value of collateral as a result of asset price declines (in real estate or stock markets, for example) shrinks the loan that can be obtained with that collateral, tight- ening credit demand as well as supply—indeed, the amount of collateral required by banks may also rise if bankers forecast further declines in its value. Lower collateral prices also lower the amounts banks will lend to each other in interbank markets, restricting bank funding and again tightening credit supply.
• Debt overhang: Excessively indebted firms may not pursue otherwise profitable business opportunities and may strive to bring down their leverage, lowering credit demand. Similarly, highly indebted households
may choose not to take out loans, but rather focus on paying off their loans. Banks may also find highly indebted borrowers less creditworthy. Debt overhang in banks can also affect credit supply: highly leveraged banks may have difficulty obtaining funding and thus lack the liquidity to make additional loans.
In most credit cycles, government intervention to mitigate the factors constraining credit is generally not necessary and may ultimately spur too much credit activity, but when various ampliication mechanisms are at play, such as in the current cycle, government intervention has a clearer role. In the past, the diicul- ties mentioned previously could be overcome by the private sector, but they may persist in times of crisis, amplifying the downturn. For example, in the current crisis, declining asset prices restricted credit, worsening the recession, which led to further downward pressure on asset prices. In such situations, the government can implement various policies (detailed below) to ease credit constraints and break the downward spiral.
his chapter investigates the role of these factors in detail, but on the face of it, evidence is growing that they have contributed to the weakness in credit in recent years. Indebtedness of households and irms rose mark- edly in the run-up to the crisis, potentially contribut- ing to a problem of debt overhang for borrowers in some countries (Figure 2.4). Also, the major asset price declines seen globally in 2008 and 2009 depressed the value of large classes of collateral (Figures 2.5 and 2.6).
A later section investigates the extent to which these developments played a role in recent years (and perhaps still do) in restricting credit demand and supply.
What Policies have Been Implemented to Support Credit?
Policymakers have sought to boost economic activity by implementing policies to support credit growth.
Appendix 2.1 provides an inventory of the policies adopted in the major economies that have experienced weakness in private credit growth.8 he goal of these
8his appendix is only available online at www.imf.org/External/
Pubs/FT/GFSR/2013/02/index.htm. his inventory includes the group of countries covered in Tables 2.1 and 2.2, most European countries (except, notably, the inancial centers Luxembourg and Switzerland), along with Japan, the United States, and some G20 countries that showed a marked deceleration of credit growth even though the simple rule in this analysis did not identify them as hav- ing weak credit (Australia, India, Korea, and South Africa).
0 100 200 300 Spain
Euro area
Italy Germany France
Sources: European Central Bank; and IMF staff estimates.
Note: SMEs = small and medium enterprises. Spread is calculated as the difference between the lending rate for loans of less than €1 million and loans greater than €1 million.
Figure 2.3. Interest Rate Spread between Loans to SMEs and to Larger Firms
(Basis points)
2007 08 09 10 11 12 13
policies includes addressing the restrictions mentioned in the previous section (mainly by alleviating debt overhang) and easing various other constraints to free up the supply of credit.
Policies aimed at alleviating balance sheet problems include the following:
• Corporate debt restructuring: To ease the debt overhang in the corporate sector, which has depressed loan demand, many governments have taken a leading role in corpo- rate debt restructuring through state-owned banks and through asset management companies that took over the assets of distressed banks. In some countries, corporate bankruptcy rules were modified and speedier out-of- court resolution programs were introduced.
0 50 100 150 200
2000 02 04 06 08 10 12
Global Advanced economies Emerging market economies
Source: Morgan Stanley Capital International.
Note: Global comprises advanced and emerging market economies.
Figure 2.5. Stock Price Index
(2005 = 100)
0 20 40 60 80 100 120 140
2000 02 04 06 08 10 12
France Italy Spain
United Kingdom United States Japan
0 20 40 60 80 100 120 140
2000 02 04 06 08 10 12
Sources: Organization for Economic Cooperation and Development; and IMF, International Financial Statistics.
Note: Deflated by consumer price inflation.
Figure 2.6. Real House Price Index
(2005 = 100) 1.
2.
20 40 60 80 100 120 140 160 180 200 220
France Italy Spain
Nonfinancial Corporations1
0 20 40 60 80 100 120
Households2
20 40 60 80 100 120 140 160 180 200 220 United States
United Kingdom
Japan
0 20 40 60 80 100 120
Source: Haver Analytics.
Note: Seasonally adjusted GDP.
1Corporate debt includes securities other than shares (excluding financial derivatives for the United Kingdom), loans, and other accounts payable on a nonconsolidated basis. Consolidated debt levels are significantly lower for some countries, especially those in which intercompany loans represent a large share of nonfinancial corporate debt. This calls for caution when doing cross-country comparisons.
2Including nonprofit institutions serving households.
Figure 2.4. Corporate and Household Debt Outstanding
(Percent of GDP)
2000 02 04 06 08 10 12 2000 02 04 06 08 10 12
2000 02 04 06 08 10 12 2000 02 04 06 08 10 12
1.
3.
2.
4.
• Household debt restructuring: Applying strategies similar to those used in corporate debt restructur- ing, some governments have sought to ease house- hold debt overhang by implementing household debt restructuring programs, most importantly for
“underwater” mortgages (that is, the loan balance is higher than the home value). In some countries, personal bankruptcy rules were modified, and out- of-court resolution programs were implemented.
• Bank restructuring: In the recent past, many govern- ments have recapitalized banks (both directly and through incentives for private investors), imple- mented programs to purchase distressed bank assets, and provided guarantees for existing bank assets.9 Many countries increased the coverage of deposit insurance to avoid deposit drains, which threatened to force banks to shrink their loan books.
Other policies fall into several broad categories:
• Monetary policies: Central banks have expanded their monetary policy toolkits to enhance the demand and supply of credit in addition to using tradi- tional tools such as changes in the policy rate. For example, the ECB’s “fixed-rate full allotment” policy (in which banks’ bids for liquidity from the central bank are fully satisfied), as well as its long-term (three-year) refinancing operations, were aimed in part at supporting credit. Many central banks have eased collateral constraints for banks, in part by accepting a wide range of private assets. Some have adopted policies of direct credit easing through purchases of corporate bonds, mortgage bonds, and other private sector assets. A few central banks have engaged in indirect credit easing by making available special lending facilities to promote bank lending.
• Fiscal programs: Many national treasuries have sought to promote expansion of corporate and mortgage loans through direct extension of loans and through subsidies or guarantee programs for new loans. These programs have often been implemented through state-owned or state-sponsored institutions.
• Financial regulations: Prudential regulators have instituted measures designed to ease bank balance sheet restrictions that have made banks unwilling or unable to extend new loans. In some countries (particularly in the European Union), regulators have relaxed capital requirements for loans to SMEs.
9See further discussions on restructuring programs in Landier and Ueda (2009) for banks, Laeven and Laryea (2009) for households, and Laryea (2010) for irms.
Some countries have implicitly or explicitly allowed forbearance on recognition of nonperforming loans.
• Capital market measures: To promote the diversification of financing options for firms, several governments have made efforts to lower barriers to corporate bond issuance for SMEs and to promote securitization mar- kets for SME loans and household debt (Box 2.1).
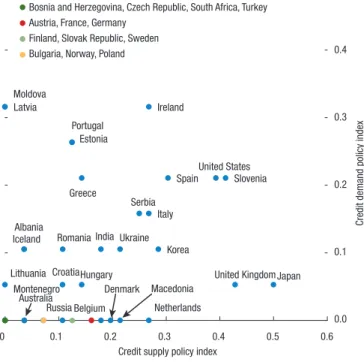
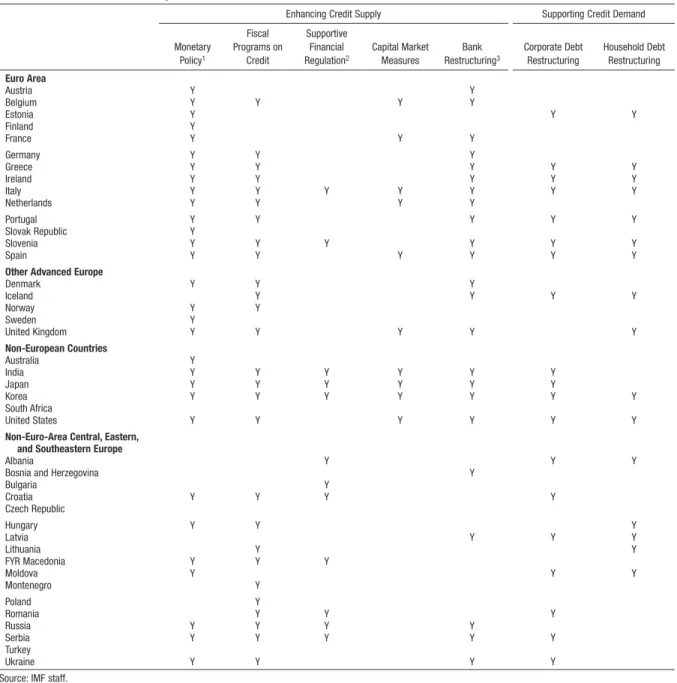
Most countries have relied on a variety of policies to support both credit demand and credit supply, recog- nizing that these are often complementary. Figure 2.7 and Table 2.3 list the various credit-supporting policies implemented in 42 countries. he policies are limited to those directly targeting credit market constraints and do not include more general iscal and monetary policies (including quantitative easing—that is, direct purchases of government bonds) that have also underpinned credit activity. In addition, the indices in Figure 2.7 refer only to the number of diferent measures currently in place;
they do not account for the size of the programs or their efectiveness. Despite this somewhat narrow scope, the data yield the following main conclusions:
0.0 0.1 0.2 0.3 0.4
0 0.1 0.2 0.3 0.4 0.5 0.6
Credit supply policy index
Credit demand policy index
Source: IMF staff estimates.
Note: The indices are computed by dividing the number of policy measures currently in place to support the supply of or demand for credit in each country by the total number of possible measures in the list of all policy measures in Appendix Table 2.1 (excluding “stress test,”
“coverage enhancement of deposit insurance,” “other policies to enhance credit supply,” and
“other policies to mitigate debt overhang”). EU-wide fiscal programs (e.g., through the European Investment Bank and the European Bank for Reconstruction and Development) are counted with half weights for the European Union member countries that do not have national fiscal programs.
Figure 2.7. Relative Number of Credit Supply and Demand Policies Currently in Place
Bosnia and Herzegovina, Czech Republic, South Africa, Turkey
Bulgaria, Norway, Poland Finland, Slovak Republic, Sweden Austria, France, Germany
Netherlands Greece
Ireland
Italy Portugal
Spain Estonia
Slovenia
Iceland
United Kingdom India
Japan Korea
United States
Albania
CroatiaHungary Latvia
Lithuania
Macedonia Denmark
Moldova
Montenegro Romania
Russia
Serbia Ukraine
Belgium Australia
his box explores options for diversifying credit creation for small and medium enterprises (SMEs), which have traditionally been constrained in their credit channels.
Options for access to credit are much more restricted for SMEs than for larger irms. Larger companies have beneited from historically low costs of funding and ample liquidity through a variety of credit channels.
Conversely, SMEs have virtually no access to bond markets and continue to face higher interest rates and restricted access to bank credit. Although the availability and conditions of external inancing appear to have improved in the last year or so—including for bank loans, bank overdrafts, and trade credit—these improve- ments have been less obvious for SMEs than for larger companies. In a recent survey by the European Central Bank, for example, “access to inance” was the second most important concern mentioned by SMEs, on aver- age, throughout the euro area, although the magnitude of the concern difered by country—38 percent of SMEs in Greece reported this as their biggest concern, 25 percent in Spain, and 24 percent in Ireland, while only 8 percent of SMEs in Germany and Austria viewed access to inance as a primary issue (ECB, 2013).
SMEs were also hit harder by the crisis. here is evidence (Iyer and others, 2013) that the magnitude of the reduction in credit supply was signiicantly higher for irms that (1) are smaller (as measured by both total assets and number of employees); (2) are younger (as measured by the age of incorporation); and (3) have weaker banking relationships (as measured by the volume of their bank credit before the crisis). Regu- lation may also play a role. Some studies (OECD, 2012; Angelkort and Stuwe, 2011) suggest that Basel III implementation could lead banks to reduce their lending to SMEs. his problem is likely to be larger in countries with bank-based inancial systems and less- developed inancial markets.
Improving the availability of credit to the corporate sector in general, and SMEs in particular, is essential to supporting the economic recovery. he following policy measures may help achieve this goal.
• Advancing the securitization agenda, including by:
o Developing primary and secondary markets for securitization of SME loans: Of the total euro area securitized bond market of €1 trillion at the end of 2012, only some €140 billion was backed by SME loans. This contrasts with the much larger
stock of bank loans to SMEs, which is estimated to be approximately €1.5 trillion.
o Addressing the asymmetric treatment of securitized assets vis-à-vis other assets with similar risk char- acteristics: Currently, securitized assets are often treated less favorably by investors and central banks. For example, the haircut imposed by the ECB on asset-backed securities is 16 percent, much more than on other assets of similar risk—
such as covered bonds with a similar rating—that are also accepted in liquidity facilities and direct purchases. Aside from the differences in the legal frameworks governing securitized assets and covered bonds, there are important inconsisten- cies in capital charges that provide incentives for covered bond issuance and bank cross-holdings of covered bonds, at the expense of securitiza- tions with the same credit rating and duration risk (Jones and others, forthcoming).
o Introducing government guarantees for SME securitizations (covering credit and sovereign risk):
Guarantees could encourage private investment in these securities by offsetting some of the infor- mational asymmetries and SME credit risk, espe- cially from investors that can only buy securities with certain minimum credit ratings. The effect on lender incentives and the fiscal cost of these guarantees should be appropriately recognized (see the main text).
o Including SME loans in the collateral pool for cov- ered bonds: Currently, only mortgage, municipal, ship, and aircraft loans are eligible collateral for covered bond issuance; extending eligibility to SME loans will improve their attractiveness.
o Improving risk evaluation for SME securities by regulating and standardizing information disclo- sure: More uniform information disclosure would reduce investors’ uncertainty about the quality of SME securities and thus would tend to reduce SMEs’ cost of bond and commercial paper issuance.
• Encouraging development of factoring of SME receiv- ables: By facilitating the sale of account receivables, SMEs can finance working capital. If this form of financing is underdeveloped, then better credit information and quality of credit bureau data will improve assessment of borrowers’ ability to pay.
• Encouraging companies to lend to each other: Larger companies could provide financing to their smaller suppliers (for example, via faster payment cycles).
Box 2.1. Policies to Diversify Credit Options for Small and Medium Enterprises in Europe
he authors of this box are David Grigorian, Peter Lindner, and Samar Maziad.
• Figure 2.7 suggests that some countries have cho- sen to target only one side of the market, usually focusing more on policies to boost credit supply.
However, countries that have not used targeted demand-side policies—including the core euro area and the Nordic countries—have still relied to a con- siderable extent on more general fiscal and monetary policies to support credit demand.
• Emerging market economies in central and eastern Europe have implemented relatively fewer policies to support credit, perhaps because some have less monetary and fiscal policy room. Some institutions (including the European Investment Bank and the European Bank for Reconstruction and Develop- ment) are providing support for credit supply poli- cies in several of these countries.
Are Current Policies on Target?
Given limited policy resources, policymakers should target the constraints on the demand or the supply of credit that can be efectively addressed by govern- ment intervention. To facilitate the usefulness, timing, and sequencing of the various policies, it is helpful to identify the factors that underlie credit demand and credit supply. Depending on how these factors inlu- ence lending activity, one or more could be the target of government policies.
his chapter takes a stepwise approach to identify- ing underlying constraints afecting credit markets. As a irst step to target policies, it proposes to distinguish between demand and supply constraints, which can be useful to narrow the policy options that may be efec- tive. Moreover, if the sensitivity of supply or demand to interest rates can be determined, policymakers may be able to discern which policies are likely to be most efec- tive in increasing credit volume. In a more challenging second step, the chapter attempts to identify the speciic factors that may constrain credit demand or supply. In countries for which suicient data are available for this second step, results from such an analysis could further narrow the set of credit-supporting policies that are likely to be most efective. Last, the chapter uses other information gleaned from country-speciic sources to add to the overall assessment.
he analytical results should be interpreted with caution. he factors that determine credit supply and demand are technically diicult to identify. he analy- sis is further complicated by a lack of appropriate data, even in the advanced economies considered here. Still, this exercise provides a useful framework for assess- ing the appropriate targeting of policies and ofers a tentative and preliminary assessment of their efective- ness for countries where suicient data were available.
Further reinement of this framework would be useful, and would greatly be facilitated by the availability of
• Paving the way (including through appropriate regula- tion) for market-based credit guarantee programs and the development of small-bond markets: Government- backed partial credit guarantee and mutual guarantee programs (similar to microfinance) could support expanded credit to SMEs (Honohan, 2010; Columba, Gambacorta, and Mistrulli, 2010). Italy’s introduction of fiscal incentives for the issuance of minibonds by unlisted firms in 2012 provides an example.
• Tax incentives for banks that expand credit to SMEs:
These incentives could take the form of lower tax rates on earnings from SME lending. However, any tax subsidies should be carefully designed so as not to encourage excessive risk taking by banks or weaken loan underwriting standards, or create opportunities for tax avoidance, which will be very hard to reverse later. Also in this case, the effect on lender incen- tives and the fiscal cost of these guarantees should be appropriately and transparently recognized.
• Facilitating establishment of “direct lending” funds targeting SMEs that have difficulty getting other types of financing: These funds could include direct financing by distressed-debt firms, private equity firms, venture capital firms, hedge funds, and busi- ness development corporations.
he relative efectiveness of these policies in providing credit to SMEs and their attendant costs would need to be evaluated on a country-by-country basis. he authorities should ensure that these measures are suiciently targeted to address the root causes of lack of credit to SMEs. hey must also minimize moral hazard and inancial stability risk by ensuring adequate risk management practices are in place and requiring banks to hold a portion of securitized SME-backed assets on their balance sheets to be sure they have a suicient inancial interest in monitoring the loans.
Box 2.1 (continued)
Table 2.3. Credit Policies Implemented since 2007
Enhancing Credit Supply Supporting Credit Demand
Monetary Policy1
Fiscal Programs on
Credit
Supportive Financial Regulation2
Capital Market Measures
Bank Restructuring3
Corporate Debt Restructuring
Household Debt Restructuring Euro Area
Austria Y Y
Belgium Y Y Y Y
Estonia Y Y Y
Finland Y
France Y Y Y
Germany Y Y Y
Greece Y Y Y Y Y
Ireland Y Y Y Y Y
Italy Y Y Y Y Y Y Y
Netherlands Y Y Y Y
Portugal Y Y Y Y Y
Slovak Republic Y
Slovenia Y Y Y Y Y Y
Spain Y Y Y Y Y Y
Other Advanced Europe
Denmark Y Y Y
Iceland Y Y Y Y
Norway Y Y
Sweden Y
United Kingdom Y Y Y Y Y
Non-European Countries
Australia Y
India Y Y Y Y Y Y
Japan Y Y Y Y Y Y
Korea Y Y Y Y Y Y Y
South Africa
United States Y Y Y Y Y Y
Non-Euro-Area Central, Eastern, and Southeastern Europe
Albania Y Y Y
Bosnia and Herzegovina Y
Bulgaria Y
Croatia Y Y Y Y
Czech Republic
Hungary Y Y Y
Latvia Y Y Y
Lithuania Y Y
FYR Macedonia Y Y Y
Moldova Y Y Y
Montenegro Y
Poland Y
Romania Y Y Y
Russia Y Y Y Y
Serbia Y Y Y Y Y
Turkey
Ukraine Y Y Y Y
Source: IMF staff.
Note: This table lists the various types of policies countries have implemented since 2007, based on Appendix Table 2.1, without consideration of the scope, duration, or effectiveness of those policies. “Stress test” and “coverage enhancement of deposit insurance” are excluded from the policies supporting credit demand. EU-wide fiscal programs (e.g., through the European Investment Bank and the European Bank for Reconstruction and Development) are not included although they are available for firms in the EU member countries (and in some non-EU European countries).
1Monetary policy measures that may ease constraints to credit supply, such as direct and indirect credit easing as well as widening of collateral eligibility for private sector assets (see also Appendix Table 2.1).
2Measures include a reduction in risk weights for small and medium enterprise loans when calculating banks’ capital adequacy ratios, forbearance of nonperforming loans, and countercyclical macroprudential regulations. In the United Kingdom, the authorities have recently relaxed liquidity requirements for banks.
3This category includes ad hoc public assistance to banks that may not have been initiated to counter undercapitalization (in or out of crisis situations) but were intended to improve credit supply. For India, the “Y” includes an ongoing government contribution to the equity capital of banks that is a consequence of the partial government own- ership of banks, for which the relevant statute does not allow their ownership stake to go below 51 percent. Such contributions are a regular feature of the Indian banking system.
expanded and more detailed data (beyond the imper- fect proxies that are used in this analysis) that could more clearly identify the constraints to credit demand and supply.
Disentangling Credit Supply and Demand
Data from bank lending surveys can help distinguish between demand and supply factors that underlie credit developments. Identifying supply and demand shocks typically requires an exogenous source of demand and supply variation (Ashcraft, 2005), an exogenous instrument (Peek and Rosengren, 2000), or matched borrower-bank data (Jiménez, Ongena, Peydró, and Saurina, 2012). In the absence of such data, the analysis here relies on answers to bank lending surveys con- ducted by central banks in the euro area and the United States.10 For these surveys, bank loan oicers are asked for their views about the various factors afecting credit demand and credit supply using questions on credit demand conditions and changes in lending standards.
Although the survey responses are qualitative (for example, credit is assessed as having “tightened consider- ably or somewhat,” “eased considerably or somewhat,”
or “no change”), they can be assigned a numerical value to obtain a quantitative index. he approach in this chapter assumes that the responses from loan oicers in the bank lending surveys are good proxies for unob- served demand and supply.11
he approach determines how much credit growth can be attributed to demand or supply factors (Annex 2.2). Demand factors are proxied by the fraction of
10In the euro area, the ECB conducts the quarterly Bank Lending Survey (www.ecb.europa.eu/stats/money/surveys/lend/html/index.
en.html), and in the United States, the Federal Reserve conducts the quarterly Senior Loan Oicer Opinion Survey on Bank Lending Practices (www.federalreserve.gov/boarddocs/snloansurvey). Data series that are long enough for this analysis are available for Austria, France, Germany, Italy, Luxembourg, the Netherlands, Portugal, Spain, and the United States. he surveys include questions such as,
“How has the demand for loans changed at your bank over the past three months?” and “How have your bank’s credit standards changed over the past three months?”
11Although this analysis provides useful insight, it still sufers from potential bias.For example, reporting bias is a concern:
surveyed banks may try to please their supervisors and fail to report true credit supply conditions. Despite this problem, an emerging literature makes use of survey data to shed light on the determi- nants of credit growth, and there is evidence that it contains useful information. For example, Lown and Morgan (2006) and De Bondt and others (2010) show that the surveys have predictive power for output and credit growth in the United States and in the euro area, respectively.
banks reporting in the survey that they observed an increase in demand for loans minus the fraction that observed a decrease. Supply factors are proxied by a measure of lending standards from which the inluence of factors that are not related to bank balance sheets is statistically removed. hese factors should be removed because lending standards reported in surveys may not relect “pure” shifts in credit supply but instead may respond to changes in factors such as borrowers’ credit worthiness, the economic outlook, and uncertainty, which also afect loan demand conditions. After cleans- ing the raw data to arrive at a better measure of “pure”
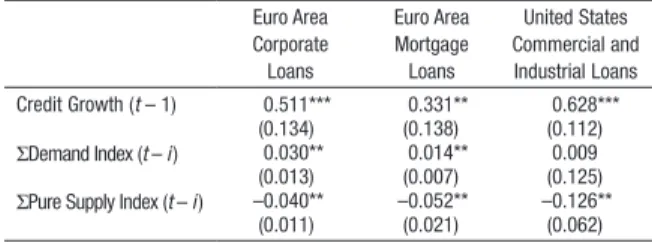
supply factors, credit growth can be decomposed into demand and supply inluences. hese inluences are computed using the estimated coeicients from a regression of credit growth on the demand index and the adjusted lending standards (Table 2.4).12
he results of this decomposition show that both demand and supply factors are important in explain- ing credit developments in both the euro area and the United States but that their relative inluence varies over time.
• Corporate credit (Figure 2.8): Demand factors had a negative effect in late 2009 in Austria, France, the Netherlands, and Spain. Most countries saw deterio- rating demand conditions in the most recent period, including Germany, where demand conditions had been relatively favorable since the start of the crisis.
Supply factors have had a negative effect throughout the period in most countries (with particularly strong negative effects in Portugal), but eased in most euro
12Unfortunately, the reasons provided in the survey as explana- tions for changes in demand do not allow for a straightforward classiication between supply and demand factors as is the case for the supply questions and hence cannot be used to perform the same technique to “cleanse” the data as done for the supply side.
Table 2.4. Determinants of Credit Growth
Euro Area Corporate
Loans
Euro Area Mortgage Loans
United States Commercial and Industrial Loans Credit Growth (t – 1) 0.511***
(0.134)
0.331**
(0.138)
0.628***
(0.112) ΣDemand Index (t – i) 0.030**
(0.013)
0.014**
(0.007)
0.009 (0.125) ΣPure Supply Index (t – i) –0.040**
(0.011)
–0.052**
(0.021)
–0.126**
(0.062) Source: IMF staff estimates.
Note: Regressions include a lag of the dependent variable and four lags of the demand indicator and the “pure” supply indicator (see Annex 2.2) as well as seasonal dummies. For the euro area, Arellano and Bond (1991) regressions with robust standard errors are in parentheses. The euro area estimation covers 2003:Q1–2013:Q1 and includes Austria, France, Germany, Italy, Luxembourg, the Netherlands, Portugal, and Spain. For the United States, an ordinary least squares regression is estimated for the period 1999:Q1–2013:Q1. ** and *** denote significance at the 5 and 1 percent levels, respectively.
area countries in the first half of 2012, likely as a result of the long-term refinancing operations of the ECB. More recently, demand constraints appear to outweigh supply constraints in France.
• Mortgage credit13 (Figure 2.9): The negative effect of demand factors in 2009 and 2010 on mortgage credit in a number of countries was more moderate than on corporate loans, and demand recovered in 2011 and 2012 before turning down again more recently (except in Austria and Germany). Most countries saw a double- dip in supply constraints, with a temporary relaxation around 2010. However, most recently (and in contrast to developments for corporate loans), supply constraints for mortgage loans eased in 2013 in a number of coun- tries, most markedly in France, Italy, and Portugal.
Identifying Factors Constraining Credit
his section ofers a more detailed set of tools to identify the factors constraining credit by estimating the under- lying determinants of credit demand and credit supply.
Two approaches are employed: (1) an estimation of the country-speciic structural determinants of bank credit supply and demand; and (2) a irm-level panel estima- tion of factors that afect manufacturing irms’ borrow- ing. Both approaches focus on credit to irms.
Evidence from a structural model of bank lending his approach estimates supply and demand equations for aggregate bank lending for major countries that have had weak credit growth.14 he exercise has exten- sive data requirements and presents challenging econo- metric issues (Box 2.2). As a result, reliable results were obtained only for corporate loans in France, Japan, Spain, and the United Kingdom.15
Because shifts in demand and supply cannot be observed directly, the analysis uses “shifters” that are meant to afect only one, but not the other, side of the market, thus allowing demand and supply to be
13he analysis of mortgage lending does not include the United States because of a break in the mortgage lending standards series in 2007 and because the Senior Loan Oicer Survey does not include questions regarding the reasons for tightening or easing lending standards for mortgages.
14See Annex 2.3 for details of the model’s design.
15France and Japan were included in the estimation, although bank credit growth to the private sector (noninancial corporations and households alike) was not identiied as weak according to Table 2.1. Still, bank credit in Japan was identiied as weak until the third quarter of 2012, and bank credit to noninancial irms in France (ECB data) declined in the last quarters of 2012. In addition, both countries implemented credit-supporting policies.
–1 0 1
2 3. Germany
–5 –4 –3 –2 –1 0 1 2. France 2
–2 –1 0 1 4. Italy 2
–4 –3 –2 –1 0
1 5. Netherlands
–4 –3 –2 –1 0 1 6. Portugal 2
Demand component Supply component
–2.5 –2.0 –1.5 –1.0 –0.5 0.0 0.5 1. Austria
–6 –5 –4 –3 –2 –1 0 1 8. United States 2
–3 –2 –1 0 1 7. Spain
Sources: European Central Bank, Bank Lending Survey; Federal Reserve, Senior Loan Officer Survey; and IMF staff calculations.
Note: Demand and supply components are constructed using the estimates in Table 2.4. The demand component is the fitted values constructed recursively using the lags for the demand index and setting the "pure" supply index to zero. The supply component is constructed analogously.
Figure 2.8. Decomposing Credit Growth: Corporate Loans
2008 09 10 11 12 13 2008 09 10 11 12 13
2008 09 10 11 12 13 2008 09 10 11 12 13
2008 09 10 11 12 13 2008 09 10 11 12 13
2008 09 10 11 12 13 2008 09 10 11 12 13
identiied separately. his econometric technique is commonly used but is diicult to implement because it requires accurately identifying variables associated with either demand or supply, but not with both. he vari- ables chosen that afect only supply (thereby tracing out and identifying the demand curve) include the cost of bank funding and basic balance sheet variables (the bank’s capital-to-asset ratio).16 On the demand side, the variables include the rate of capacity utilization and a proxy for the availability of market inancing.17
he supply and demand equations include several variables to capture more directly some of the market constraints previously discussed. In particular, the noninancial irms’ debt-to-equity ratio aims to capture the efect of debt overhang on credit demand (and serves as an indicator of credit risk from the viewpoint of banks on the supply side). Although the growth of the stock market index is correlated with the value of irms’ collateral (a supply-side constraint), it may also increase irms’ preference for equity inancing (afect- ing credit demand). he presumed relationships and reasons for choosing the speciic variables are discussed in Annex 2.3.
he estimated supply and demand equations for bank credit are well identiied overall. For all coun- tries, one or more of the demand and supply shifters is signiicant in the regression, identifying the demand and supply equations for these countries (Table 2.5).
On the supply side, lower funding costs (proxied by deposit rates) tend to increase the supply of bank loans. he amount of capital a bank holds relative to its total assets yields a counterintuitive negative sign in France and Spain. hese results should probably not be given too much weight, because they may relect an inaccurate proxy for bank capital, a scaling down of lending by banks that are building up their capital buf- fers, or ongoing major bank restructuring in Spain.18 Additional results (see below) show a positive relation- ship between bank capital and lending by banks. On the demand side, in most cases, capacity utilization has the expected positive efect on irms’ demand for loans,
16Unfortunately, a better proxy—regulatory capital—is not available.
17Although inding one shifter each for the supply and demand side is theoretically enough to identify the model empirically, the potential endogeneity of some shifters complicates proper identiication.
18Despite the increase in system-level capitalization (including injection of public capital), lending continues to contract, which may relect in part the deleveraging requirements imposed on banks that receive government aid.
–1 0
1 3. Germany
–3 –2 –1 0 1 2. France 2
–2 –1 0 1 4. Italy 2
–4 –3 –2 –1 0
1 5. Netherlands
–4 –3 –2 –1 0 1 6. Portugal 2
–2 –1 0 1 1. Austria
–2 –1 0 1 2 7. Spain
Demand component Supply component
Sources: European Central Bank, Bank Lending Survey; and IMF staff calculations.
Note: Demand and supply components are constructed using the estimates in Table 2.4. The demand component is the fitted values constructed recursively using the lags for the demand index and setting the "pure" supply index to zero. The supply component is constructed analogously.
Figure 2.9. Decomposing Credit Growth: Mortgage Loans
2008 09 10 11 12 13 2008 09 10 11 12 13
2008 09 10 11 12 13 2008 09 10 11 12 13
2008 09 10 11 12 13 2008 09 10 11 12 13
2008 09 10 11 12 13