Supplemental figures
Fig. S1. (A) Timeline and representative image of ipsilateral-LC (LC
ipsi) and contralateral-LC
(LC
contra) inhibition with a lidocaine (4%) microinjection in Sprague-Dawley rats. (B)
Representative image of LC
ipsiinhibition by lidocaine (4%) microinjection. The graphs show the
withdrawal threshold of the ipsilateral and contralateral paw of ST-, MT- and LT-CCI rats in
pressure tests (ST - Sham-Sal n=4, Sham-Lido n=4, CCI-Sal n=4, CCI-Lido n=3; MT - Sham-
Sal n=4, Sham-Lido n=4, CCI-Sal n=4, CCI-Lido n=4; LT - Sham-Sal n=4, Sham-Lido n=4,
CCI-Sal n=3, CCI-Lido n=4: ***p<0.001 vs Sham-Sal; +p<0.05 vs CCI-Sal). (C)
Representative image of LC
contrainhibition by lidocaine (4%) microinjection. The graphs show
response of the Ipsilateral and Contralateral paw of ST-, MT- and LT-CCI rats in the acetone
test (ST - Sham-Sal n=8, Sham-Lido n=10, CCI-Sal n=8, CCI-Lido n=10; MT - Sham-Sal n=9,
Sham-Lido n=10, CCI-Sal n=10, CCI-Lido n=10; LT - Sham-Sal n=7, Sham-Lido n=9, CCI-Sal
n=9, CCI-Lido n=10: ***p<0.001 vs Sham-Sal; +p<0.05, +++p<0.001 vs CCI-Sal). CCI,
Chronic constriction injury; PP, paw pressure; Sal, Saline; Lido, Lidocaine; Ipsi-paw, ipsilateral
paw; Contra-paw, contralateral paw.
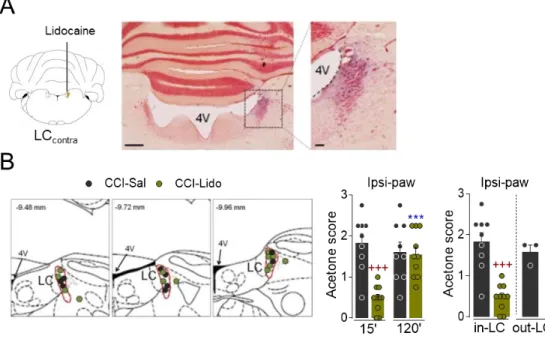
Fig. S2. (A) Representative image of LC
contrainhibition by lidocaine (4%) microinjection in Sprague-Dawley rats. Photomicrograph of a coronal section (neutral red stain) of a Sprague- Dawley rat brainstem showing the spread of Pontamine Sky Blue solution after its administration into the LC (scale bar: 250 µm) and a higher magnification of the inset (scale bar 250 µm). (B) Schemes adapted from the Paxinos and Watson atlas (co-ordinates relative to bregma: Paxinos and Watson, 2007) to show the lidocaine microinjection sites within (in) and beyond (out) the LC of the LT-CCI rats. The graph shows the duration of the effect of lidocaine in the acetone test, the graph shows the response of the ipsilateral hindpaw 15 and 120 min after applying acetone (CCI-Sal n=9, CCI-CNO n=10: ***p<0.001 vs CCI-Lido (15’); +++p<0.001 vs CCI-Sal (15’). The next graph shows the response of the ipsilateral paw in the acetone test when lidocaine was microinjected outside the LC (CCI-Sal [out-LC] n=3, CCI-Sal [in-LC] n=9, CCI-CNO [in-LC] n=10: +++p<0.001 vs CCI-Sal). CCI, Chronic constriction injury; Lido, lidocaine; Sal, saline; LC, locus coeruleus; 4V, fourth ventricle; Ipsi-paw, ipsilateral paw;
Contra-paw, contralateral paw.
Fig. S3. (A) Timeline of contralateral-LC (LC
contra) inhibition with a lidocaine (4%) microinjection in Long-Evans rats. (B) Representative image of LC
contrainhibition by lidocaine (4%) microinjection. The graphs show the withdrawal threshold of the ipsilateral and contralateral paw of CCI-LT rats in acetone and paw pressure test (CCI-Sal n=6, CCI-Lido n=8). (C) Quantification of pCREB positive neurons to the ipsilateral DRt (DRt
ipsi) and contralateral (DRt
contra) of sham and CCI-LT rats of Long-Evans rats (Sham n=4, CCI n=4). (D) Representative image of pCREB positive neurons into the DRt
ipsior DRt
contraof CCI-LT rats.
CCI, Chronic constriction injury; LT, Long-term; LC, locus coeruleus; DRt, dorsal reticular
nucleus; IR, immunoreactivity; A, acetone; PP, paw pressure; Sal, Saline; Lido, Lidocaine; Ipsi-
paw, ipsilateral paw; Contra-paw, contralateral paw. Some elements of this figure were
produced using BioRender (www.BioRender.com).
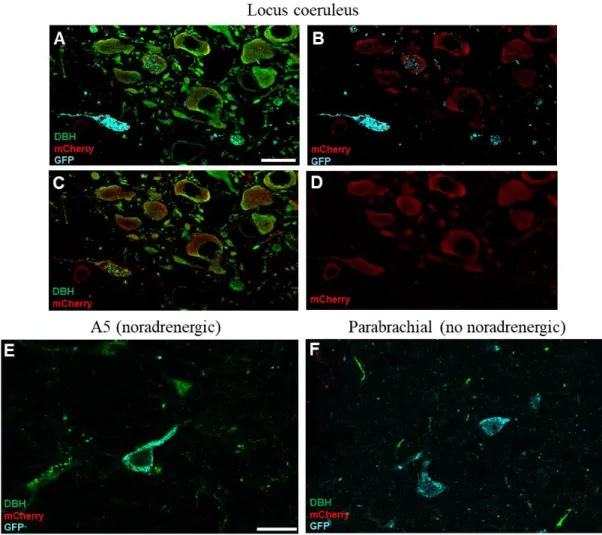
Fig. S4. Representative immunofluorescence of DBH, mCherry and GFP expression in (A-D)
locus coeruleus neurons (E) A5 noradrenergic nucleus and (F) parabrachial nucleus (no
noradrenergic). Scale bar: 20 μm.
Fig. S5. (A) Timeline and scheme of the retrograde CAV-Cre-GFP injection into the DRt
contraand AAV-mCherry (control virus) into LC
contraof Sprague-Dawley rats to test that CNO does
not provoke changes in the nociceptive tests. (B) The graphs show the response of the Ipsilateral
and Contralateral paw in the acetone, von Frey and spontaneous pain tests after CNO (1 mg/kg,
i.p.) administration to CCI-LT animals (CCI-Sal n=8; CCI-CNO n=5). (C) The graphs show the
response of the Ipsilateral and Contralateral paw in the acetone, von Frey and spontaneous pain
tests after clonidine (20 µg, i.t.) administration (CCI-Sal n=8; CCI-Cloni n=5): +++p<0.001 vs CCI-Sal. (D) Representative image of the intrathecal injection of Pontamine Sky Blue solution.
CCI, Chronic constriction injury; LC, locus coeruleus; DRt, dorsal reticular nucleus; LT, Long- term; CNO, clozapine-n-oxide; Sal, Saline; Cloni, clonidine; A, acetone test; VF, von Frey test;
SP, spontaneous pain test; i.t., intrathecal; i.p., intraperitoneal; Ipsi-paw, ipsilateral paw; Contra-
paw, contralateral paw.
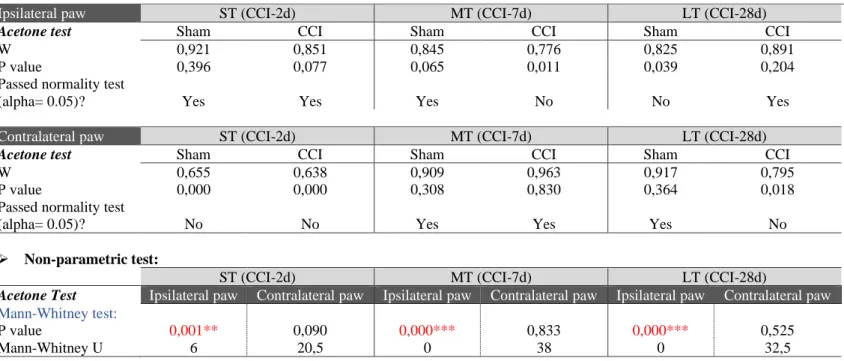
Table 1. Statistical analysis for Fig.1A
➢ Shapiro-Wilk normality test:
Ipsilateral paw ST (CCI-2d) MT (CCI-7d) LT (CCI-28d)
Acetone test Sham CCI Sham CCI Sham CCI
W 0,921 0,851 0,845 0,776 0,825 0,891
P value 0,396 0,077 0,065 0,011 0,039 0,204
Passed normality test
(alpha= 0.05)? Yes Yes Yes No No Yes
Contralateral paw ST (CCI-2d) MT (CCI-7d) LT (CCI-28d)
Acetone test Sham CCI Sham CCI Sham CCI
W 0,655 0,638 0,909 0,963 0,917 0,795
P value 0,000 0,000 0,308 0,830 0,364 0,018
Passed normality test
(alpha= 0.05)? No No Yes Yes Yes No
➢ Non-parametric test:
ST (CCI-2d) MT (CCI-7d) LT (CCI-28d)
Acetone Test Ipsilateral paw Contralateral paw Ipsilateral paw Contralateral paw Ipsilateral paw Contralateral paw Mann-Whitney test:
P value 0,001** 0,090 0,000*** 0,833 0,000*** 0,525
Mann-Whitney U 6 20,5 0 38 0 32,5
Table 2. Statistical analysis for Fig.1C and Fig. S1B
➢ Shapiro-Wilk normality test
Ipsilateral paw ST (CCI-2d) MT (CCI-7d) LT (CCI-28d)
Acetone test Sham-Sal Sham-Lido CCI-Sal CCI-Lido Sham-Sal Sham-Lido CCI-Sal CCI-Lido Sham-Sal Sham-Lido CCI-Sal CCI-Lido
W 0,971 0,727 0,901 0,824 0,640 0,853 0,884 0,870 0,601 0,724 0,864 0,951
P value 0,906 0,003 0,257 0,051 0,001 0,167 0,208 0,187 0,000 0,004 0,107 0,697
Passed normality test
(alpha= 0.05)? Yes No Yes Yes No Yes Yes Yes No No Yes Yes
Paw Pressure test
W 0,863 0,920 0,971 1 0,895 0,895 0,993 0,981 0,827 0,920 0,855 0,887
P value 0,272 0,539 0,85 >0,999 0,406 0,406 0,972 0,911 0,161 0,538 0,253 0,369
Passed normality test
(alpha= 0.05)? Yes Yes Yes Yes Yes Yes Yes Yes Yes Yes Yes Yes
Contralateral paw ST (CCI-2d) MT (CCI-7d) LT (CCI-28d)
Acetone test Sham-Sal Sham-Lido CCI-Sal CCI-Lido Sham-Sal Sham-Lido CCI-Sal CCI-Lido Sham-Sal Sham-Lido CCI-Sal CCI-Lido
W 0,889 0,916 0,684 0,827 0,907 0,915 0,801 0,858 0,782 0,693 0,617 0,813
P value 0,194 0,364 0,001 0,055 0,415 0,473 0,030 0,144 0,018 0,002 0,000 0,028
Passed normality test
(alpha= 0.05)? Yes Yes No Yes Yes Yes No Yes No No No No
Paw Pressure test
W 0,863 0,963 0,971 0,964 0,827 0,998 0,971 0,916 0,993 0,827 1 0,939
P value 0,272 0,798 0,85 0,637 0,161 0,995 0,85 0,513 0,972 0,161 >0,999 0,650
Passed normality test
(alpha= 0.05)? Yes Yes Yes Yes Yes Yes Yes Yes Yes Yes Yes Yes
➢ Non-parametric test
ST (CCI-2d) MT (CCI-7d) LT (CCI-30d)
Acetone Test Ipsilateral paw Contralateral paw Ipsilateral paw Contralateral paw Ipsilateral paw Contralateral paw Kruskal-Wallis test:
P value <0,000*** 0,286 0,000*** 0,569 <0,000*** 0,566
Kruskal-Wallis statistic 27,27 3,785 19,86 2,015 25,36 2,029
Mann-Whitney test:
Sham-Sal vs Sham-Lido
P value 0,075 0,196 0,688 0,794 0,928 0,922
Mann-Whitney U 20 25 14 15 28,5 29
Sham-Sal vs CCI-Sal
P value 0,002** 0,195 0,000*** 0,667 <0,000*** 0,413
Mann-Whitney U 6,5 25 0 20 0 27
CCI-Sal vs CCI-Lido
P value 0,001** 0,767 0,536 >0,999 0,992 0,250
Mann-Whitney U 5,5 33 22,5 28 40 25,5
➢ Parametric test
Two-way ANOVA: ST (CCI-2d) MT (CCI-7d) LT (CCI-30d)
Paw Pressure test Ipsilateral paw Contralateral paw Ipsilateral paw Contralateral paw Ipsilateral paw Contralateral paw Surgery F(1,11)=164,159*** F(1,11)=0,173 F(1,12)=107,391*** F(1,12)=0,000 F(1,11)=60,172*** F(1,11)=0,688 Treatment F(1,11)=10,743** F(1,11)=0,530 F(1,12)=0,023 F(1,12)=6,000 F(1,11)=0,164 F(1,11)=0,416 Interaction F(1,11)=4,350 F(1,11)=3,908 F(1,12)=6,519* F(1,12)=0,050 F(1,11)=0,335 F(1,11)=1,910
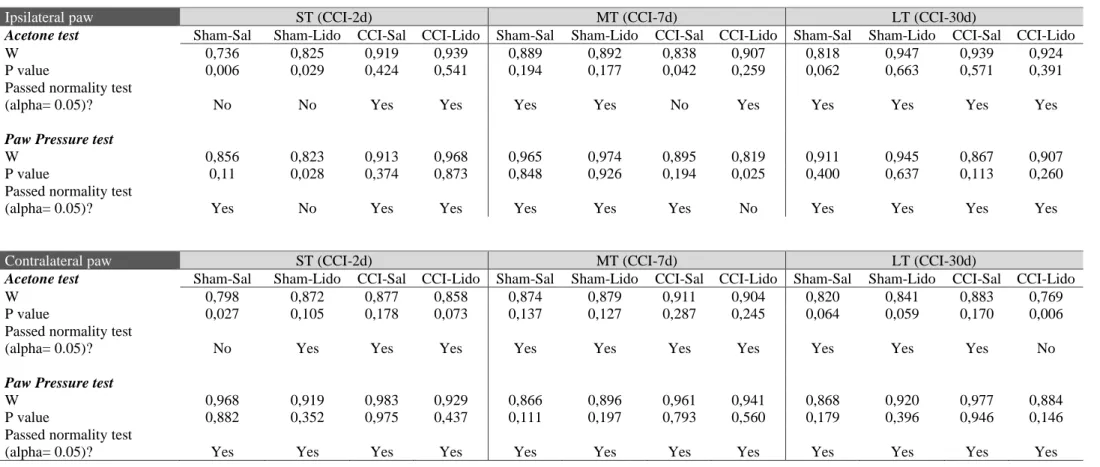
Table 3. Statistical analysis for Fig.1D and Fig. S1C
➢ Shapiro-Wilk normality test
Ipsilateral paw ST (CCI-2d) MT (CCI-7d) LT (CCI-30d)
Acetone test Sham-Sal Sham-Lido CCI-Sal CCI-Lido Sham-Sal Sham-Lido CCI-Sal CCI-Lido Sham-Sal Sham-Lido CCI-Sal CCI-Lido
W 0,736 0,825 0,919 0,939 0,889 0,892 0,838 0,907 0,818 0,947 0,939 0,924
P value 0,006 0,029 0,424 0,541 0,194 0,177 0,042 0,259 0,062 0,663 0,571 0,391
Passed normality test
(alpha= 0.05)? No No Yes Yes Yes Yes No Yes Yes Yes Yes Yes
Paw Pressure test
W 0,856 0,823 0,913 0,968 0,965 0,974 0,895 0,819 0,911 0,945 0,867 0,907
P value 0,11 0,028 0,374 0,873 0,848 0,926 0,194 0,025 0,400 0,637 0,113 0,260
Passed normality test
(alpha= 0.05)? Yes No Yes Yes Yes Yes Yes No Yes Yes Yes Yes
Contralateral paw ST (CCI-2d) MT (CCI-7d) LT (CCI-30d)
Acetone test Sham-Sal Sham-Lido CCI-Sal CCI-Lido Sham-Sal Sham-Lido CCI-Sal CCI-Lido Sham-Sal Sham-Lido CCI-Sal CCI-Lido
W 0,798 0,872 0,877 0,858 0,874 0,879 0,911 0,904 0,820 0,841 0,883 0,769
P value 0,027 0,105 0,178 0,073 0,137 0,127 0,287 0,245 0,064 0,059 0,170 0,006
Passed normality test
(alpha= 0.05)? No Yes Yes Yes Yes Yes Yes Yes Yes Yes Yes No
Paw Pressure test
W 0,968 0,919 0,983 0,929 0,866 0,896 0,961 0,941 0,868 0,920 0,977 0,884
P value 0,882 0,352 0,975 0,437 0,111 0,197 0,793 0,560 0,179 0,396 0,946 0,146
Passed normality test
(alpha= 0.05)? Yes Yes Yes Yes Yes Yes Yes Yes Yes Yes Yes Yes
➢ Non-parametric test
ST (CCI-2d) MT (CCI-7d) LT (CCI-30d)
Acetone test Ipsilateral paw Contralateral paw Ipsilateral paw Contralateral paw Ipsilateral paw Contralateral paw Kruskal-Wallis test:
P value 0,002** 0,183 <0,000*** 0,307
Kruskal-Wallis statistic 14,850 4,847 24,530 3,604
Mann-Whitney test:
Sham-Sal vs Sham-Lido
P value >0,999 0,163 0,609 0,292
Mann-Whitney U 38,5 25 38 21
Sham-Sal vs CCI-Sal
P value 0,000*** 0,076 <0,000*** 0,472
Mann-Whitney U 1,5 15,5 0,5 24,5
CCI-Sal vs CCI-Lido
P value 0,344 0,997 0,002** 0,249
Mann-Whitney U 29 39 10,5 31
Paw pressure test Kruskal-Wallis test:
P value 0,005** <0,000***
Kruskal-Wallis statistic 12,87 30,67
Mann-Whitney test:
Sham-Sal vs Sham-Lido
P value 0,113 0,082
Mann-Whitney U 22 23,5
Sham-Sal vs CCI-Sal
P value 0,044* <0,000***
Mann-Whitney U 13 0
CCI-Sal vs CCI-Lido
P value 0,840 0,031*
Mann-Whitney U 37,5 22
➢ Parametric test
Two-way ANOVA ST (CCI-2d) MT (CCI-7d) LT (CCI-30d)
Acetone test Ipsilateral paw Contralateral paw Ipsilateral paw Contralateral paw Ipsilateral paw Contralateral paw
Surgery F(1,35)=1,537 F(1,31)=22,141***
Treatment F(1,35)=0,622 F(1,31)=21,455***
Interaction F(1,35)=0,001 F(1,31)=21,962***
Paw pressure test
Surgery F(1,32)=3,564 F(1,35)=2,446 F(1,31)=173,447*** F(1,31)=2,611
Treatment F(1,32)=2,917 F(1,35)=0,612 F(1,31)=35,392*** F(1,31)=0,012
Interaction F(1,32)=0,655 F(1,35)=1,184 F(1,31)=21,401*** F(1,31)=1,518
Table 4. Statistical analysis for Fig. S2
➢ Shapiro-Wilk normality test
CCI-sal (15') CCI-Lido (15') CCI-sal (120') CCI-Lido (120')
Acetone test
W 0,939 0,924 0,968 0,900
P value 0,571 0,392 0,875 0,216
Passed normality test (alpha= 0.05)? Yes Yes Yes Yes
Parametric test
Acetone test
One-way ANOVA with repeated measure:
Treatment F(1,17)=12,335**
Time F(1,17)=5,893*
Treatment x Time F(1,17)=13,637**
Unpaired Student’s t-test:
CCI-Lido vs CCI-Sal (in-LC) t (17)=5,710***
CCI-Lido vs CCI-Sal (out-LC) t (10)=0.609
Table 5. Statistical analysis of Fig. S3B
➢ Shapiro-Wilk normality test
Ipsilateral paw Contralateral paw
Acetone test CCI-Sal CCI-Lido CCI-Sal CCI-Lido
W 0,908 0,843 0,701 0,418
P value 0,421 0,082 0,006 <0,0001
Passed normality test (alpha= 0.05)? Yes Yes No No
Paw Pressure test
W 0,916 0,920 0,876 0,934
P value 0,473 0,433 0,252 0,551
Passed normality test (alpha= 0.05)? Yes Yes Yes Yes
➢ Non-parametric test
Acetone test Ipsilateral paw Contralateral paw
Mann-Whitney test:
P value 0,539
Mann-Whitney U 20
➢ Parametric tests
Ipsilateral paw Contralateral paw
Acetone test
Unpaired Student’s t-test: t(12)=0,874
Paw pressure test
Unpaired Student’s t-test: t(12)=1,139 t(12)=0,143
Table 6. Statistical analysis for Fig. 2A
➢ Shapiro-Wilk normality test
Immobility Climbing Swimming
Forced swimming test Sham CCI Sham CCI Sham CCI
W 0,791 0,866 0,993 0,891 0,801 0,907
P value 0,087 0,210 0,972 0,324 0,103 0,415
Passed normality test
(alpha= 0.05)? Yes Yes Yes Yes Yes Yes
➢ Parametric test
Forced swimming test Immobility Climbing Swimming Unpaired Student’s t-
test: t(8)=11*** t(8)=14,06*** t(8)=0,388
Table 7. Statistical analysis for Fig. 2B
➢
Shapiro-Wilk normality test
Ipsilateral LC Immobility Climbing Swimming
Forced swimming test Sham-Sal Sham-Lido CCI-Sal CCI-Lido Sham-Sal Sham-Lido CCI-Sal CCI-Lido Sham-Sal Sham-Lido CCI-Sal CCI-Lido
W 0,867 0,952 0,979 0,890 0,857 0,928 0,739 0,917 0,822 0,850 0,914 0,914
P value 0,214 0,760 0,928 0,272 0,178 0,566 0,023 0,448 0,091 0,158 0,490 0,421
Passed normality test
(alpha= 0.05)? Yes Yes Yes Yes Yes Yes No Yes Yes Yes Yes Yes
Contralateral LC Immobility Climbing Swimming
Forced swimming test Sham-Sal Sham-Lido CCI-Sal CCI-Lido Sham-Sal Sham-Lido CCI-Sal CCI-Lido Sham-Sal Sham-Lido CCI-Sal CCI-Lido
W 0,933 0,950 0,895 0,963 0,905 0,938 0,843 0,922 0,896 0,591 0,843 0,887
P value 0,479 0,671 0,191 0,820 0,247 0,531 0,048 0,371 0,198 <0,0001 0,048 0,157
Passed normality test
(alpha= 0.05)? Yes Yes Yes Yes Yes Yes No Yes Yes No No Yes
➢ Non-parametric test
Ipsilateral LC Contralateral LC
Forced swimming test Immobility Climbing Swimming Immobility Climbing Swimming
Kruskal-Wallis test:
P value 0,007** 0,001** 0,715
Kruskal-Wallis statistic 12,03 16 1,359
Mann-Whitney test:
Sham-Sal vs Sham-Lido
P value 0,429 0,516 0,676
Mann-Whitney U 12,5 41 44
Sham-Sal vs CCI-Sal
P value 0,004** 0,008** 0,490
Mann-Whitney U 0 16 40,5
CCI-Sal vs CCI-Lido
P value 0,003** <0,000*** 0,667
Mann-Whitney U 0 0 44
➢ Parametric test
Forced swimming test Ipsilateral LC Contralateral LC
Two-way ANOVA: Immobility Climbing Swimming Immobility Climbing Swimming
Surgery F(1,20)=8,735** F(1,20)=0,073 F(1,36)=6,191*
Treatment F(1,20)=3,627 F(1,20)=0,025 F(1,36)=7,510**
Surgery x Treatment F(1,20)=11,865** F(1,20)=2,540 F(1,36)=10,300**
Table 8. Statistical analysis for Fig. 2C
➢ Shapiro-Wilk normality test
Contralateral LC Sham-Sal Sham-Lido CCI-Sal CCI-Lido Spontanous locomotor activity
W 0,969 0,903 0,912 0,922
P value 0,889 0,309 0,369 0,444
Passed normality test (alpha=
0.05)? Yes Yes Yes Yes
➢ Parametric test
Spontanous locomotor activity Two-way ANOVA (repeated measure):
Surgery F(1,13)=0,330
Treatment F(1,13)=0,002
Surgery x Treatment F(1,13)=0,033
Time F(7,91)=83,612***
Surgery x Time F(7,91)=0,647
Treatment x Time F(7,91)=0,501
Surgery x Treatment x Time F(7,91)=0,536
Table 9. Statistical analysis for Fig. 3B
➢ Shapiro-Wilk normality test Ipsilateral paw
Distribution FG (%) Ipsilateral LC Contralateral LC
W 0,947 0,947
P value 0,554 0,554
Passed normality test
(alpha= 0.05)? Yes Yes
➢ Parametric tests
Distribution FG (%)
Unpaired Student’s t-test: t(4)=6,179**
Table 10. Statistical analysis for Fig. 3C
➢ Shapiro-Wilk normality test
Ipsilateral LC Contralateral LC Distribution FG (%) Dorsal Ventral Dorsal Ventral
W 0,835 0,835 0,852 0,852
P value 0,202 0,202 0,245 0,245
Passed normality test
(alpha= 0.05)? Yes Yes Yes Yes
➢ Parametric tests
Ipsilateral LC Contralateral LC
Distribution FG (%)
Unpaired Student’s t-test: t(4)=2,568 t(4)=1,795
Table 11. Statistical analysis for Fig. 3D
Shapiro-Wilk normality testIpsilateral paw contralateral paw
pCREB expression (DRt) Sham CCI Sham CCI
W 0,989 0,999 0,775 0,937
P value 0,953 0,953 0,064 0,516
Passed normality test (alpha=
0.05)? Yes Yes Yes Yes
Parametric test
Two-way ANOVA:
pCREB expression (DRt)
Surgery F(1,10)=4,275
Side (LC) F(1,10)=5,581*
Surgery x Side (LC) F(1,10)=15,994**
Table 12. Statistical analysis of Fig. S3C
➢ Shapiro-Wilk normality test
Ipsilateral paw contralateral paw pCREB expression into DRt Sham CCI Sham CCI
W 0,989 0,999 0,775 0,937
P value 0,953 0,953 0,064 0,516
Passed normality test (alpha= 0.05)? Yes Yes Yes Yes
➢ Parametric test
Two-way ANOVA:
pCREB expression into DRt
Surgery F(1,12)=0,588
LC F(1,12)=0,036
Surgery x LC F(1,12)=5,799
Table 13. Statistical analysis for Fig. 4B
➢ Shapiro-Wilk normality test
Ipsilateral paw Contralateral paw
Acetone test Sham-Sal Sham-CNO CCI-Sal CCI-CNO Sham-Sal Sham-CNO CCI-Sal CCI-CNO
W 0,866 0,833 0,849 0,940 0,496 0,645 0,418 0,509
P value 0,212 0,086 0,093 0,549 <0,000 0,001 <0,000 <0,000
Passed normality test
(alpha= 0.05)? Yes Yes Yes Yes No No No No
Von Frey test
W 0,943 0,938 0,938 0,908 0,940 0,829 0,954 0,852
P value 0,685 0,617 0,594 0,271 0,656 0,079 0,746 0,062
Passed normality test
(alpha= 0.05)? Yes Yes Yes Yes Yes Yes Yes Yes
Spontaneous pain test
W 0,640 0,664 0,971 0,991 0,496 0,646 0,724 0,641
P value 0,001 0,002 0,908 0,998 <0,000 0,001 0,004 0,000
Passed normality test
(alpha= 0.05)? No No Yes Yes No No No No
➢ Non-parametric test
Ipsilateral paw Contralateral paw
Acetone test Kruskal-Wallis test:
P value 0,270
Kruskal-Wallis statistic 3,918
Mann-Whitney test:
Sham-Sal vs Sham-CNO
P value <0.999
Mann-Whitney U 19,000
Sham-Sal vs CCI-Sal
P value 0,528
Mann-Whitney U 17,500
CCI-Sal vs CCI-CNO
P value 0,261
Mann-Whitney U 28,000
Spontaneous pain test Kruskal-Wallis test:
P value <0,000*** 0,801
Kruskal-Wallis statistic 26,06 1,001
Mann-Whitney test:
Sham-Sal vs Sham-CNO
P value >0,999 0,853
Mann-Whitney U 19 18,000
Sham-Sal vs CCI-Sal
P value 0,001*** 0,497
Mann-Whitney U 0 18,500
CCI-Sal vs CCI-CNO
P value 0,000*** >0,999
Mann-Whitney U 4 39,000
➢ Parametric test
Two-way ANOVA: Ipsilateral paw Contralateral paw Acetone test
Surgery F(1,27)=168,304***
Treatment F(1,27)=41,967***
Surgery x Treatment F(1,27)=38,424***
Von Frey test
Surgery F(1,27)=91,314*** F(1,27)=0,486
Treatment F(1,27)=9,220** F(1,27)=0,701
Surgery x Treatment F(1,27)=7,249* F(1,27)=1,182
Table 14. Statistical analysis for Fig. 4C
➢ Shapiro-Wilk normality test
Ipsilateral paw Contralateral paw
Acetone test Sham-Sal Sham-Cloni CCI-Sal CCI-Cloni Sham-Sal Sham-Cloni CCI-Sal CCI-Cloni
W 0,552 0,496 0,932 0,820 0,552 0,640 0,566 0,650
P value 0,000 <0,000 0,534 0,025 0,000 0,001 <0,000 0,000
Passed normality test (alpha= 0.05)? No No Yes No No No No No
Von Frey test
W 0,983 0,931 0,964 0,909 0,893 0,990 0,899 0,882
P value 0,949 0,587 0,851 0,278 0,375 0,987 0,285 0,136
Passed normality test (alpha= 0.05)? Yes Yes Yes Yes Yes Yes Yes Yes
Spontaneous pain test
W 0,684 0,775 0,971 0,887 0,684 0,640 0,827 0,684
P value 0,006 0,035 0,908 0,184 0,006 0,001 0,055 0,001
Passed normality test (alpha= 0.05)? No No Yes Yes No No Yes No
➢ Non-parametric test
Ipsilateral paw Contralateral paw
Acetone test
Kruskal-Wallis test:
P value <0,000*** 0,950
Kruskal-Wallis statistic 22,1 0,351
Mann-Whitney test:
Sham-Sal vs Sham-Cloni
P value >0.999 >0,999
Mann-Whitney U 14,5 13
Sham-Sal vs CCI-Sal
P value 0,000*** >0,999
Mann-Whitney U 0 19
CCI-Sal vs CCI-CNO
P value 0,000*** 0,843
Mann-Whitney U 0 37
Spontaneous pain test
Kruskal-Wallis test:
P value <0,000**** 0,586
Kruskal-Wallis statistic 23,34 1,935
Mann-Whitney test:
Sham-Sal vs Sham-Cloni
P value 0,664 0,567
Mann-Whitney U 11,5 11
Sham-Sal vs CCI-Sal
P value 0,000*** >0,999
Mann-Whitney U 0 18
CCI-Sal vs CCI-Cloni
P value 0,000*** 0,426
Mann-Whitney U 2,5 26,5
➢ Parametric test
Two-way ANOVA: Ipsilateral paw Contralateral paw Von Frey test
Surgery F(1,25)=50,891*** F(1,25)=0,073 Treatment F(1,25)=6,858* F(1,25)=1,142 Interaction F(1,25)=3,899 F(1,25)=0,118
Table 15. Statistical analysis for Fig. S5B
➢ Shapiro-Wilk normality test
Ipsilateral paw Contralateral paw Acetone test CCI-Sal CCI-CNO CCI-Sal CCI-CNO
W 0,849 0,953 0,418 0,552
P value 0,093 0,758 <0,000 0,000
Passed normality test
(alpha= 0.05)? Yes Yes No No
Von Frey test
W 0,938 0,850 0,953 0,855
P value 0,594 0,194 0,746 0,211
Passed normality test
(alpha= 0.05)? Yes Yes Yes Yes
Spontaneous pain test
W 0,971 0,849 0,724 0,771
P value 0,908 0,192 0,004 0,046
Passed normality test
(alpha= 0.05)? Yes Yes No No
➢ Non-parametric test
Ipsilateral paw Contralateral paw
Acetone test
Mann-Whitney test:
P value >0.999
Mann-Whitney U 18,5
Spontaneous pain test
Mann-Whitney test:
P value >0,999
Mann-Whitney U 19
➢ Parametric tests
Ipsilateral paw Contralateral paw
Acetone test
Unpaired Student’s t-test: t(11)=0,531
Von Frey test
Unpaired Student’s t-test: t(11)=0,154 t(11)=0,992
Spontaneous pain test Unpaired Student’s t-test: t(11)=0,989
Table 16. Statistical analysis for Fig. S5C
➢ Shapiro-Wilk normality test
Ipsilateral paw Contralateral paw
Acetone test CCI-Sal CCI-CNO CCI-Sal CCI-CNO
W 0,932 0,833 0,566 0,552
P value 0,534 0,146 <0,000 0,000
Passed normality test
(alpha= 0.05)? Yes Yes No No
Von Frey test
W 0,964 0,864 0,899 0,914
P value 0,851 0,245 0,285 0,493
Passed normality test
(alpha= 0.05)? Yes Yes Yes Yes
Spontaneous pain test
W 0,971 0,902 0,827 0,684
P value 0,908 0,421 0,055 0,006
Passed normality test
(alpha= 0.05)? Yes Yes Yes No
➢ Non-parametric test
Ipsilateral paw Contralateral paw
Acetone test
Mann-Whitney test:
P value >0,999
Mann-Whitney U 19
Spontaneous pain test
Mann-Whitney test:
P value 0,499
Mann-Whitney U 14,5
➢ Parametric tests
Ipsilateral paw Contralateral paw
Acetone test
Unpaired Student’s t-test: t(11)=11,64***
Von Frey test
Unpaired Student’s t-test: t(11)=6,311*** t(11)=1,291
Spontaneous pain test
Unpaired Student’s t-test: t(11)=5,575***
Table 17. Statistical analysis for Fig. 5B
➢ Shapiro-Wilk normality test
Immobility Climbing Swimming
Forced swimming test Sham-Sal Sham-CNO CCI-Sal CCI-CNO Sham-Sal Sham-CNO CCI-Sal CCI-CNO Sham-Sal Sham-CNO CCI-Sal CCI-CNO
W 0,809 0,960 0,897 0,869 0,809 0,960 0,905 0,864 0,366 0,390 0,486 0,392
P value 0,019 0,797 0,172 0,119 0,019 0,797 0,214 0,106 <0.000 <0.000 <0.000 <0.000
Passed normality test
(alpha= 0.05)? No Yes Yes Yes No Yes Yes Yes No No No No
➢ Non-parametric test
Ipsilateral LC
Forced swimming test Immobility Climbing Swimming Kruskal-Wallis test:
P value 0,023* 0,019* 0,816
Kruskal-Wallis statistic 9,494 9,993 0,937
Mann-Whitney test:
Sham-Sal vs Sham-CNO
P value 0,007** 0,007** >0.999
Mann-Whitney U 13 13 44,50
Sham-Sal vs CCI-Sal
P value 0,002** 0,000*** 0,563
Mann-Whitney U 13 10,5 49,50
CCI-Sal vs CCI-CNO
P value 0,751 0,751 0,864
Mann-Whitney U 45 45 47,50
Table 18. Statistical analysis for Fig. 5C
➢ Shapiro-Wilk normality test
Sham-Sal Sham-CNO CCI-Sal CCI-CNO
Spontanous motor activity
W 0,916 0,910 0,906 0,880
P value 0,399 0,352 0,326 0,189
Passed normality test
(alpha= 0.05)? Yes Yes Yes Yes
➢ Parametric test
Spontanous motor activity
Two-way ANOVA (repeated measure):
Surgery F(1,35)=0,163
Treatment F(1,35)=0,515
Surgery x Treatment F(1,35)=0,192
Time F(7,245)=5,098***
Surgery x Time F(7,245)=0,983
Treatment x Time F(7,245)=0,769 Surgery x Treatment x Time F(7.245)=0.568
Table 19. Statistical analysis for Fig. 5D
➢ Shapiro-Wilk normality test
20 min after CNO Ipsilateral paw Contralateral paw
Acetone test Sham-Sal Sham-CNO CCI-Sal CCI-CNO Sham-Sal Sham-CNO CCI-Sal CCI-CNO
W 0,859 0,684 0,952 0,952 0,731 0,684 0,655 0,794
P value 0,074 0,001 0,709 0,712 0,002 0,001 0,000 0,017
Passed normality test
(alpha= 0.05)? Yes No Yes Yes No No No No
Von Frey test
W 0,925 0,914 0,852 0,944 0,840 0,870 0,934 0,899
P value 0,404 0,346 0,078 0,621 0,044 0,122 0,517 0,247
Passed normality test
(alpha= 0.05)? Yes Yes Yes Yes No Yes Yes Yes
360 min after CNO Ipsilateral paw Contralateral paw
Acetone test Sham-Sal Sham-CNO CCI-Sal CCI-CNO Sham-Sal Sham-CNO CCI-Sal CCI-CNO
W 0,594 0,780 0,910 0,883 0,778 0,825 0,617 0,655
P value <0.000 0,012 0,314 0,169 0,008 0,039 0,000 0,000
Passed normality test
(alpha= 0.05)? No No Yes Yes No No No No
Von Frey test
W 0,984 0,963 0,885 0,784 0,928 0,891 0,945 0,814
P value 0,984 0,826 0,178 0,014 0,428 0,205 0,633 0,030
Passed normality test
(alpha= 0.05)? Yes Yes Yes No Yes Yes Yes No
➢ Non-parametric test
20 min after CNO 360 min after CNO
Acetone test Ipsilateral paw Contralateral paw Ipsilateral paw Contralateral paw
Kruskal-Wallis test:
P value <0.000*** 0,387 P<0,000*** 0,274
Kruskal-Wallis statistic 57,58 7.41 28,37 3,888
Mann-Whitney test:
Sham-Sal vs Sham-CNO
P value 0.256 0950 0,550 0,661
Mann-Whitney U 31 42.50 36,5 40
Sham-Sal vs CCI-Sal
P value <0.000*** 0,565 0,000*** 0,106
Mann-Whitney U 0 39 0 25,5
CCI-Sal vs CCI-CNO
P value 0.001** 0,362 0,413 >0.999
Mann-Whitney U 6 29,5 31 36
Von Frey test Kruskal-Wallis test:
P value 0,850 <0,000*** 0,560
Kruskal-Wallis statistic 3,361 26,74 2,062
Mann-Whitney test:
Sham-Sal vs Sham-CNO
P value 0,940 0,734 0,870
Mann-Whitney U 44,5 40,5 42,5
Sham-Sal vs CCI-Sal
P value 0,840 0,000*** 0.988
Mann-Whitney U 42 0 44,5
CCI-Sal vs CCI-CNO
P value 0,781 0,462 0,285
Mann-Whitney U 37 38,5 28
➢ Parametric test
Two-way ANOVA:
Von Frey test 20 min Ipsilateral paw Contralateral paw
Surgery F(1,33)=225,011***
Treatment F(1,33)=4,750*
Interaction F(1,33)=6.528*