Phytochemistry
Characterization of complex photosynthetic pigment profiles in European deciduous tree leaves by sequential extraction and reversed-phase high performance liquid
chromatography.
--Manuscript Draft--
Manuscript Number: PHYTOCHEM-D-22-00163
Article Type: Full Length Article
Section/Category: Ecological Biochemistry and Chemistry (Full Length Article)
Keywords: Plant pigment composition; Chlorophyll derivatives; Carotenoid derivatives;
Deciduous tree leaves; Sequential extraction; HPLC-DAD
Abstract: Leaf pigments, including chlorophylls and carotenoids, are important biochemical indicators of plant photosynthesis and photoprotection.
In this study, we developed, optimized, and validated a sequential extraction and liquid chromatography-diode array detection method allowing for the simultaneous
quantification of the main photosynthetic pigments, including chlorophyll a, chlorophyll b, β- carotene, and the characterization of plant pigment derivatives. Chromatographic separation was accomplished with the newest generation of core-shell columns revealing numerous pigment derivatives. The sequential extraction allowed for a better recovery of the main pigments (+25 % chlorophyll a, +30 % chlorophyll b, +42 %, β- carotene), and the characterization of ca. 5.3 times more pigment derivatives (i.e., up to 60 chlorophyll and carotenoids derivatives) than with a single step extraction. A broad working range of concentrations (300 - 2000 ng/mL) was achieved for most pigments and their derivatives and the limit of detection was generally as low as few nanograms per millilitre. The method also showed adequate trueness (RSD<1%) and intermediate precision (RSD<5%).
The method was developed and validated with willow and spinach leaves and their extracts and The method was successfully performed on leaf pigment extracts of four other European deciduous tree species. Within a case study using Fagus sylvatica L.
leaves, pigment derivatives revealed a high within-individual tree variability throughout the growing season that could not be detected using the main photosynthetic pigments alone, eventually showing that the method allowed for the monitoring of pigment dynamics at unprecedented detail.
Highlight 1: Sequential extraction reveals a wide range of photosynthetic pigments.
Highlight 2: The HPLC method resolves chlorophyll a, b, and chlorophyll derivatives.
Highlight 3: The HPLC method resolves α-, β- carotene, and carotenoids derivatives.
Highlight 4: Leaf pigment derivatives provide new insights into intraspecific variation.
Highlights
10 20 30 40 50 10 15 20 25 30
10 20 30 40 50 10 15 20 25 30
chl a
chl b
Absorbance (-)
a chls & xan chls car
chls car & xan unknowns
b
Absorbance (-)
Retention time (min) c
Retention time (min) d
Carotenoids and derivatives
Chlorophylls and derivatives Graphical Abstract
Characterization of complex photosynthetic pigment profiles in
1
European deciduous tree leaves by sequential extraction and
2
reversed-phase high performance liquid chromatography.
3
Fanny Petibona, Guido L.B. Wiesenberga 4
a. Department of Geography, University of Zurich, Winterthurerstrasse 190, CH-8057 Zürich, 5
Switzerland 6
Corresponding author: Fanny Petibon ([email protected]) 9
Department of Geography, University of Zurich, Winterthurerstrasse 190, CH-8057 Zurich, 10
Switzerland. Tel.: +41 446 355166.
11
E-mail address: [email protected] 12
Manuscript File
1 2 3 4 5 6 7 8 9 10 11 12 13 14 15 16 17 18 19 20 21 22 23 24 25 26 27 28 29 30 31 32 33 34 35 36 37 38 39 40 41 42 43 44 45 46 47 48 49 50 51 52 53 54 55 56 57 58 59 60
Highlights
13
Highlight 1: Sequential extraction reveals a wide range of photosynthetic pigments.
14
Highlight 2: The HPLC method resolves chlorophyll a, b, and chlorophyll derivatives.
15
Highlight 3: The HPLC method resolves α-, β- carotene, and carotenoids derivatives.
16
Highlight 4: Leaf pigment derivatives provide new insights into intraspecific variation.
17 1 2 3 4 5 6 7 8 9 10 11 12 13 14 15 16 17 18 19 20 21 22 23 24 25 26 27 28 29 30 31 32 33 34 35 36 37 38 39 40 41 42 43 44 45 46 47 48 49 50 51 52 53 54 55 56 57 58 59 60
Abstract
18
Leaf pigments, including chlorophylls and carotenoids, are important biochemical indicators of plant 19
photosynthesis and photoprotection.
20
In this study, we developed, optimized, and validated a sequential extraction and liquid 21
chromatography-diode array detection method allowing for the simultaneous quantification of the 22
main photosynthetic pigments, including chlorophyll a, chlorophyll b, β- carotene, and the 23
characterization of plant pigment derivatives. Chromatographic separation was accomplished with 24
the newest generation of core-shell columns revealing numerous pigment derivatives. The 25
sequential extraction allowed for a better recovery of the main pigments (+25 % chlorophyll a, +30 % 26
chlorophyll b, +42 %, β- carotene), and the characterization of ca. 5.3 times more pigment 27
derivatives (i.e., up to 60 chlorophyll and carotenoids derivatives) than with a single step extraction.
28
A broad working range of concentrations (300 - 2000 ng/mL) was achieved for most pigments and 29
their derivatives and the limit of detection was generally as low as few nanograms per millilitre. The 30
method also showed adequate trueness (RSD<1%) and intermediate precision (RSD<5%).
31
The method was developed and validated with willow and spinach leaves and their extracts and The 32
method was successfully performed on leaf pigment extracts of four other European deciduous tree 33
species. Within a case study using Fagus sylvatica L. leaves, pigment derivatives revealed a high 34
within-individual tree variability throughout the growing season that could not be detected using the 35
main photosynthetic pigments alone, eventually showing that the method allowed for the 36
monitoring of pigment dynamics at unprecedented detail.
37 1 2 3 4 5 6 7 8 9 10 11 12 13 14 15 16 17 18 19 20 21 22 23 24 25 26 27 28 29 30 31 32 33 34 35 36 37 38 39 40 41 42 43 44 45 46 47 48 49 50 51 52 53 54 55 56 57 58 59 60
Keywords
38
Plant pigment composition 39
Chlorophyll derivatives 40
Carotenoid derivatives 41
Deciduous tree leaves 42
Sequential extraction 43
Untargeted chromatography-optical detection 44
1 2 3 4 5 6 7 8 9 10 11 12 13 14 15 16 17 18 19 20 21 22 23 24 25 26 27 28 29 30 31 32 33 34 35 36 37 38 39 40 41 42 43 44 45 46 47 48 49 50 51 52 53 54 55 56 57 58 59 60
1. Introduction
45
Chlorophylls and carotenoids are the most widespread and abundant plant leaf pigment families, 46
and fulfil vital physiological functions, including photosynthesis, and photoprotection. Changes in 47
chlorophyll and carotenoid composition have been observed within tree leaves across a light canopy 48
gradient [1], and season [2,3] as well as in response to a variety of biotic [4] and abiotic stress [5], 49
including heatwave and drought [6,7], UV-B [8–10], elevated CO2 and O3 [11–13], revealing the 50
performance and acclimation capacity of the plant photosynthetic apparatus.
51
These pigment responses to environmental impacts are typically investigated by measuring the 52
optical properties of leaf chlorophylls and carotenoids that are related to their chemical structure.
53
Chlorophylls (chls) are photosynthetic tetrapyroles, whose absorption spectra reflect the presence 54
or absence of a central metal and the nature of substituents [14]. Chlorophyll a (chl a) which is the 55
most abundant form of chlorophyll in terrestrial plants presents two absorption maxima at 430 nm 56
and 664 nm in acetone-water (90:10, v/v) [15]. Chlorophyll b (chl b), which differs from chl a by one 57
aldehydic group substituent, presents two absorption maxima at 460 nm and 647 nm in acetone- 58
water (90:10, v/v) (Appendix A.1a-b) [15]. All other chlorophylls that have similar absorption 59
maxima and can be clearly separated by chromatographic methods are hereafter referred to as 60
chlorophyll derivatives (chl dev). Carotenoids, or tetraterpernoids, are categorized into two 61
compound classes: carotenes, and xanthophylls. Carotenes are tetraterpenes counting two primary 62
isomers, α-carotene (α-car), and β-carotene (β-car) (Appendix A.1c-d). Xanthophylls are oxygenated 63
tetraterpene derivatives (Appendix A.1e-h). Up to seven hundred carotenoids have been found to 64
naturally occur in the terrestrial plant kingdom[16]. Among them, five xanthophylls are found in all 65
green plants with few exceptions: lutein (lut), neoxanthin (neo), violaxanthin (vio), antheraxanthin 66
(ant), and zeaxanthin (zea). lut and neo act as anion scavenger, while vio, ant, and zea form the 67
xanthophyll cycle (VAZ). Nonubiquitous carotenoids are hereafter referred to as carotenoid 68
1 2 3 4 5 6 7 8 9 10 11 12 13 14 15 16 17 18 19 20 21 22 23 24 25 26 27 28 29 30 31 32 33 34 35 36 37 38 39 40 41 42 43 44 45 46 47 48 49 50 51 52 53 54 55 56 57 58 59 60
derivatives (car dev). All carotenoids are characterized by absorption maxima ranging from 400 to 69
550nm [15].
70
Leaf chlorophylls and carotenoids have been characterized through a variety of methods taking 71
advantage of their optical properties. This includes in-situ optical measurements of leaves using a 72
plant probe coupled with a field spectroradiometer [17], light absorption by bulk pigment extracts 73
using a spectrophotometer [15], and light absorption of individual pigments separated with a liquid 74
chromatography coupled with an optical detector. Approaches using liquid chromatography were 75
first developed early 1980s [18]. Development of C18 and C30 chromatographic columns have enabled 76
the identification of an increasing number of carotenoids [19] as well as the separation of 77
structurally similar carotenoid isomers (e.g., lut and zea [20], α-car and β-car [21], astaxanthin and 78
phytoene isomers [22]). Simultaneous characterization of chlorophylls and carotenoids were 79
successively applied to higher plant tissues [23]. Most of those methods however target a selected 80
number of the most abundant pigments (i.e., chl a, chl b, α-car, β-car, lut, neo, VAZ). Esteban and al.
81
[5] showed in a meta-analysis that chl a+b concentrations are constrained between 1.2 - 15.6 82
µmol.g-1d.w. (in ca. 800 green plant species) and that pigment ratios (e.g., chl a:chl b, β-car:chls, 83
neo:chls) show little to no responsiveness to varying environmental conditions. Insight into the 84
functionality of the photosynthetic apparatus is thus limited by the concentration range and 85
responsiveness of targeted chlorophylls and carotenoids. A handful of studies tended to adopt a 86
metabolomic profiling approach to elucidate carotenoid profiles [24–27]. Among them, Wei et al.
87
[27] suggested that accounting for the entire pigment profile rather than the most abundant 88
pigments could better reflect physiological changes in seafood and provide a useful framework for 89
exploring mechanisms underlying pigment composition. However, to our knowledge no such 90
method is available for forest tree species.
91
A metabolomic profiling approach requires that the pigment extract is representative of the original 92
leaf pigment composition, and thus as less denaturised as possible. Yet, techniques that allow for 93
1 2 3 4 5 6 7 8 9 10 11 12 13 14 15 16 17 18 19 20 21 22 23 24 25 26 27 28 29 30 31 32 33 34 35 36 37 38 39 40 41 42 43 44 45 46 47 48 49 50 51 52 53 54 55 56 57 58 59 60
high purity by eliminating the lipid matrix also tend to eliminate chlorophylls and favour conjugated 94
carotenoid hydrolysis [28]. Also, simple extraction of fresh leaf discs either with methanol [29,30], 95
acetone [31–33] or a mixture of those with water [34] have so far been preferred in ecophysiological 96
studies to avoid alteration of the pigment composition (Appendix. A.2). However, the solubility and 97
thus the extractability of polar and apolar pigments may differ depending on the polarity of the 98
extraction solvents resulting in an incomplete and selective pigment extraction. In addition, the 99
absence of pre-treatments may allow for the extraction of the extractable fraction but not bound 100
pigments. While heat treatments are to be excluded due to the pigment denaturation sensitivity to 101
ambient and hot temperatures, low temperature pre-treatments (e.g., freeze-drying) offer 102
promising alternatives to enhance pigment extractability.
103
To date, there is thus a lack of methods investigating complex leaf pigment profiles and ensuring a 104
minimum degradation of the pigments at each step of the preparation and characterization 105
procedure. Therefore, in this study, we develop a method including the sample preparation and 106
extraction and the chromatographic characterisation of the pigment extract. We show the benefits 107
of the optimized and validated method to a standardized procedure commonly reported in the 108
literature. We ask whether low temperature pre-treatment and a sequential extraction with a 109
solvent polarity gradient allows for the recovery of a broader and more representative range of plant 110
leaf pigments than a single step extraction. We further hypothesize that the metabolic profiling 111
approach accounting for low abundance pigments provides relevant information on plant physiology 112
that complement what we traditionally learn from the dynamics of the most abundant pigments.
113 1 2 3 4 5 6 7 8 9 10 11 12 13 14 15 16 17 18 19 20 21 22 23 24 25 26 27 28 29 30 31 32 33 34 35 36 37 38 39 40 41 42 43 44 45 46 47 48 49 50 51 52 53 54 55 56 57 58 59 60
2. Material and methods
114
2.1. Materials
115
2.1.1. Standards and reagents 116
Chlorophyll a (≤95 %), chlorophyll b (≤95%), β-carotene (≤95%), lutein (≤95%) were purchased from 117
Sigma Aldrich (Steinheim, Germany). Standards were prepared in different solvents according to 118
their solubility and stability and later stored in amber vials in a deep freezer at -80°C.
119
Extraction solvents, acetone (≤99.9%, Carl Roth, Karlsruhe, Germany), isopropanol (≤99.9%, Sigma- 120
Aldrich, Steinheim, Germany), and n-hexane (≤95%, Carl Roth, Karlsruhe, Germany), were GC 121
Ultragrade. Eluents, ethyl acetate (≤99.8%, Merck, Darmstadt, Germany), and methanol (99.9%, Carl 122
Roth, Karlsruhe, Germany), were Hypergrade LC-MS. Water was deionised to >18.2 M Ω/cm 123
resistance, using a Milli-Q® Advantage A10 water purification system (Merck, Darmstadt, Germany).
124
Acetic acid (≤60%, Carl Roth, Karlsruhe, Germany) and formic acid (85%, Sigma-Aldrich, Steinheim, 125
Germany) were used as buffers. High performance liquid chromatography (HPLC) eluents were 126
filtered on glass microfiber filters (Whatman® GF6, Sigma Aldrich, Steinheim, Germany) before use.
127
2.1.2. Leaf samples 128
Frozen spinach leaves were bought in the local supermarket.
129
Leaf samples of willow (Salix alba L.) were collected along two pre-alpine rivers (46°45’ N 7°7’ W;
130
46◦44’ N, 7°18’ W) in the region of Fribourg in Switzerland, in 2016 [35]. The spinach and willow 131
samples were used for the development and validation of the sample preparation, extraction and 132
liquid chromatography method.
133
Leaf samples of beech (Fagus sylvatica L.), maple (Acer pseudoplatanus L.), lime (Tilia cordata Mill.), 134
and hornbeam (Carpinus betulus L.) were collected on mature trees located on the campus of the 135
University of Zurich (47°40’ N, 8°55’ E) at four different times during the growing season 2018. Three 136
1 2 3 4 5 6 7 8 9 10 11 12 13 14 15 16 17 18 19 20 21 22 23 24 25 26 27 28 29 30 31 32 33 34 35 36 37 38 39 40 41 42 43 44 45 46 47 48 49 50 51 52 53 54 55 56 57 58 59 60
The purity of standards and reagents is wrong!
leaf replicates were collected at different sampling heights (3, 6, 12 m) and under various light 137
exposures (sun vs. shade). Immediately after sampling, branches were stored in black plastic bags 138
and stored in polystyrene containers filled with dry ice and transported to a deep freezer at -80°C 139
within an hour. These samples were used to demonstrate the applicability of the method on a wide 140
range of samples and the potential of the method to assess intraspecific variation.
141
2.2. Methods
142
2.2.1. Sample preparation 143
Within 3 hours after the sampling, fresh leaves were individually weighed on an analytical scale 144
(0.01mg, Satorius Cubis®, Germany) to determine the moist weight. Three leaves of the same knot 145
or close from each other were stored at -80°C and analysed together, except for the leaves of Acer 146
pseudoplatanus L. that were analysed individually. Two replicates per branch were prepared. Latest 147
one week after sampling, each replicate was freeze-dried overnight (Freeze-dryer Alpha 2-4 LD plus, 148
Christ, Germany). Dry weight of the individual leaves was measured on an analytical scale before the 149
leaves were manually ground in liquid nitrogen with a mortar and pestle.
150
2.2.2. Leaf extraction 151
Pigments were extracted following a sequential extraction procedure using acetone:water (90:10, 152
v/v), pure acetone, and isopropanol:n-hexane (50:50, v/v). Solvents were kept in the freezer at - 153
20°C. Only small volumes of solvent were taken out of the fridge and solvent bottles immediately 154
returned after use. This ensured that pigment extraction was performed below 0°C to prevent 155
pigment degradation. All steps were performed under subdued light. Fraction 1 was obtained by 156
adding 1 mL of acetone:water directly in the vial containing 20 mg of leaf powder. The solution was 157
agitated using a vortex stirrer and left for 1 min, before being filtered on a 1 μm glass-fibre filter 158
(Macherey-Nagel, Germany) and transferred to a 10 mL amber vial kept cooled in ice. This step was 159
repeated with 1 mL of acetone:water two additional times. The same procedure was repeated with 160
pure acetone and isopropanol:n-hexane (50:50, v/v) and the extract was combined in the same vial.
161 1 2 3 4 5 6 7 8 9 10 11 12 13 14 15 16 17 18 19 20 21 22 23 24 25 26 27 28 29 30 31 32 33 34 35 36 37 38 39 40 41 42 43 44 45 46 47 48 49 50 51 52 53 54 55 56 57 58 59 60
The eluate was concentrated under vacuum using a concentrator plus (Vaudaux-Eppendorf, 162
Switzerland), before being transferred to an amber 2 mL vial and redissolved in 250 μL acetone 163
before chromatographic analysis.
164
2.2.3. Chromatographic separation 165
Chromatographic separation of pigments was carried out with an Agilent 1290 Infinity UHPLC system 166
(Santa Clara, U.S.A) comprised of a binary pump (Agilent G4220A), an autosampler (Agilent G4226A) 167
with thermostat set to 4°C (Agilent G1330B), a column oven, and a diode array detector (DAD, 168
Agilent VL+ G1315C). The column oven was equipped with one Agilent Poroshell 120 SB-C18 in series 169
(150mm) with a particle size of 2.7µm and maintained at 10°C to prevent pigment degradation 170
during the chromatographic separation. 15μL of standards and samples were injected at a flow rate 171
of 0.5mL/min, which was kept constant during the analyses. Mobile phase A consisted of purified 172
water buffered with formic acid (98.5:1.5, v/v) to a pH value of 2.5. Mobile phase B consisted of 173
methanol:ethyl acetate (68:32, v/v).
174
Mobile phase composition, pH and gradient elution were optimized with a full factorial design of 175
experiment assessing the pH of eluent A, the composition of eluent B, the initial composition of the 176
mobile phase and the solvent gradient (Appendix B.4). The optimized chromatographic separation 177
had a total run time of 54min. The initial gradient elution yielded 80% eluent B (v/v). After 5 178
minutes, the proportion of eluent B in the mobile phase linearly increased to 100% with a ramp of 179
5%/min. The mobile phase composition was kept constant for 20 min. Re-equilibration time was 15 180
min between individual measurements.
181
2..2.4 Compound identification and quantification 182
Compound detection was ensured by a DAD detector at 450 nm for carotenoids and 665 nm for 183
chlorophylls with a split width of 8 nm. The peak integration was performed with the Agilent 184
OpenLAB CDS ChemStation software. Peak identification of main chlorophylls and carotenoids (chl a, 185
chl b, β-car and lut) was based on the retention time and absorption spectra of the analytical 186
1 2 3 4 5 6 7 8 9 10 11 12 13 14 15 16 17 18 19 20 21 22 23 24 25 26 27 28 29 30 31 32 33 34 35 36 37 38 39 40 41 42 43 44 45 46 47 48 49 50 51 52 53 54 55 56 57 58 59 60
standards. Other compound peaks were categorized as chlorophyll and carotenoid derivatives based 187
on a decision tree and the absorption spectra (Appendix B.1). In case of mixed spectra due to co- 188
elution or a low signal-to-noise ratio that did not allow for the attribution of the absorption 189
spectrum to either chlorophyll or carotenoid derivatives, the compound peaks were labelled as 190
unknown derivatives.
191
Quantification was based on compound peak areas. Calibration curves from two analytical standards 192
of chl a and β-car were used to quantify all compounds categorized as chlorophylls and carotenoids 193
(Appendix B.2). The concentrations ranged from 0.3 to 200 μg/mL. The pigment concentration was 194
normalized per dry leaf weight (mg/g). The peak areas of all unknown derivatives were summed and 195
considered as one contribution.
196
2.2.5. Statistical evaluation 197
The statistical evaluation was performed with R studio software [36], with the packages FrF2, 198
DoE.base, DoE.wrapper for the design of experiment and tidyverse, dplyr, ggplot2 for other analyses.
199
2.2.6. Method validation 200
To validate the sample preparation procedure, we verified that freeze-drying and manual milling did 201
not alter the pigment composition and recovery. We first compared the pigment composition 202
obtained from frozen willow and spinach leaf extracts and freeze-dried extracts of the same leaf 203
samples. We then compared the effect of automatic milling, manual milling with liquid nitrogen to 204
no milling on pigment composition and recovery. The same ground leaf sample was used to test all 205
preparation procedures. Three analytical replicates were prepared. We applied a one-way ANOVA 206
test on the total pigment concentration and on chl a, chl b and car concentrations to assess the 207
recovery and on the number of detected peaks and chl a:chl b and chl a:chl dev ratios to validate the 208
composition.
209 1 2 3 4 5 6 7 8 9 10 11 12 13 14 15 16 17 18 19 20 21 22 23 24 25 26 27 28 29 30 31 32 33 34 35 36 37 38 39 40 41 42 43 44 45 46 47 48 49 50 51 52 53 54 55 56 57 58 59 60
The extraction procedure was validated on a selection of five samples of willow and spinach leaves.
210
The extracts obtained after each solvent were collected in separate vials, separately analysed, and 211
compared to the corresponding extract of the control procedure. In the control procedure, the same 212
samples were extracted using a unique solvent mixture of acetone: water (90:10, v/v) for all three 213
fractions. We looked at the absence/presence of compound peaks and applied a t-test to compare 214
the overall and individual fraction yields. Repeatability was tested on five analytical replicates.
215
The validation of the chromatographic separation was performed according to the 216
recommendations of Raposo and Ibelli-Bianco [37] and Stöckl et al [38]. We tested five performance 217
parameters listed in Table 1 [39,40]. The selectivity was determined for the main pigments chl a, chl 218
b, and car by calculated the selectivity factor between the main pigments and the neighbouring 219
peaks. The application range was defined based on the calibration curve including six concentrations 220
measured in two replicates over two days (1r x 2d) and validated with an ANOVA lack-of-fit test [38].
221
A calibration curve was established for each individual analytical standard of chl a, chl b, and β-car, 222
dissolved in pure acetone (Appendix B.2). The accuracy was defined as the total error including the 223
precision (random error) and the trueness (systematic error). The intra-day and inter-day precision 224
were assessed by measuring a spinach and beech extract twice a day during five consecutive days.
225
The trueness was measured at the concentrations of chl a standard for three replicates with an 226
acceptance criterion of < 5%. The limit of detection (LOD) and limit of quantification (LOQ) were set 227
at a signal-to-noise ratio of 3 and 6, respectively [38,40].
228
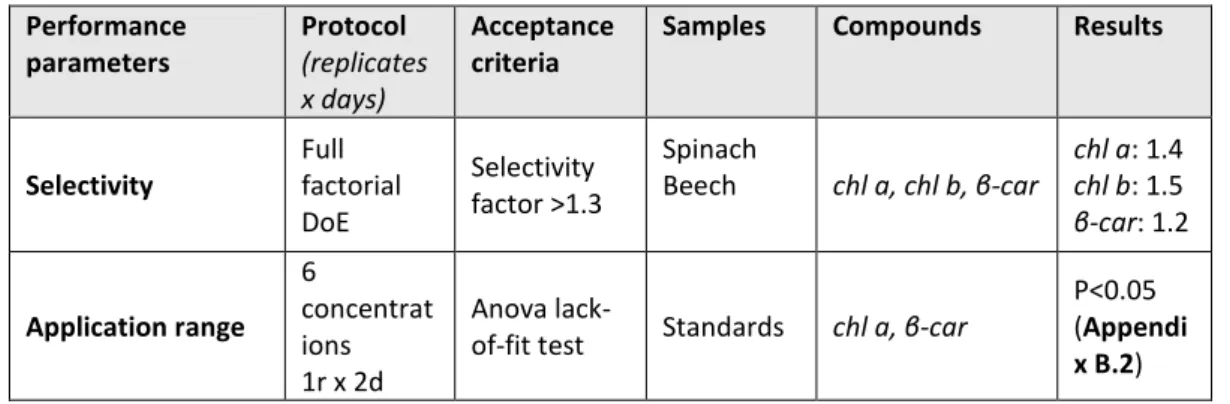
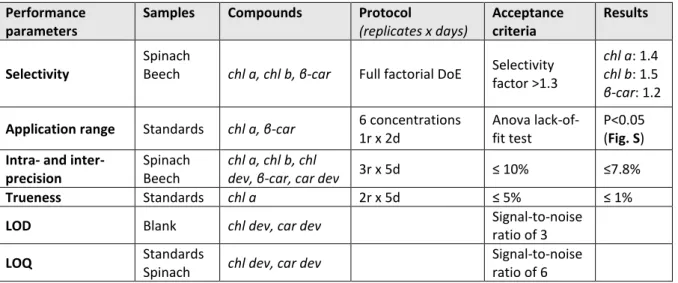
Table 1: Tested performance parameters of the chromatographic separation.
229
Performance parameters
Protocol (replicates x days)
Acceptance criteria
Samples Compounds Results
Selectivity
Full factorial DoE
Selectivity factor >1.3
Spinach
Beech chl a, chl b, β-car
chl a: 1.4 chl b: 1.5 β-car: 1.2
Application range 6
concentrat ions 1r x 2d
Anova lack-
of-fit test Standards chl a, β-car
P<0.05 (Appendi x B.2) 1
2 3 4 5 6 7 8 9 10 11 12 13 14 15 16 17 18 19 20 21 22 23 24 25 26 27 28 29 30 31 32 33 34 35 36 37 38 39 40 41 42 43 44 45 46 47 48 49 50 51 52 53 54 55 56 57 58 59 60
Intra- and inter-
precision 3r x 5d ≤ 10% Spinach
Beech
chl a, chl b, chl dev, β-car , car dev
≤7.8%
Trueness 2r x 5d ≤ 5% Standards chl a ≤ 1%
LOD none
Signal-to- noise ratio of 3
Blank chl dev, car dev
LOQ none
Signal-to- noise ratio of 6
Standards
Spinach chl dev, car dev
3. Results & Discussion
230
3.1. Method development & validation
231
3.1.1. Sample preparation 232
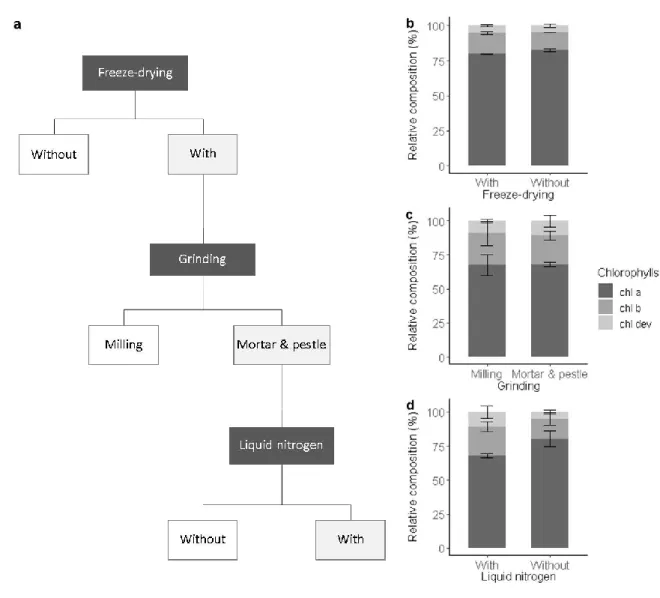
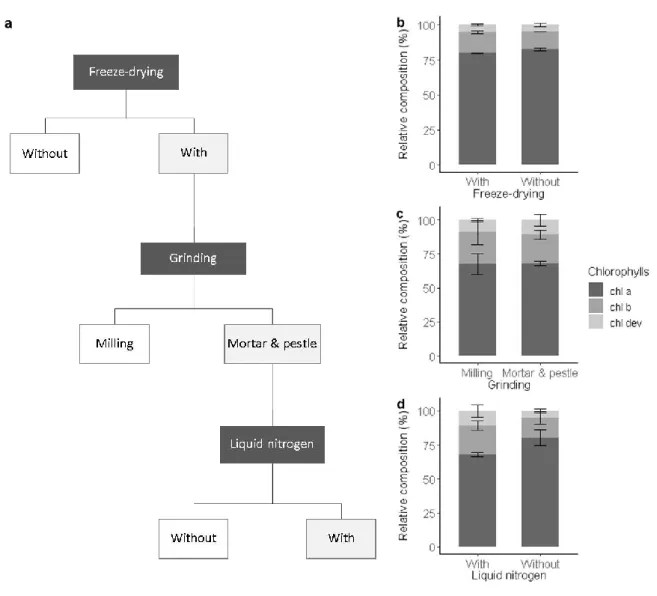
We tested the influence of the preparation steps, i.e., freeze-drying and grinding, on the extraction 233
yield and the relative pigment composition (Fig. 1a).
234
Freeze-drying was carried out to remove the presence of moisture in leaf samples that could 235
promote pigment denaturation and degradation during storage [41,42]. Freeze-drying tended to 236
increase the extraction yield, though not significantly (ANOVA, F1,4=4.53, p = 0.167). The sublimation 237
of frozen water crystals under vacuum contribute to break cell walls and membranes, facilitating 238
solvent accessibility and the release of pigments from the protein matrix [41]. In this sense, higher 239
concentrations of chl a and chl b in freeze-dried extracts than in fresh frozen extracts of mint leaves 240
were found [43]. However, the opposite was also observed in extracts of algae [44]. Also, our result 241
confirmed that the effect of freeze-drying on the extraction yield is species-specific and depends on 242
the leaf structure and composition. Among drying procedures, freeze-drying is known to best 243
preserve pigments [41]. This was verified for our leaf samples, whose pigment composition was 244
statistically identical among fresh frozen and freeze-dried leaf extracts (ANOVA, F1,4=2, p>0.1) (Fig.
245
1b). Nonetheless, freeze-drying increases sample porosity and thus higher surfaces are potentially 246
exposed to oxygen oxidation and moisture reabsorption than in fresh frozen leaves [45]. Besides, 247
pigments released from the protein matrix may be more sensitive to heat, photochemical, and 248
1 2 3 4 5 6 7 8 9 10 11 12 13 14 15 16 17 18 19 20 21 22 23 24 25 26 27 28 29 30 31 32 33 34 35 36 37 38 39 40 41 42 43 44 45 46 47 48 49 50 51 52 53 54 55 56 57 58 59 60
enzymatic degradation [41,46]. Also, to prevent any pigment degradation, freeze-dried leaf samples 249
were stored in sealed black bags at –80°C and later handled under subdued light and below 0°C.
250
Freeze-dried leaf samples were ground to further break the cell walls and membranes, facilitate 251
solvent accessibility and eventually improve the pigment extraction yield in comparison to the one 252
obtained from commonly non-ground fresh leaf discs [1,7,47]. The use of a mill ball or a mortar and 253
pestle to grind the leaf samples led to similar extraction yield and relative pigment composition 254
(ANOVA, F1,4 =3, p>0.1) (Fig. 1c). Automatic milling using, e.g., ball mills, is widely used to produce 255
homogeneous leaf sample powder. However, the repeated friction of the sample with the ball of a 256
horizontal mill may heat the sample and alter its composition, if the milling device cannot be cooled 257
or the duration of the milling process is too long [48]. In this study, the settings of the ball mill were 258
chosen to prevent degradation due to over-heating as evidenced by the pigment composition that is 259
comparable to the one obtained after manual grinding with liquid nitrogen (Fig. 1c). However, more 260
material was lost on the wall of the beaker of the ball mill than within the mortar. As in addition the 261
cleaning of the beaker of the ball mill (necessary to avoid contamination) was more time consuming 262
than the one of the mortar and pestle, manual grinding was preferred. The use of a mortar and 263
pestle with liquid nitrogen resulted in a finer and more homogenous powder than without liquid 264
nitrogen or with a ball mill, as also shown by Gomes et al. (see [49]). This eventually improved the 265
extraction of chl dev (ANOVA, F1,4 =4.8, p = 0.093) and decreased the relative contribution of chl a 266
(ANOVA, F1,4=13.9, p = 0.022) (Fig. 1d). As manual grinding was performed under subdued light with 267
liquid nitrogen, i.e., at below 0°C, we are confident that the greater proportion of chl dev 268
corresponds to the better extraction of low abundant pigment compounds using liquid nitrogen and 269
not denaturised pigments resulting from potential preparation artefacts [46].
270 1 2 3 4 5 6 7 8 9 10 11 12 13 14 15 16 17 18 19 20 21 22 23 24 25 26 27 28 29 30 31 32 33 34 35 36 37 38 39 40 41 42 43 44 45 46 47 48 49 50 51 52 53 54 55 56 57 58 59 60
271
Fig. 1 Sample preparation procedure and its impact on the chlorophyll composition. (a) Selected 272
preparation steps (light grey boxes) and the relative composition of chlorophylls including chl a (dark 273
grey), chl b (grey), and chl dev (light grey) associated with (a) freeze drying, (b) grinding, (c) with or 274
without liquid nitrogen. Error bars correspond to the standard deviation (n=3).
275 276 1 2 3 4 5 6 7 8 9 10 11 12 13 14 15 16 17 18 19 20 21 22 23 24 25 26 27 28 29 30 31 32 33 34 35 36 37 38 39 40 41 42 43 44 45 46 47 48 49 50 51 52 53 54 55 56 57 58 59 60
3.1.2. Extraction 277
On average, the sequential extraction with a solvent polarity gradient allowed for the extraction of 278
three times more compounds (Fig. 2a-d) than using acetone: water (90:10, v/v) as unique solvent 279
(Fig. 2a-b). Up to 61 chromatographically resolved pigment compounds, including 22 chlorophylls, 25 280
carotenoids and 14 unknown compounds resulted from the sequential extraction of beech leaves 281
(Appendix C.1). Apart from 10 compounds found only in fraction 1 (acetone: water), all observed 282
compounds were present in fraction 2 (pure acetone). The last extraction step (isopropanol: n- 283
hexane) improved on average by 16 ± 6% (SD) the extraction yield of compounds present in all 284
fractions (n= 25 compounds) and by 29 ± 7% the extraction of apolar compounds found in fraction 2 285
and 3 only (n=6 compounds). The extraction yield achieved by a sequential extraction with the 286
solvent polarity gradient was on average 40% greater than with a repeated extraction using acetone:
287
water (90:10 v/v) as unique solvent. Individual fractions respectively contribute 33 % (Fraction 1), 58 288
% (Fraction 2), and 9% (Fraction 3) to the extraction yield of the sequential extraction with the 289
chosen solvent polarity gradient. Fractions 2 and 3 contribute to 25, 30 and 42 % of the extraction 290
yield of chl a, chl b, and β-car, respectively.
291
Aqueous and pure acetone have been equally used and preferred amongst other solvents such as 292
ethanol, dimethylformamide and dimethyl sulfoxide for the extraction of photosynthetic pigments of 293
leaf samples (Appendix A.2). Our results confirmed that aqueous and pure acetone allow for the 294
extraction of the main pigments (chl a, chl b, and car) enabling a fast screening of the pigment 295
profile. However, aqueous acetone and pure acetone did not perform equally at extracting pigment 296
derivatives. Pure acetone allowed for the extraction of most of the pigment derivatives.
297
Nevertheless, highly polar and apolar pigment compounds were not present in the acetone fraction.
298
Highly polar chlorophylls and carotenoids were best extracted with acetone: water (90:10, v/v), 299
despite the fact that lyophilized leaf samples were expected to have a better affinity with acetone 300
than aqueous acetone mixture [15]. Besides, the solubility of carotenoids in pure acetone decreases 301
with decreasing compound polarity, as well as the ability of acetone to break carotenoid-protein 302
1 2 3 4 5 6 7 8 9 10 11 12 13 14 15 16 17 18 19 20 21 22 23 24 25 26 27 28 29 30 31 32 33 34 35 36 37 38 39 40 41 42 43 44 45 46 47 48 49 50 51 52 53 54 55 56 57 58 59 60
complexes [28]. As highlighted by Simonoska et al. [28], the ability of the solvent to break down 303
pigment-protein complexes matters more for the extraction efficiency than for the solubility of the 304
compounds in the solvent mixture, especially if the concentration of pigments in the leaf sample is 305
low. Extended extraction times were commonly described in literature (up to 48 hours) to 306
compensate the weak extraction power of acetone but only the most abundant pigments were 307
targeted [34,46]. Besides, pigment recovery and composition was shown to differ among extraction 308
solvents, with an extraction carried for 12 hours at 4°C, the enzyme chlorophyllase was shown to 309
catalyse the degradation of chls into chlorophyllides in aqueous acetone but not in pure acetone 310
[46]. Those observations validated our first hypothesis that a single extraction with (aqueous or 311
pure) acetone led to a biased representation of the leaf pigment profile due to the polarity of the 312
extraction solvent and its interaction with the leaf constituents that potentially lead to extraction 313
artefacts. Frequently used methods might thus not be able to reliably characterize the majority of 314
the pigment profile. The presented method relied on sequential extraction with a solvent polarity 315
gradient. By gradually decreasing the polarity of the solvent, we succeeded in extracting apolar 316
pigment derivatives and significantly increased the extraction yield of all compounds. Isopropanol: n- 317
hexane showed a greater ability to extract compounds embedded in pigment-protein complexes 318
than acetone, which enabled to extract a wide range of pigments in a short time period. The short 319
extraction time and temperatures below 0°C help in addition to prevent pigment denaturation 320
resulting into a more genuine leaf pigment profile.
321 1 2 3 4 5 6 7 8 9 10 11 12 13 14 15 16 17 18 19 20 21 22 23 24 25 26 27 28 29 30 31 32 33 34 35 36 37 38 39 40 41 42 43 44 45 46 47 48 49 50 51 52 53 54 55 56 57 58 59 60
322
Fig. 2 Relative abundance of chlorophylls (chl a, chl b, chl dev) and carotenoids (β-car, car 323
dev, xan dev) in each fraction of the sequential extraction (a), and corresponding chromatogram at 324
665nm (b, fraction 1 (extracted with acetone: water); c, fraction 2 (extracted with pure acetone); d, 325
fraction 3 (extracted with isopropanol: n-hexane)). The sum of the three fractions equals 100%.
326
18 20 22
Fraction 1 Fraction 2 Fraction 3 0
10 20 30 40 50 60
Relative abudance (%)
Sequential extraction b-car car dev chl a chl b chl dev a.
Absorbance (-)
b. Fraction 1
Absorbance (-)
Time d. Fraction 3
Absorbance (-)
c. Fraction 2
Time
1 2 3 4 5 6 7 8 9 10 11 12 13 14 15 16 17 18 19 20 21 22 23 24 25 26 27 28 29 30 31 32 33 34 35 36 37 38 39 40 41 42 43 44 45 46 47 48 49 50 51 52 53 54 55 56 57 58 59 60
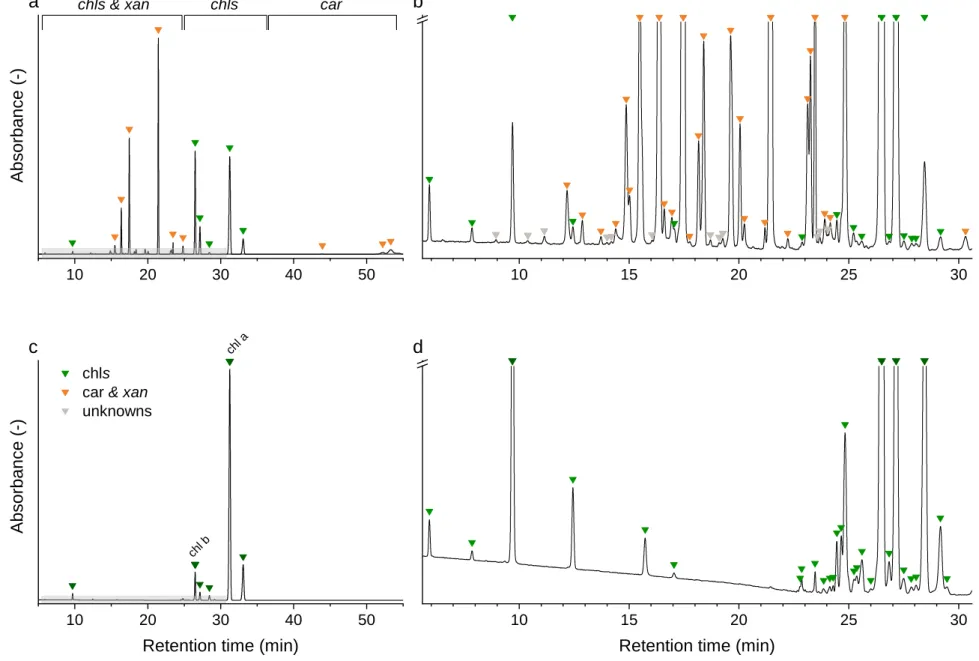
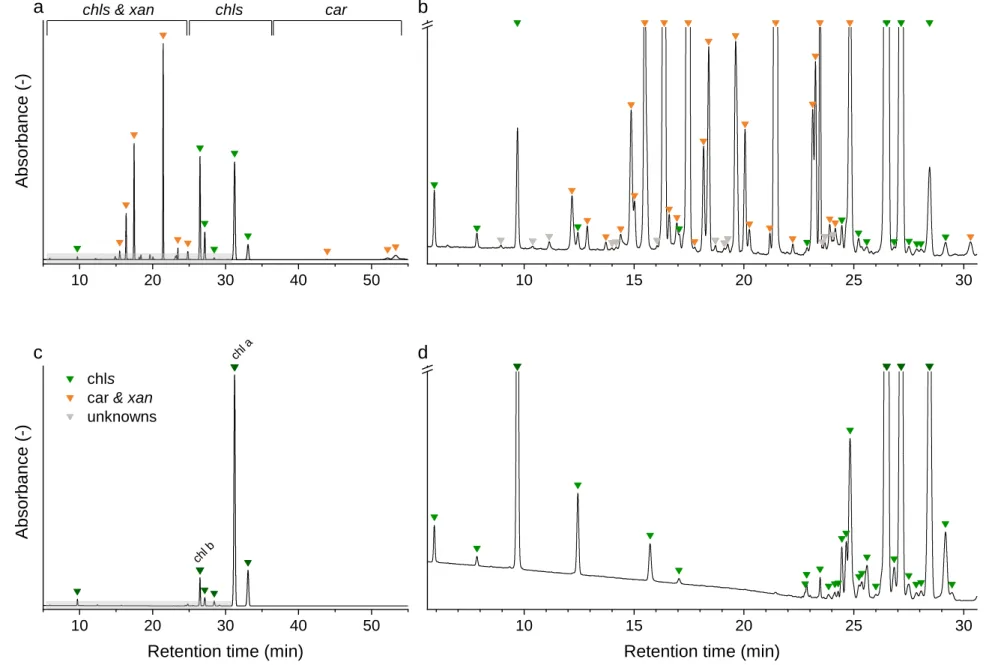
3.1.3. Chromatography 327
Chromatographic separation of the main pigments chl a, chl b, and car, and related pigment 328
derivatives that are partially present in low abundance was achieved within 54 min (Fig. 3). Pigment 329
derivatives represented on average 95 % of the detected peaks but less than 34 % of the integrated 330
peak area counts. Up to 68 chromatographically resolved pigments, including 28 chlorophylls, 28 331
carotenoids and 12 unknown pigments resulted from the sequential extraction of spinach leaves 332
(Spinacia oleracae) (Fig. 3). We obtained similar chromatograms for deciduous tree species, 333
including beech (Fagus sylvatica L.), lime (Tilia cordata Mill.) and maple (Acer pseudoplatanus L.) 334
(Appendix C.2). In beech leaves, we characterized up to 61 pigments, including 22 chlorophylls, 25 335
carotenoids, and 14 unknown pigments (Appendix C.1). The pigment derivatives categorized as 336
unknown were either below the limit of identification or co-eluted with other compounds.
337
Nevertheless, the latter were few and a large number of photosynthetic pigments were successfully 338
categorized based on their absorption spectra (Appendix B.1). The number of categorized 339
compounds exceeded what was previously achieved in a similar time run for spinach (up to 26 340
pigments, [18,50–52]) or beech (chl a, chl b, and up to 11 car [23,53]). Low abundance pigment 341
derivatives were mostly neglected in previous methods. Highly concentrated extracts and the use of 342
a chromatographic column with a poroshell structure, which improved peak shape compared to 343
column packed with porous particles, contributed to increase the number of detected pigments.
344
The influence of four parameters, i.e., the pH of the eluent A, the polarity of the eluent B, the initial 345
eluent ratio, and the eluent gradient, on the chromatographic separation was assessed by carrying 346
out a full factorial experimental design (Appendix B.4). pH mostly affected the chromatographic 347
separation (<3, F1,11=5.185, p < 0.05). Acidic pH increased the number of detected peaks by reducing 348
co-elution and improving peak separation. However, chls degrade into pheophytins and car 349
isomerize more easily at acidic pH than at neutral and basic pH [54,55]. Nevertheless, pigment 350
denaturation is expected to happen slower at low temperatures [56]. To validate the optimum pH, 351
an analytical standard of chl a was run at different pH values; a pH of 3 allowed for the best 352
1 2 3 4 5 6 7 8 9 10 11 12 13 14 15 16 17 18 19 20 21 22 23 24 25 26 27 28 29 30 31 32 33 34 35 36 37 38 39 40 41 42 43 44 45 46 47 48 49 50 51 52 53 54 55 56 57 58 59 60
selectivity while limiting pigment denaturation. A pH comprised between 3 and 4 was also 353
considered as optimal to characterize chl dev as chlorophyllides and pheophytins. The solvent 354
gradient (F1,11=3.385, p=0.1) and to a lesser extent the composition of eluent B and its proportion in 355
the initial mobile phase (F1,11=2.032, p=0.182) also affected the chromatographic separation 356
(Appendix B.4). As most compounds appeared during the isocratic phase (100% of eluent B). The run 357
time was thus optimized by decreasing the polarity of the eluent B and increasing the proportion of 358
eluent B in the initial mobile phase.
359
Method validation was performed by evaluating the selectivity, application range, limits of detection 360
and quantification (LODs and LOQs), precision (inter- day and intra-day precision) and trueness for 361
the main pigments and pigment derivatives (Table 1). The main pigments (chl a, chl b, and car) as 362
well as some pigment derivatives presented a selectivity >1.3. Co-elution of some pigment 363
derivatives was still observed. However, it was considered sufficient for sample screening, as the low 364
abundance of co-eluted pigment derivatives made the identification challenging for individual 365
pigment derivatives that were eventually investigated as one group. The application range was 366
validated between 0.3 -2 µg/mL with an increasing residual error at low concentrations (Appendix 367
B.2). The intra- and inter-day precision and the trueness were respectively below the targeted 368
threshold. Also, with a large number of characterized pigments and acceptable precision for 369
ecophysiological studies, the developed method offers the opportunity to investigate the dynamics 370
of the main photosynthetic pigments and their derivatives.
371 1 2 3 4 5 6 7 8 9 10 11 12 13 14 15 16 17 18 19 20 21 22 23 24 25 26 27 28 29 30 31 32 33 34 35 36 37 38 39 40 41 42 43 44 45 46 47 48 49 50 51 52 53 54 55 56 57 58 59 60
372
Fig. 3 Chromatograms of a spinach sample at 450 nm (a, b) and at 665 nm (c, d). Individual compounds are listed in Appendix C.1.
373
10 20 30 40 50 10 15 20 25 30
10 20 30 40 50 10 15 20 25 30
chl a
chl b
Absorbance (-)
a chls & xan chls car
chls car & xan unknowns
b
Absorbance (-)
Retention time (min) c
Retention time (min) d
1 2 3 4 5 6 7 8 9 10 11 12 13 14 15 16 17 18 19 20 21 22 23 24 25 26 27 28 29 30 31 32 33 34 35 36 37 38 39 40 41 42 43 44 45 46 47 48 49 50 51 52 53 54 55 56 57 58 59 60
3.2. Application
374
To demonstrate the applicability of the proposed analytical method, we characterized the pigment 375
profile of leaves originating from one individual beech tree. As it is well known that the leaf pigment 376
composition changes during the growing season [1,3], we tested and validated our method on leaves 377
sampled in the early, middle, and late growing season. We compared the pigment concentration and 378
composition obtained after a single step and sequential extraction using always the optimized 379
chromatographic procedure. The concentration of total chlorophyll (chl tot) was respectively 380
comprised between 0.3 and 2.6 µg chl a eq. g-1 d.w., and 1.8 and 45.2 µg chl a eq./g-1 d.w. over the 381
course of the growing season. The sequential extraction increased on average by 10 times the 382
recovery in chl tot and by up to 40 times the recovery in chl dev compared to a single step extraction 383
(Appendix C.3). The range of concentrations of chl tot obtained with a single step extraction is 384
comparable to the concentrations in beech leaves reported in the literature using similar extraction 385
methods (Appendix A.2) [1,3,12,57] and fall into the expected range of concentrations (1.2 - 15.6 386
µmol.g-1d.w.) defined by Esteban et al. [5] in a meta-analysis including 809 plant species. The range 387
of concentrations obtained with a sequential extraction, however, exceeded this expected range of 388
concentrations but remained close to the concentration range (11.1 - 44 µmol.g-1d.w.) suggested by 389
Antal et al. [58]. The range of concentration consequently depends on the preparation and 390
extraction methods. The greater recovery of pigments and greater contribution of pigment 391
derivatives after a sequential extraction than a single extraction resulted in a wider range of 392
concentrations that helped to better capture seasonal dynamics and variation within the tree crown.
393
Variation of chl a and chl b within the crown was observed between sunlit and shade leaves [12] or 394
along a vertical canopy gradient [1,59] which brought new insight about the photosynthetic activity 395
of a tree. Similarly, chl a and chl b are used as proxy to investigate seasonal dynamics and leaf 396
senescence [3,23]. However, Esteban et al. [5] showed that chl a:chl b tended to vary over a 397
restricted range and showed little responsiveness to environmental stress such as drought and 398
ozone exposure. Here, we showed that chl dev concentration varied across the season and within 399
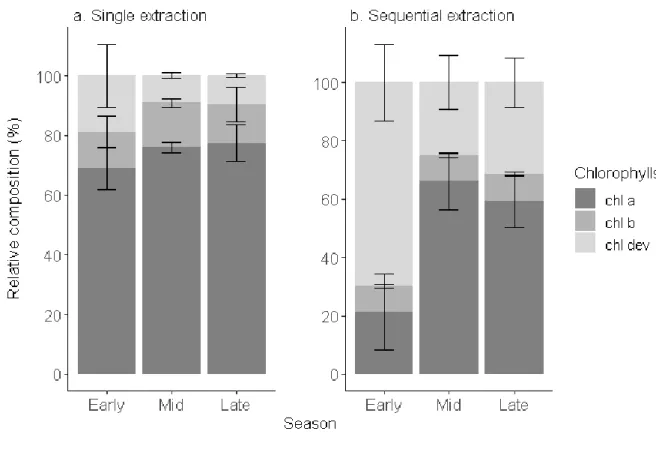
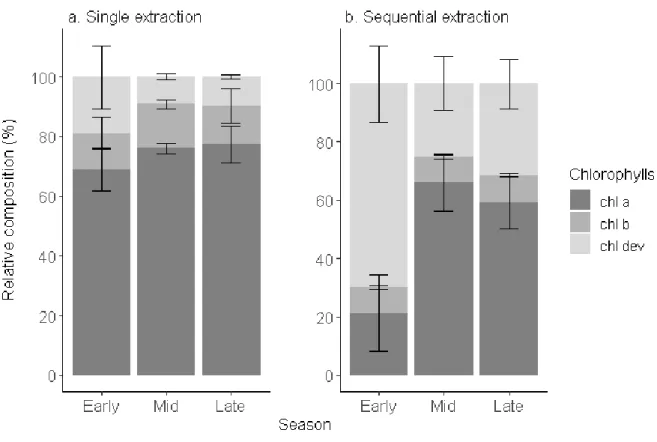
1 2 3 4 5 6 7 8 9 10 11 12 13 14 15 16 17 18 19 20 21 22 23 24 25 26 27 28 29 30 31 32 33 34 35 36 37 38 39 40 41 42 43 44 45 46 47 48 49 50 51 52 53 54 55 56 57 58 59 60
the tree crown offering an additional layer of understanding of the pigment dynamics. chl dev:chl tot 400
was significantly greater and chl a+b:chl tot lower (ANOVA, F1,16= 8.34, p<0.001) after a sequential 401
extraction than a single step extraction (Fig. 4). Irrespective of the extraction method, chl dev:chl tot 402
was highest in the early growing season (single step: 0.2 ± 0.1 , sequential: 0.7 ± 0.1) and tended to 403
be at its lowest in the middle of the growing season (single step: 0.09 ±0.01 , sequential: 0.3 ± 0.1) . 404
The opposite was observed for chl a. Independently of the extraction method, chl b:chl tot remained 405
constant over the entire growing season (single step: 0.13 ± 0.01 , sequential: 0.090 ± 0.002, F1,16= 406
2.90, p = 0.108). The standard deviation indicates the variability in pigment composition within an 407
individual tree among different sampling spots. The pigment profile obtained with a sequential 408
extraction tended to capture the most variability. This variability is mostly driven by chl a:chl tot 409
(cv=30%) and chl dev:chl tot (cv= 28%) and to a lesser extent by chl b:chl tot (8%). The variability in 410
chl a:chl totwithin an individual tree is maximum in the early season and minimal in the mid-season 411
and reversely for chl dev:chl tot. There was no variability observed of chl b:chl tot within an 412
individual tree was across the season. Pigment derivatives are precursors and degradation products 413
of the major pigments and thus can inform on the renewal of chl a and chl b, especially when chl 414
a:chl b ratio tend to be conserved in the mid-growing season [2,8,60]. Change in colour was shown 415
to not be a good indicator of chlorophyll degradation in leaves [57], potentially due to the 416
contribution of chl dev to the optical signal. Monitoring and characterizing chl dev offers the 417
opportunity to further explore seasonal dynamics and variation within the tree crown, in relation 418
with photosynthesis activity and microclimate.
419 1 2 3 4 5 6 7 8 9 10 11 12 13 14 15 16 17 18 19 20 21 22 23 24 25 26 27 28 29 30 31 32 33 34 35 36 37 38 39 40 41 42 43 44 45 46 47 48 49 50 51 52 53 54 55 56 57 58 59 60
420
Fig. 4 Relative composition of chlorophylls (chl a, chl b, chl dev) of beech leaves in early (May to 421
June), mid- (July to August), and late (September to November) growing season 2018 obtained after 422
a single extraction and a sequential extraction. Error bars correspond to standard deviation (n=4).
423 1 2 3 4 5 6 7 8 9 10 11 12 13 14 15 16 17 18 19 20 21 22 23 24 25 26 27 28 29 30 31 32 33 34 35 36 37 38 39 40 41 42 43 44 45 46 47 48 49 50 51 52 53 54 55 56 57 58 59 60
4. Conclusions
424
In this study, we described a new method for the simultaneous characterization of leaf chlorophylls, 425
carotenoids, and their derivatives. The sequential extraction allowed for the recovery of the main 426
pigments and pigment derivatives over a broader range of polarity in comparison with a single 427
extraction commonly used in the literature. The chromatographic separation was validated for 428
leaves of common European deciduous tree species with a good precision and application range for 429
ecophysiological applications. We showed on a case study that accounting for pigment derivatives 430
improved the characterization of intraspecific variation within an individual tree over one growing 431
season. We eventually used a standard HPLC-DAD system with the aim to provide a method 432
accessible to a wide range of users and suitable for diverse applications.
433 1 2 3 4 5 6 7 8 9 10 11 12 13 14 15 16 17 18 19 20 21 22 23 24 25 26 27 28 29 30 31 32 33 34 35 36 37 38 39 40 41 42 43 44 45 46 47 48 49 50 51 52 53 54 55 56 57 58 59 60
Author contributions
434
CRediT taxonomy roles are listed with authors in alphabetical order. Conceptualization &
435
Methodology: F.P., G.B.L.W.; Data curation; F.P.; Investigation: F.P.; Formal analysis: F.P.;
436
Visualization: F.P.; Writing - original draft: F.P.; Writing - review & editing: F.P., G.B.L.W.; Funding 437
acquisition & Resource: G.B.L.W.; Project administration & Supervision: G.B.L.W.
438
Declaration of interests
439
The authors declare that they have no known competing financial interests or personal relationships 440
that could have appeared to influence the work reported in this paper.
441
Funding sources
442
This study was supported by the University of Zurich including the Swiss National Science Foundation 443
project 157778 who funded the HPLC system and the University Research Priority Program on Global 444
Change and Biodiversity.
445
Acknowledgments
446
The authors would like to thank Grünstadt Zürich who allowed us to collect samples and M.D. Hilf 447
who assisted with technical support and instrument maintenance. We are grateful to numerous 448
members of the working groups Soil Science and Biogeochemistry, Geochronology and Remote 449
Sensing Laboratories who helped during sampling campaigns.
450 1 2 3 4 5 6 7 8 9 10 11 12 13 14 15 16 17 18 19 20 21 22 23 24 25 26 27 28 29 30 31 32 33 34 35 36 37 38 39 40 41 42 43 44 45 46 47 48 49 50 51 52 53 54 55 56 57 58 59 60
Reference
451
[1] A. Scartazza, D. Di Baccio, P. Bertolotto, O. Gavrichkova, G. Matteucci, Investigating
452the European beech (Fagus sylvatica L.) leaf characteristics along the vertical canopy
453profile: Leaf structure, photosynthetic capacity, light energy dissipation and
454photoprotection mechanisms, Tree Physiol. 36 (2016) 1060–1076.
455
https://doi.org/10.1093/treephys/tpw038.
456
[2] A. Polle, P. Schwanz, C. Rudolf, Developmental and seasonal changes of stress
457responsiveness in beech leaves (Fagus sylvatica L.), Plant, Cell Environ. 24 (2001)
458821–829. https://doi.org/10.1046/j.1365-3040.2001.00726.x.
459
[3] W. Kraj, M. Zarek, Biochemical basis of altitude adaptation and antioxidant system
460activity during autumn leaf senescence in beech populations, Forests. 12 (2021) 529.
461
https://doi.org/10.3390/f12050529.
462
[4] F. Fleischmann, A. Göttlein, H. Rodenkirchen, C. Lütz, W. Oßwald, Biomass, nutrient
463and pigment content of beech (Fagus sylvatica) saplings infected with Phytophthora
464citricola , P. cambivora, P. pseudosyringae and P. undulata, For. Pathol. 34 (2004) 79–
465
92. https://doi.org/10.1111/j.1439-0329.2004.00349.x.
466
[5] R. Esteban, O. Barrutia, U. Artetxe, B. Fernández-Marín, A. Hernández, J.I. García-
467Plazaola, Internal and external factors affecting photosynthetic pigment composition
468in plants: A meta-analytical approach, New Phytol. 206 (2015) 268–280.
469
https://doi.org/10.1111/nph.13186.
470
[6] J.I. García-Plazaola, J.M. Becerril, Effects of drought on photoprotective mechanisms
471in European beech (Fagus sylvatica L.) seedlings from different provenances, Trees -
472Struct. Funct. 14 (2000) 485–490. https://doi.org/10.1007/s004680000068.
473
[7] J.I. García-Plazaola, R. Esteban, K. Hormaetxe, B. Fernández-Marín, J.M. Becerril,
474Photoprotective responses of Mediterranean and Atlantic trees to the extreme heat-
475wave of summer 2003 in Southwestern Europe, Trees - Struct. Funct. 22 (2008) 385–
476
392. https://doi.org/10.1007/s00468-007-0199-y.
477
[8]
M. Šprtová, V. Špunda, J. Kalina, M. V. Marek, Photosynthetic UV-B response of beech 4781 2 3 4 5 6 7 8 9 10 11 12 13 14 15 16 17 18 19 20 21 22 23 24 25 26 27 28 29 30 31 32 33 34 35 36 37 38 39 40 41 42 43 44 45 46 47 48 49 50 51 52 53 54 55 56 57 58 59 60
(Fagus sylvatica L.) saplings, Photosynthetica. 41 (2003) 533–543.
479
https://doi.org/10.1023/B:PHOT.0000027517.80915.1b.
480
[9] R. Láposi, S. Veres, O. Mile, I. Mészáros, Effects of supplemental UV-B radiation on
481the photosynthesis - Physiological properties and flavanoid content of beech
482seedlings (Fagus sylvatica L.) in outdoor conditions, Acta Biol. Szeged. 49 (2005) 151–
483
153.
484
[10] R. Láposi, S. Veres, G. Lakatos, V. Oláh, A. Fieldsend, I. Mészáros, Responses of leaf
485traits of European beech (Fagus sylvatica L.) saplings to supplemental UV-B radiation
486and UV-B exclusion, Agric. For. Meteorol. 149 (2009) 745–755.
487
https://doi.org/10.1016/j.agrformet.2008.10.023.
488
[11] K. Haberer, K. Herbinger, M. Alexou, M. Tausz, H. Rennenberg, Antioxidative defence
489of old growth beech (Fagus sylvatica) under double ambient O
3concentrations in a
490free-air exposure system, Plant Biol. 9 (2007) 215–226. https://doi.org/10.1055/s-
4912007-964824.
492
[12] K. Herbinger, C. Then, K. Haberer, M. Alexou, M. Löw, K. Remele, H. Rennenberg, R.
493
Matyssek, D. Grill, G. Wieser, M. Tausz, Gas exchange and antioxidative compounds in
494young beech trees under free-air ozone exposure and comparisons to adult trees,
495Plant Biol. 9 (2007) 288–297. https://doi.org/10.1055/s-2006-924660.
496
[13] C. Lütz, S. Anegg, D. Gerant, B. Alaoui-Sossé, J. Gérard, P. Dizengremel, Beech trees
497exposed to high CO
2and to simulated summer ozone levels: Effects on
498photosynthesis, chloroplast components and leaf enzyme activity, Physiol. Plant. 109
499(2000) 252–259. https://doi.org/10.1034/j.1399-3054.2000.100305.x.
500
[14] M. Taniguchi, J.S. Lindsey, Absorption and fluorescence spectral database of
501chlorophylls and analogues, Photochem. Photobiol. 97 (2021) 136–165.
502
https://doi.org/10.1111/php.13319.
503
[15] H.K. Lichtenthaler, Chlorophylls and carotenoids: Pigments of photosynthetic
504biomembranes, Methods Enzymol. 148 (1987) 350–382.
505
https://doi.org/10.1016/0076-6879(87)48036-1.
506
[16] Y. Tanaka, N. Sasaki, A. Ohmiya, Biosynthesis of plant pigments: Anthocyanins,
5071 2 3 4 5 6 7 8 9 10 11 12 13 14 15 16 17 18 19 20 21 22 23 24 25 26 27 28 29 30 31 32 33 34 35 36 37 38 39 40 41 42 43 44 45 46 47 48 49 50 51 52 53 54 55 56 57 58 59 60
betalains and carotenoids, Plant J. 54 (2008) 733–749.
508
https://doi.org/10.1111/j.1365-313X.2008.03447.x.
509
[17] D.A. Sims, J.A. Gamon, Relationships between leaf pigment content and spectral
510reflectance across a wide range of species, leaf structures and developmental stages,
511Remote Sens. Environ. 81 (2002) 337–354. https://doi.org/10.1016/S0034-
5124257(02)00010-X.
513
[18] S.J. Schwartz, S.L. Woo, J.H. von Elbe, High-performance liquid chromatography of
514chlorophylls and their derivatives in fresh and processed spinach, J. Agric. Food Chem.
515
29 (1981) 533–535. https://doi.org/10.1021/jf00105a025.
516
[19] P. Gupta, Y. Sreelakshmi, R. Sharma, A rapid and sensitive method for determination
517of carotenoids in plant tissues by high performance liquid chromatography, Plant
518Methods. 11 (2015) 1–12. https://doi.org/10.1186/s13007-015-0051-0.
519
[20] N.E. Craft, Carotenoid reversed-phase high-performance liquid chromatography
520methods: Reference compendium, Methods Enzymol. 213 (1992) 185–205.
521
https://doi.org/10.1016/0076-6879(92)13121-d.
522
[21] H. Nyambaka, J. Ryley, An isocratic reversed-phase HPLC separation of the
523stereoisomers of the provitamin A carotenoids (α- and β-carotene) in dark green
524vegetables, Food Chem. 55 (1996) 63–72. https://doi.org/10.1016/0308-
5258146(95)00093-3.
526
[22] H. Jin, Y.M. Lao, J. Zhou, H.J. Zhang, Z.H. Cai, Simultaneous determination of 13
527carotenoids by a simple C
18column-based ultra-high-pressure liquid chromatography
528method for carotenoid profiling in the astaxanthin-accumulating Haematococcus
529pluvialis, J. Chromatogr. A. 1488 (2017) 93–103.
530
https://doi.org/10.1016/j.chroma.2017.01.088.
531
[23] J.I. García-Plazaola, J.M. Becerril, A rapid high-performance liquid chromatography
532method to measure lipophilic antioxidants in stressed plants: Simultaneous
533determination of carotenoids and tocopherols, Phytochem. Anal. 10 (1999) 307–313.
534
https://doi.org/10.1002/(SICI)1099-1565(199911/12)10:6.
535
[24] P.D. Fraser, M. Elisabete S Pinto, D.E. Holloway, P.M. Bramley, Application of high-
5361 2 3 4 5 6 7 8 9 10 11 12 13 14 15 16 17 18 19 20 21 22 23 24 25 26 27 28 29 30 31 32 33 34 35 36 37 38 39 40 41 42 43 44 45 46 47 48 49 50 51 52 53 54 55 56 57 58 59 60
performance liquid chromatography with photodiode array detection to the
537metabolic profiling of plant isoprenoids, Plant J. 24 (2000) 551–558.
538
https://doi.org/10.1046/j.1365-313X.2000.00896.x.
539
[25] A. Gentili, F. Caretti, S. Ventura, V. Pérez-Fernández, A. Venditti, R. Curini, Screening
540of carotenoids in tomato fruits by using liquid chromatography with diode array-
541linear ion trap mass spectrometry detection, J. Agric. Food Chem. 63 (2015) 7428–
542
7439. https://doi.org/10.1021/acs.jafc.5b02910.
543
[26] A. Gentili, C. Dal Bosco, S. Fanali, C. Fanali, Large-scale profiling of carotenoids by
544using non aqueous reversed phase liquid chromatography – photodiode array
545detection – triple quadrupole linear ion trap mass spectrometry: Application to some
546varieties of sweet pepper (Capsicum annuum L.), J. Pharm. Biomed. Anal. 164 (2019)
547759–767. https://doi.org/10.1016/j.jpba.2018.11.042.
548
[27] X. Wei, N. Chen, B. Tang, X. Luo, W. You, C. Ke, Untargeted metabolomic analysis of
549the carotenoid-based orange coloration in Haliotis gigantea using GC-TOF-MS, Sci.
550
Rep. 9 (2019) 1–13. https://doi.org/10.1038/s41598-019-51117-9.
551
[28]
B. Simonovska, I. Vovk, V. Glavnik, K. černelič, Effects of extraction and high- 552performance liquid chromatographic conditions on the determination of lutein in
553spinach, J. Chromatogr. A. 1276 (2013) 95–101.
554
https://doi.org/10.1016/j.chroma.2012.12.032.
555
[29] B. Schoefs, M. Bertrand, Y. Lemoine, Separation of photosynthetic pigments and their
556precursors by reversed-phase high-performance liquid chromatography using a
557photodiode-array detector, J. Chromatogr. A. 692 (1995) 239–245.
558
https://doi.org/10.1016/0021-9673(94)01066-N.
559
[30] E. Darko, B. Schoefs, Y. Lemoine, Improved liquid chromatographic method for the
560analysis of photosynthetic pigments of higher plants, J. Chromatogr. A. 876 (2000)
561111–116. https://doi.org/10.1016/S0021-9673(00)00141-2.
562
[31] R.L. Airs, J.E. Atkinson, B.J. Keely, Development and application of a high resolution
563liquid chromatographic method for the analysis of complex pigment distributions, J.
564
Chromatogr. A. 917 (2001) 167–177. https://doi.org/10.1016/S0021-9673(01)00663-
5651 2 3 4 5 6 7 8 9 10 11 12 13 14 15 16 17 18 19 20 21 22 23 24 25 26 27 28 29 30 31 32 33 34 35 36 37 38 39 40 41 42 43 44 45 46 47 48 49 50 51 52 53 54 55 56 57 58 59 60
X.
566
[32] S. Jayaraman, M.L. Knuth, M. Cantwell, A. Santos, High performance liquid
567chromatographic analysis of phytoplankton pigments using a C
16-Amide column, J.
568
Chromatogr. A. 1218 (2011) 3432–3438.
569
https://doi.org/10.1016/j.chroma.2011.03.058.
570
[33] N. Ishida, Expanded separation technique for chlorophyll metabolites in Oriental
571tobacco leaf using non aqueous reversed phase chromatography, J. Chromatogr. A.
572
1218 (2011) 5810–5818. https://doi.org/10.1016/j.chroma.2011.06.082.
573
[34] J.L. Garrido, F. Rodríguez, E. Campaña, M. Zapata, Rapid separation of chlorophylls a
574and b and their demetallated and dephytylated derivatives using a monolithic silica
575C
18column and a pyridine-containing mobile phase, J. Chromatogr. A. 994 (2003) 85–
576
92. https://doi.org/10.1016/S0021-9673(03)00486-2.
577
[35] G. Milani, M. Kneubühler, D. Tonolla, M. Doering, G.L.B. Wiesenberg, M.E.
578
Schaepman, Remotely sensing variation in ecological strategies and plant traits of
579willows in perialpine floodplains, J. Geophys. Res. Biogeosciences. 124 (2019) 2090–
580
2106. https://doi.org/10.1029/2018JG004969.
581
[36] R Core Team, R: A language and environment for statistical computing, R Found. Stat.
582
Comput. Vienna, Austria. (2020). https://www.r-project.org/.
583
[37] F. Raposo, C. Ibelli-Bianco, Performance parameters for analytical method validation:
584
Controversies and discrepancies among numerous guidelines, TrAC - Trends Anal.
585
Chem. 129 (2020) 115913. https://doi.org/10.1016/j.trac.2020.115913.
586
[38]
D. Stöckl,