73 Figure 4.3.2.3b Densification characteristics for spark plasma sintered SrTaO2N.73 Figure 4.3.2.3c: Diffraction data for spark plasma sintered BaTaO2N at SPS..74 Figure 4.3.2.3d: Diffraction data for SPSa plasma sintered SrT. 75 Figure 4.3.2.3e: Visual appearance of spark plasma sintered BaTaO2N and. /Ta) for nitrogen content..97 Figure 6.3.1.1a Diffraction patterns of oxynitride films on an alumina substrate (S) after synthesis under different reaction conditions ..99.

INTRODUCTION
Motivation
Literature Review
Here, when NH3 dissociates, nitrogen forms the molecular gas.10 Once nitrogen forms the molecular gas, N2, the activity becomes negligible at typical ammonolysis synthesis temperatures (800˚C-1200˚C), limiting the efficiency of Equation 1 and the oxynitride reaction .11 This is a direct result of the high dissociation enthalpy of N2 (ΔHdiss = 995kJ/mol @ 1300K).12 Therefore, Equation 3 illustrates the combination of Equations 1 and 2 and the experimentally observed oxynitride reaction. Unfortunately, as the temperature increases, the rate of formation of inert, molecular nitrogen increases (increase in efficiency of eqn 2).7 Therefore, oxynitride production is realized only through non-equilibrium conditions and proper control of the gas phase composition.
Work Plan
EXPERIMENTAL
Ammonia Concentration Measurement
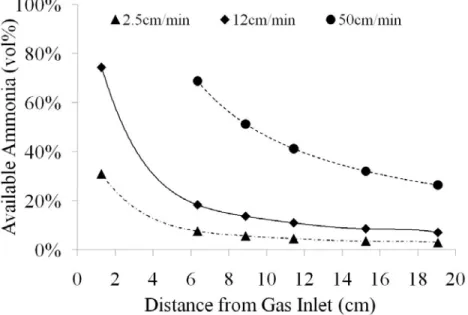
Consequently, this forces a constant replenishment of ammonia and active nitrogen, via recirculation or gas flow control. By pressure equilibrium at ~1 atm, between water above the chamber and the chamber components (gas/water mixture), a known amount of gas and water is retained in the chamber.

RESULTS AND DISCUSSION
Temperature Distribution
Maximum Temperature and Flow Velocity
Sample Placement and Furnace Configuration
The degree of gas mixing perpendicular to the flow is uncertain (A1). Figure 2.3.3b) If mixing is low, this can lead to depletion of reactive gas (NH3) at the sample gas interface and limited gas penetration into the powder bed. The current furnace design uses refractory alumina with drilled holes immediately upstream of the reaction zone. see Figure 2.3.1a) Therefore, the samples were placed in line with the alumina refractory inlet hole, eliminating sample placement in potential “dead zones”.
CONCLUSION
INTRODUCTION
Motivation
Literature
Many other contributions to stability can be envisaged: ionic size, ionic charge, electric field strength of the ion, valence electron configuration, stability of competing phases, etc. Current work discusses electric field strength of the ion, electronegativity and ionic size, as these factors change as a function of A-site cation (Ca,Sr,Ba).
Work Plan
Interestingly, synthesis from multicomponent oxides yielded phase-pure SrTaO2N, CaTaO2N and SrNbO2N compared to synthesis from a carbonate/oxide mixture. The added stabilization energy could promote phase-pure synthesis, whereas, for the niobium counterpart with higher electronegativity (CaNbO2N), the added lattice energy was not enough to prevent a binary oxynitride from forming.
EXPERIMENTAL
- Precursor Formation
- Ammonolysis Reaction
- Powder X-Ray Diffraction
- Chemical Composition Analysis
- X-Ray Photoelectron Spectroscopy (XPS)
- Environmental Scanning Electron Microscopy (ESEM)
The samples were run on a D5000 Siemens diffractometer with a CuKa radiation source set at 40 keV and 30 mA. Evolved oxygen (in the form of CO2) was quantified and removed using IR and an adsorbent patented by LECO.

RESULTS AND DISCUSSION
Sample Position
Thermogravimetric analysis investigated ATaO2N (A=Sr,Ba) thermal stability. Figure 4.3.1.1a) After treatment, a slight discoloration attributed to oxidation was observed on the top of the sample.

Flow velocity
A-Site Exchange
- Cation Stoichiometry
Furthermore, a decrease in the alkaline earth oxide lattice energy (via a change in electronegativity, ionic field strength, or ion size) can also reduce the stability of the mixed anion structure. Ra, Ro and Rb represent the ionic radius of the A-site cation, the anion and the B-site cation in the perovskite structure, ABO3. This is shown by a change in the relative area of each XPS peak as a function of CaCO3 content (representative example shown in Figure 3.3.3.1d).

Temperature
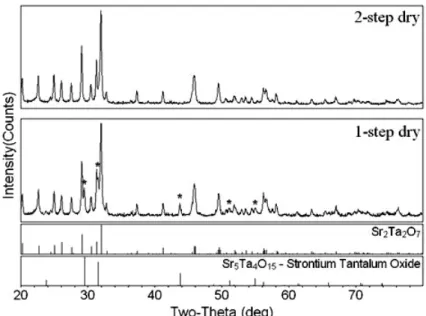
Only the first position (1.3 cm) lacks minor oxide phases, where in section 3.3.1 at 1000˚C the first four positions (1.3 cm to 11.5 cm) lack detectable minor oxide phases. The results are rationalized by increased decomposition of NH3 to N2 and H2 and reduced active nitrogen content at higher temperatures (see Section 2.3.2). However, the instability of oxynitride at elevated temperatures is becoming more of a concern.19 Therefore, the upper temperature limit is controlled by increased NH3 decomposition and structural instability of the oxynitride.

Furnace Configuration
While changing flow velocity in a non-rotating system (section 3.3.2), it was observed that high concentrations of NH3 Ta3N5 caused formation before solid state diffusion processes could stabilize the oxynitride. This provides fluctuations in the time each surface experiences the NH3 stream and allows solids transport and enhanced particle mixing to progress before a binary nitride phase can form.
Precursor Form
- Reaction Rate (Powder XRD)
- Perovskite Structure (Powder XRD)
- Anion Composition (LECO Hot-Gas Extraction)
- Powder Microstructure (SEM)
Cell volume and minor phase concentration as a function of the distance from the gas inlet are shown in Figure 3.3.6.1a & b respectively. ST. For PO samples, both size and strain decreased as the distance from the gas inlet increased. Flux additions (FA) resulted in minimal strain broadening (<5%) and larger crystallites (~250nm), consistent with enhanced solids transport.
CONCLUSION
These limitations were ameliorated by a larger batch production process (rotary furnace->30 grams) that maintained powder purity (low concentrations of Ta3N5 .) (sec. This led to bulking of excess CaCO3 precursors in an attempt to formed a calcium-rich perovskite (section 3.3.3.1) Using a flux-assisted method to form improved reaction kinetics, crystallinity, and grain size of SrTaO2N, compared to ammonolysis of a carbonate/oxide mixture or an oxide pre-reacted multicomponent (SrTaO3.5) (sec. 3). .6).
INTRODUCTION
Motivation
Literature Review
- Oxynitride and Nitride Stability
- Perovskite Oxynitride Stability
- Nitride and Oxynitride Sintering
The rate of nitride decomposition (fast for Ge3N4 and slow for Si3N4) leads to the following equations 14 and 15. The intermediate state is defined as the complete replacement of the lattice nitrogen by oxygen and the partial retention of the lattice nitrogen in the form of a di-nitrogen metal bond with the B-site cation.39 The structural transformation from the intermediate state to the final oxide (usually a layered perovskite, ABO3.5) takes place at an elevated temperature with the release of nitrogen. A thermochemical study shows a weakly bound di-nitrogen species with a structural change from interstitial to layered perovskite that requires most of the oxidation enthalpy.40.
Work Plan
EXPERIMENTAL
- Powder Synthesis
- Thermogravimetric Analysis
- In situ, High Temperature DRIFT
- In situ, High Temperature XRD
- Room Temperature Powder XRD
- XPS
- Gas Overpressure
- Axial Pressure (Spark Plasma Sintering)
Samples were prepared by mixing oxynitride powder with isopropyl alcohol and applying it to a 99.6% alumina substrate. Samples were prepared by mixing oxynitride powder with IPA and applied to a single crystal, zero background sapphire holder. Powder or granular samples were placed in an alumina crucible with an alumina top and placed in the pressure vessel.

RESULTS AND DISCUSSION
Thermal Stability
- Thermogravimetric Analysis
- In situ High Temperature XRD
After the TGA thermal treatment, SrTaO2N had no detectable decomposition products (via XRD), a slight cell volume decrease and an increase in crystallinity (by better defined diffraction peaks). Figure 4.3.1.1c-d) Minor alumina contamination was noted from reference powder used during background measurements. Similar to literature on oxynitride stability, the present work identifies the degradation mechanism at high temperature and under inert atmosphere (low oxygen content) as loss of nitrogen and phase decomposition (for BaTaO2N). Comparison of TGA and HTXRD results show different high temperature instability mechanisms, even if atmosphere (nitrogen with ~50ppm oxygen) and.

Sintering
- Pressure-less Sintering
- Gas Overpressure
- Spark Plasma Sintering
Spark Plasma Sintering (SPS) has been evaluated for lowering oxynitride sintering temperatures into the region of stability (<1000˚C). For both compounds and at all pressures, densification is noted only at temperatures of 1000˚C. Figure 4.3.2.3a Compaction characteristics of spark plasma sintered BaTaO2N. Figure 4.3.2.3b Compaction characteristics of spark plasma sintered SrTaO2N. Structurally, all sintered samples are phase-pure oxynitride via XRD. Further examination of samples sintered at 1000˚C revealed a loss of nitrogen (via LECO hot gas extraction analysis). Figure 4.3.2.3f) Therefore, the onset of densification (≥1000˚C) probably originates from material instability.

CONCLUSION
INTRODUCTION
Motivation
Literature Review
- Wet Chemistry Overview and Selection
- Hybrid
- Pechini
MOD processes will not be studied since limited chemical interactions regularly create phase-separated products. Hybrid processing involves simple dissolution of reagents in a solvent, such as acetic acid, in the desired ratio. Glycol groups such as ethylene glycol (EG) are then introduced followed by a slight increase in temperature (~80˚C to 120˚C).
Work Plan
This promotes the formation of an organic ester with the hydrocarboxylic acid, which gels the structure and maintains the homogeneity of the composition.
EXPERIMENTAL
Hybrid Synthesis Route
Pechini Sol Synthesis Route
XRD
TGA-DTA
RESULTS AND DISCUSSION
- Creation of Sol
- Gelation and Drying
- Pyrolysis
- Crystallization Behavior
For alkanolamine sols, an unidentifiable phase formed in XRD after drying, regardless of the procedure. In the present work, XRD refinement of powder of the intermediate oxide indicated a deficiency of strontium, Sr0.70TaO3. Analyzing powder of the intermediate oxide yielded a similar stoichiometry, Sr0.70TaO3, to previous literature on films.
CONCLUSION
INTRODUCTION
Motivation
Literature Review
For example, Aguiar et al ammonolyzed a dense, well-crystallized oxide film and observed a reduction in nitrogen content as a function of depth.54 Experimentally, each scenario is investigated by varying the oxynitride reaction rate. However, below 900˚C the oxynitride synthesis rate is low, and above 1000˚C phase stability becomes a problem. 19 This provides a minimal synthesis temperature regime (900–1000˚C) and therefore limits the ability to manipulate film properties as a function of temperature.
Work Plan
EXPERIMENTAL
- Thin film deposition
- Ammonolysis Reaction
- XRD
- ESEM-EDS
- WDS
- XPS
Samples were run on a JEOL-JXA 8200 electron microprobe (WDS) at an accelerating voltage of 15kV and a probe current of 3x10⁻⁸A. A calibration curve correlating nitrogen peak area to nitrogen content was obtained using Ta3N5, SrTaO3.5 and SrTaO2N powders and mixtures thereof. For the fitting procedure, FWHM values and peak area ratios of spin orbitals were obtained from the literature, the NIST database, and experimentally derived using Ta2O5, Ta3N5, SrTaO3.5, and SrTaO2N powders.20-22 For sputtering, a 3keV Ar+- source rasterized over an area of 1x1 mm.

RESULTS
Phase Composition and Structure (C1)
- XRD Analysis
- XPS Analysis
XPS was used to investigate the N1s and O1s chemical environment for possible minor phases (below the detectable threshold in XRD) and the process of nitrogen incorporation. No additional N1s peaks associated with alternative nitrogen species were observed (eg adsorbents, interstitial, minor phases). However, overlap of the Ta4p3 peak and the proximity of the lattice N1s peaks of SrTaOxNy and Ta3N5 may hide a minor peak.

Anion Composition (C2)
- WDS Analysis
- XPS Analysis
The intermediate oxide O1s/Ta4f peak area was obtained from a film that did not undergo an ammonolysis treatment (only pyrolyzed in air). After formation of a SrTaO2N phase, these areas will decrease to 2/3.5 of the original value, resulting in an O1s/Ta4f area of 0.252 (non-ammonolyzed) and 0.257 (pyrochlor). The film surface was removed via Ar+ sputter (3keV Ar+, 1x1 mm, 0.3 min per cycle, 3 cycles, estimated sputter removal of ~40-50nm) The ideal peak area is for SrTaO2N.

Phase Homogeneity (C3)
- EDS Analysis
- XPS Analysis
Interestingly, the strontium and oxygen concentrations decreased and the tantalum concentration increased after removing the film surface. However, this is inconsistent with the elemental concentrations at the interface (in Figures 13 and 14 ), where strontium and tantalum decrease along with tantalum initially reaching zero concentration. 1-20 film is attributed to the limited exposure of NH3 to the inner depths of the film.

Valence State (C4)
- XPS Analysis
Extrapolation of the intermediate positions of the oxide peaks assigns the high BE state to the oxide environment (indicated by dotted lines in Fig. 6.34.1c). For example, fitting the Ta4f environment with only two peaks (one state) produced an excessive FWHM and an incorrect area ratio (b/t 5/2 and 7/2 orbitals). To determine the origin of the oxide (either as ambient residual oxide from an incomplete ammonolysis reaction or as a surface entity), we examined the concentration of each state as a function of nitrogen content. Figure 6.3.4.1h) As nitrogen levels increase, the content of the low and high BE states increases and decreases, respectively.

Microstructure (C5)
- SEM Analysis
This is understandable because nitrides usually have lower ionic mobility compared to oxides due to higher covalency.

Conclusion
Optimized Reaction Conditions
Mechansim for producing a SrTaO x N y phase
Tai, “Characterization of the structural, optical and dielectric properties of oxynitride perovskites AMO2N (A = Ba, Sr, Ca; M = Ta, Nb).” Chem. Roult, “Structural study of neutron diffraction of the SrTaO2N oxynitride perovskite and of the Ba1-xSrxTaO2N solid solution,” Rev. Lacey, “A study of the microchemistry of nanocrystalline BaTiO3 with tetragonal and pseudocubic room temperature symmetries”; Ph.D.