We begin by describing the policy initiatives that have created demand for modeling tools that quantify net greenhouse gas emissions from agricultural and forest land management. Using the model to address greenhouse gas emissions from agricultural landscapes was a key goal during the development of DAYCENT.

Flux
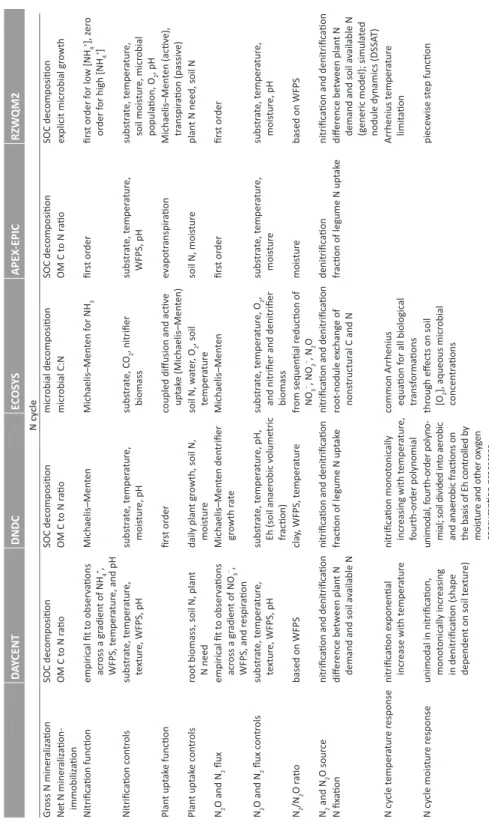
While all models calculate N2O flux based on a measure of soil moisture or O2 status, only DAYCENT and DNDC explicitly include soil texture as a control on N2O flux. The fundamental challenge for mechanistic simulation of N2O flux is the accurate modeling of spatial and temporal variation in soil environmental conditions.
Empirical Models for Estimating Cropping System GHG Flux
When field observations are available for specific cropping systems on representative soil textures and in relevant climates, empirical models are a robust tool for delineating the range of N2O flux. In the absence of measurements focusing on N2O flux response to extreme weather events, empirical models are unlikely to accurately capture the occurrence of pulse N2O flux events that often compromise the majority of emissions.
GHG Data Availability and Model Validation Studies
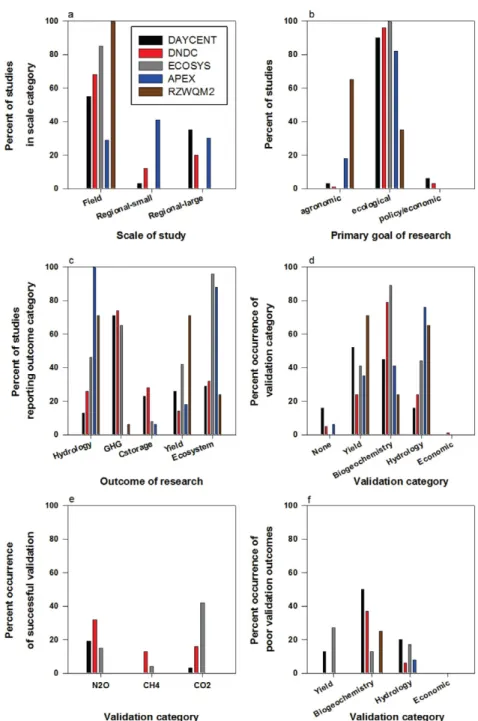
The main objective of most studies has been to address the ecological impacts of agricultural management (Figure 1b), although some model applications have focused on more agronomic issues such as yield. Studies using models with hydrology-focused developmental histories (APEX, RZWQM2) often reported hydrological results, while studies using models with developmental histories focused on carbon and nitrogen cycling (DAYCENT, DNDC, ECOSYS), most often reported on greenhouse gases. results (Figure 1c). Model applications often included other ecosystem properties such as soil inorganic N, NO3 or P leaching, soil temperature or system energy balance (Fig. 1c).
Studies applying DNDC and ECOSYS most often validated biogeochemical outcomes, while APEX and RZWQM2 had the highest number of hydrological validations (Fig. 1d). Although all assessed models can simulate greenhouse gas emissions, the greenhouse gas results have not yet been widely validated (Figure 1e).
Managing Agricultural Landscapes to Promote SOC Storage
The lack of research below 20 to 30 cm in the soil profile means that biophysical processes and various tillage types known to affect deeper parts of the soil profile are not considered in most analyzes (Baker et al., 2007). Third, there are only a few data sets that show changes in soil C in response to agricultural management practices and allow us to determine whether these changes are due to decomposition or erosion (Van Oost et al., 2007). Fourth, to establish empirical relationships between practice change and soil carbon storage, experiments typically need to run for several years before a response can be detected (Richter et al., 2007).
The need for long-term data arises because the soil carbon stock is very large, meaning that even if the rate of soil carbon storage increases significantly, the total amount of soil carbon will not change sufficiently over 1 to 5 years for the change to be captured with a feasible number of samples (Paul et al., 1997). Consequently, detecting a change in soil carbon in response to a change in land management requires soil samples many years apart, ideally in fields where different management practices have been maintained after initially similar histories (Rasmussen et al., 1998; Richter et al. , 2007).
Reducing Agricultural GHG Emissions through Management of Agricultural Systems
In the US context, policies focusing on N management are relevant to reducing our GHG emissions from agriculture. In this section, we focus on how carbon cycling in the United States is modeled for (i) national-scale reporting under the UNFCCC and (ii) project-scale accounting using tools developed by CAR and RGGI. In these cases, the approaches are mainly empirical and are based on periodic measurements of the key carbon pools, either directly in the parcel of interest for the compliance programs or based on systematic forest surveys of similar forests within the region for voluntary programs and county, state and national estimates of forest carbon fluxes.
Globally, forest ecosystems are important net sinks of CO2 (Pan et al., 2011), and in the US, net CO2 uptake by forests is equivalent to approximately 16% of total CO2 emissions from fossil fuel combustion (USEPA, 2013). In the United States, most of the change in forest carbon stocks (carbon sink) occurs in above-ground biomass (49%), with an additional 27% in wood products in landfills and the remainder in dead wood, spent wood products, and forest floors and soil (Woodbury et al., 2007b).
National-, State-, and County-Scale Estimates Based on Forest Inventory Measurements
COLE was developed to enable easy estimation of forest carbon stocks for a user-specified region of interest (Proctor et al., 2005). Under the US Voluntary Carbon Program known as “1605b,” the Forest Service adopted COLE as the official web tool for the forest portion of this program (Heath, 2013). In tropical areas, such deforestation for agriculture causes large emissions of CO2 (Ramankutty et al., 2007).
If only net land-use change is modeled, the "lag" effect of afforestation can cause a large bias in the estimates (Woodbury et al., 2007a). To investigate the utility of the FVS model for carbon offset projects, data from three long-term forest sites were compared to FVS predictions of carbon stock changes (Fahey et al., 2010).
Comparing and Evaluating Different Approaches to Modeling Forest Carbon
These results suggest that no model simulation can represent events that are not predicted, such as the decline of a dominant species. All of these earthworm impacts can alter forest floor and mineral soil carbon stocks, and if this change is not measured or included in a model, it can result in significant errors in carbon stock changes (Frelich et al., 2006). The comparison of changes in forest carbon stocks over decades for three sites in the northeast showed that the FVS modeling system could sometimes well predict population changes, but in other cases could not, due to the decline of larger species or the lack of inclusion of fast-growing species after harvest (Fahey et al., 2010).
Model simulations obviously cannot capture unforeseen events, such as the decline of a dominant species or the consequences of an invasion of exotic earthworms. Furthermore, none of the models discussed herein include non-GHG effects, such as changes in albedo that could promote local and regional warming (Whitehead, 2011).
Advantages and Limitations of Mitigation Options
Fourth, estimates of soil carbon stocks and inferences about the response of SOC to management changes depend on the depth of sampling (Baker et al., 2007; Kravchenko and Robertson, 2011). One school of thought asserts that because agricultural management affects the soil profile in depth, comparisons between management practices require investigations of the entire profile (Baker et al., 2007). Because soil temperature controls the rate of root growth, fields managed with conservation tillage may have slower root growth and therefore add less carbon to the soil (Baker et al., 2007).
So, although N2O emissions do not present the same detection challenge as soil carbon storage, we still need measurements of N2O emission rates over many years after a change in management, especially when management changes affect soil characteristics. (Six et al., 2004). . In USDA's newly developed method for estimating N2O emissions from agricultural fields in the United States, the Agency used both of these data sets (NI, SL) as the basis for adjusting N2O emission estimates based on the use of NI- ve by growers (Biggar et al. ., 2013).
Model Structure and Scale of Application
The breadth of the original proposal indicates the kind of expectations and hopes that have emerged in the policy arena. Subsequent steps taken by the Reserve to refine this protocol and to establish mechanisms for incorporating additional practices as additional data become available further demonstrate the extent to which data availability and advice from the research community have shaped this protocol. Even at large scales, where values of ecosystem-scale variables converge across models, the extent to which different processes contribute to these values can vary considerably between models.
The source of greenhouse gas emissions is relevant to the design of best management practices; therefore, inconsistencies in model results with respect to GHG sources affect the suitability of models for broad application to management issues. Because different models identify different underlying mechanisms for the total GHG flux, modelers and policymakers should exercise caution in concluding that a particular model accurately estimates GHG emissions.
Outstanding Questions
Data Limitations and Nonlinearity
Over the past decade in the United States, estimates of total greenhouse gas fluxes from complex process models and simple empirical models have often converged. But if processes or practices not included in a model have an influence, greenhouse gas emissions estimates are unlikely to be correct. Despite increasing data availability, few datasets include simultaneous measurements of key processes, pools and greenhouse gases (e.g. plant growth, CO2, N2O, NO3-, SOC, soil nutrient status).
For example, there are hundreds of datasets reporting N2O measurements in agricultural systems, but few are sufficient to support a robust understanding of how management practices affect N2O emissions. To assess the influence of different management practices on N2O emissions, we need side-by-side testing of different management systems.
Applications to GHG Offset Projects
Collecting enough site-specific data to accurately parameterize a model can be very expensive and may still overlook factors or practices that are not included in the model. We can be confident that there are huge differences between agricultural fields in the potential for N2O emissions reductions and soil carbon storage. This variation has implications that deserve more attention than they sometimes receive in the field of agricultural greenhouse gas offsets.
In the context of water quality protection, recognition of the variability in N loss from cropland has resulted in efforts to target areas of the landscape with the highest losses and the greatest potential for reducing N pollution. This approach of targeting has not yet been applied in the context of agricultural GHG compensation.
Acknowledgments
Impact of Second Generation Biofuel Agriculture on Greenhouse Gas Emissions in Corn Growing Regions of the United States. DAYCENT simulations of nitrogen oxide emissions from seeded land in the US at the national level. Modeling climate change impacts on irrigated corn production in the central Great Plains.
Advances in understanding the molecular structure of soil organic matter: implications for environmental interactions. Modeling the effects of carbon sequestration on net greenhouse gas emissions from agricultural soils in China. Modeling the impact of climate change and management practices on greenhouse gas emissions from cropland.
Modeling the impact of agricultural management practices on greenhouse gas emissions in the oasis region of China.