AURA: Alfred University Research & Archives https://aura.alfred.edu/
Inamori School of Engineering Faculty Scholarship
2022-04
Synthesis, Processing and the Effect of Thermal Treatment on the Solubility, Antioxidant Potential and
Cytocompatibility of Y2O3 and CeO2
doped SiO2-SrO-Na2O Glass-Ceramics
Wren, Anthony
Placek LM, Keenan TJ, coughlan A, Wren AW. Synthesis, Processing and the Effect of Thermal Treatment on the Solubility, Antioxidant Potential and Cytocompatibility of Y2O3 and CeO2 doped SiO2-SrO-Na2O Glass-Ceramics. Journal of Biomaterials Applications.
2022;37(1):102-117. doi:10.1177/08853282221078448 SAGE
https://doi.org/10.1177/08853282221078448 https://libraries.alfred.edu/AURA/termsofuse
This is the Accepted Manuscript of the following article: Placek LM, Keenan TJ, coughlan A, Wren AW. Synthesis, Processing and the Effect of Thermal Treatment on the Solubility, Antioxidant Potential and Cytocompatibility of Y2O3 and CeO2 doped SiO2-SrO-Na2O Glass-Ceramics. Journal of Biomaterials Applications. 2022;37(1):102-117, which has been published in final form at https://doi.org/10.1177/08853282221078448. The article is protected by copyright and reuse is restricted to non-commercial and no derivative uses.The article is protected by copyright and reuse is restricted to non-commercial and no derivative uses.
Downloaded from AURA: Alfred University Research & Archives
1
Synthesis, Processing and the Effect of Thermal Treatment on the Solubility, Antioxidant Potential and Cytocompatibility of Y
2O
3and
CeO
2doped SiO
2-SrO-Na
2O Glass-Ceramics.
L. M. Placek1, T.J. Keenan1, A. Coughlan2, A.W. Wren1
1Kazuo Inamori School of Engineering, Alfred University, Alfred NY, USA.
2Department of Bioengineering, University of Toledo, Toledo, OH, USA.
Keywords: Bioactive Glass, Yttrium, Cerium, Bioceramic, Nerve, Antioxidant Capacity
Address for Correspondence:
Anthony W. Wren PhD
Kazuo Inamori School of Engineering, Alfred University,
Alfred, New York 14802, USA.
Tel: 607-871-2183 Email: [email protected]
2
ABSTRACT
Thermal treatment of a 0.52SiO2-0.24SrO-0.24-xNa2O-xMO glass-ceramic series (where x
= 0.08 and MO = Y2O3 or CeO2) was conducted in order to synthesize yttrium (Y3+) and cerium (Ce3+) crystalline species that may act as radical oxygen specie (ROS) scavengers. The prominent phase for the Control is a sodium-strontium-silicate while the experimental glass-ceramics (HY, YCe, HCe) present sodium-Y/Ce-silicate and oxide phases. Disk shrinkage during thermal processing ranges from 1-7% for Control, HY, YCe and HCe in both diameter and thickness.
Solubility studies determined that the release of Si4+ and Na+ are greatest from the Control disks which peaks at 1550 μg/mL. Release from the Y3+ and Ce3+ glass-ceramics reached 320 μg/mL for Si4+ and 630 μg/mL for Na+. The range of antioxidant capacity (ABTS assay) for all samples was 0.31–3.9 mMTE. No significant reduction in MC 3T3 Osteoblast cell viability was observed for any composition tested.
3 1 INTRODUCTION
Biological response to nerve injury includes: influx of monocytes, lymphocytes, and inflammatory mediators, activation of microglia and astrocytes, formation of the glial scar and is accompanied by changes in the new extracellular matrix (ECM) and changes in the extracellular fluid composition where calcium (Ca2+), glutamate, aspartate and iron are commonly released thereby stimulating the production of reactive oxygen species (ROS) at the site[1-5] . While these are natural repair mechanisms, they often result in degeneration of the axon at the site of severance[2, 6-9]. This work aims to mediate the effect of biologically generated ROS through composition and process modification of a bioactive glass series.
Ion release and surface dissolution of bioactive glasses (BG) is a highly desirable therapeutic characteristic resulting in biodegradable properties when immersed in a hydrated medium. The most widely researched BG is Bioglass and has been commercialized and successfully applied in restorative dentistry and orthopedics today. This material was originally developed in 1969 by Prof. Larry Hench at the University of Florida and the subsequent class of materials that stemmed from this research, i.e. BG, has been used to formulate numerous therapeutic glass based biomaterials ever since[10-12]. BG based materials include glass-ceramic scaffolds for orthopedic applications[11, 13, 14], glass polyalkenoate bone cements[15-17], and glass microspheres for cancer treatment[18, 19]. Since their inception, bioactive glasses have been applied and investigated for hard tissue repair as they stimulate osteogenesis in in vitro models[11]. Bioactive glasses are characterized by their ability to promote healing within the body due to the dissolution of the glass surface and ion exchange upon exposure to physiological medium or body fluids. The specific mechanism includes soluble Si4+ being released into the surrounding medium in the form of silicic acid due to ion exchange with H+ and H3O+[20]. This subsequently results in the precipitation of an amorphous calcium phosphate layer which crystallizes to a carbonated hydroxyapatite layer (HCA). This characteristic is essential for the initiation of the bioactive cascade resulting in the deposition of a hydroxycarbonate apatite (HCA) surface layer and subsequent integration with host tissues. The released ions have been shown, in appropriate quantities to be therapeutic, where the most commonly investigated ions Si4+, Ca2+ and PO4-3
encourages osteogenesis[21]. It has been established that ionic dissolution products from 45S5 Bioglass and other silicate based glasses can stimulate angiogenesis and expression of several
4
genes of osteoblasts, which suggests their applicability may supersede primarily osseous tissue[21-
23].
However, if the ion release rate is excessive or associated spikes in pH are not accommodated by the dynamic physiological environment, toxicity can be observed. Previous work by the authors on these compositions has shown both osteoblast and fibroblast toxicity through cell viability assays as a result of rapid glass dissolution[24, 25].
In an effort to control the dissolution behavior of bioactive glasses two techniques are considered: compositional modification and partial crystallization[26]. Common compositional changes focus on the inclusion of ions such as Sr2+, Ti4+, Mg2+, and Al3+ which have been shown to increase network rigidity and decrease glass dissolution[27-30]. In many cases the composition is selected with the aim of providing specific therapeutic effects, and its alteration is not desirable.
In this work the composition was formulated with two goals; the first with the aim of producing a glass that will not contribute to excess calcium (Ca2+) accumulation occurring at the site of nerve injury[6, 7]. Therefore, Sr2+ was utilized in place of Ca2+, as they have previously been shown to play similar roles in both the structure of bioactive glasses and also within the body[31-33]. As such, it is not available as an option for compositional adjustment. In addition, yttrium (Y3+) and cerium (Ce3+) are also included in these glass formulations as they have been shown to increase the stability of the glass network and decrease dissolution[24, 34]. Additional network forming ions may only produce a marginal decrease in glass dissolution and convolute the determination of the effect Y3+ and Ce3+ have on the properties of these glasses. The effects of Y3+ and Ce3+ are of significant interest as excess Ca2+ not only results in calcination and excitotoxicity, but also triggers the production of ROS at the injury site. This causes problems in adjacent tissues, where under oxidative stress, a reduction in the ability of the nerve tissue to regenerate and also supporting tissues to aid in recovery is evident[35]. Y3+ and Ce3+ have been incorporated with the aim of harnessing the ROS scavenging abilities described by Schubert et al[9]. In this study, yttria and ceria nanoparticles were found to directly scavenge ROS and provide neuroprotection to cells under oxidative stress, and has been supported in subsequent work[9, 36]. The antioxidant capacity is attributed to their structure as oxides. In light of these studies, thermal treatment of the glasses may result in the development of Y and Ce oxide phases capable of ROS scavenging. Therefore, in an effort to reduce the dissolution and produce ROS scavenging Y and Ce oxide phases, glasses will be thermally treated at high and low temperatures to produce glass-ceramics. These glass-
5
ceramics will be evaluated using XRD, SEM, and shrinkage to evaluate the phases produced and resulting differences in physical properties. Dissolution will be evaluated based on inductively coupled plasma-optical emission spectroscopy (ICP-OES) ion release and antioxidant capacity will be evaluated for both ground disks and extracts using the ABTS assay. The work herein aims to characterize the properties and antioxidant potential of Y/Ce glass-ceramics for reducing oxidative stress after nerve injury.
2 MATERIALS & METHODS
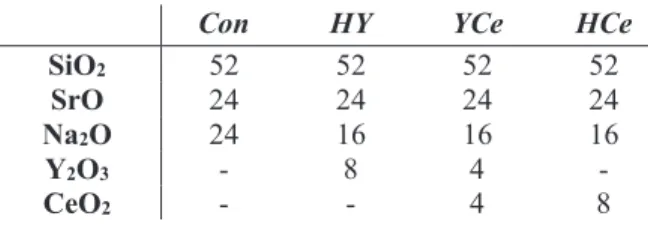
2.1 Glass Synthesis
Four glasses of varying composition were formulated for this study, one containing yttrium (HY), one with cerium (HCe), a glass containing both yttrium and cerium, (YCe), and one SrO- Na2O-SiO2 control glass, (Control). The Y2O3 and CeO2 are incorporated into each glass at the expense of Na2O. Glass compositions (mol%) can be found in Table 1. Glass powders were prepared by weighing out appropriate amounts of analytical grade reagents (Fisher Scientific, PA, USA) and ball milling (1 h). The mix was then oven dried (100ºC, 1 h), fired (1500ºC, 1 h) in a platinum crucible and shock quenched in water. The resulting frit was dried, ground and sieved to retrieve glass particles <20 μm. Glass powders were ball milled for 24 hours with <75 μm polyvinyl alcohol (PVA) added at 10 wt% to act as a binder when producing disk samples.
2.2 Design of Thermal Profile
Hot stage microscopy (HSM) (Mistura 3.32) was used to obtain the sintering temperature (Ts) at 5% height reduction, for each glass. Samples were formed using glass particulates mixed with Isopropyl Alcohol pressed into a stainless-steel die. The samples were then ejected onto an alumina plate and centered in the HSM furnace for optimal imaging. The samples were heated at a rate of 10°C/min from 30°C to 400°C [5°C/min up to 975°C, and 2°C/min to the final temperature of 1300°C] and images were collected every 12 seconds.
A SDT Q600 Simultaneous Thermal Gravimetric Analyzer-Differential Scanning Calorimetry (TGA-DSC) (TA Instruments, DW, USA) was used to obtain a thermal profile (figure 1) of each glass-PVA particulate, specifically monitoring the PVA burnout, as the Tg and
6
crystallization temperatures have been previously determined[34]. A heating rate of 10°C/min was employed in an air atmosphere using alumina as a reference in a matched platinum crucible.
Sample measurements were carried out every 6 seconds between 30°C and 500°C. TA Universal Analysis software (TA Instruments, DW, USA) was used to process the data.
2.3 Sample Preparation
2.3.1 Disk Production
A 12 mm Ø stainless steel die was used to press 0.5 g of powder at a pressure of 8 tonnes of pressure. The disks were heat treated at two processing temperatures (Tp1 and Tp2), where the heating profile and processing temperatures are given in figure 1. Processing temperatures were selected at the glass transition (Tg), 50°C above Tg (Tg+50), sintering (Ts), and 1st crystallization (Tc1) temperatures for each individual glass. Thermally treated disks are denoted by annealed disks (A), heated to a max of Tg/Tg+50, and sintered disks (S), heated to Ts/Tc1.
Disk thickness and diameter were measured with digital calipers before and after thermal treatment (n = 15). Averaged values for each glass-thermal treatment combination were used to calculate the average diameter and thickness of each disk type. The shrinkage was calculated according to the following equation:
ݏ݄ݎ݅݊݇ܽ݃݁ሺΨሻ ൌ ௫ି௫
௫ ͳͲͲ (1)
where Xi = the initial average thickness or diameter, and Xt = the average thickness or diameter after thermal treatment.
2.3.2 Cytocompatibility Studies Extracts.
Disk samples were employed for ion release studies as presented in 2.5 below and liquid aliquots were removed and set aside for cell culture testing after 1, 7 and 14 days of incubation. A 1.5mL aliquot from each sample extract was removed into a sterile vial to be used for cytocompatibility studies.
2.4 High Temperature X-Ray Diffraction (XRD)
Powders were analyzed using a custom high temperature XRD furnace using a Siemens D5000 XRD unit with a Vantec1 linear position-sensitive detector. Cu Kα radiation was used, and
7
measurements were collected over an angular range of 10–70o 2θ with scan rate of 2.25o/min.
Patterns were measured at RT (30oC) and from 520 - 1000oC in steps of 20oC. Samples were heated at a rate of 20oC/min and then cooled at 60oC/min. All measurements were performed in static air.
2.5 Ion Release Studies
Sterile liquid extracts were prepared by incubating glass-ceramic disks (n = 3/time period/composition) in sterile 15 mL centrifuge tubes with 5 mL simulated body fluid (SBF) due to the ion content mimicking that of human blood plasma, prepared by the method described by Koboku et al[20]. Disks in tubes without SBF (t = 0/“non-incubated”) and tubes containing only SBF were used as controls. SBF containing tubes were sealed and incubated for 1, 7 and 14 days.
Upon removal, each sample was filtered (Amicon Ultra-4 Centrifugal Filters, Fisher Scientific, PA, USA) to ensure particle free extracts. The ion release profile of each glass-ceramic and SBF- only samples were measured using Inductively Coupled Plasma–Optical Emission Spectroscopy (ICP – OES) on a Perkin-Elmer Optima 8000 (Perkin Elmer, MA, USA) with a detection limit
<0.1 μg/mL. ICP – OES calibration standards for Si, Sr, Na, Y, and Ce, were prepared from stock solutions (Perkin-Elmer, MA and Fisher Scientific, PA, USA). Na content in SBF solution is presented as the difference in Na content of incubated samples relative to SBF-only samples.
2.6 Antioxidant Capacity
Evaluation of the antioxidant capacity of the glass-ceramic disks was conducted using an 2,2'-azino-bis(3-ethylbenzothiazoline-6-sulphonic acid (ABTS) assay and Trolox® as a standard for comparison. A 7 mM ABTS, 2.45 mM potassium persulfate solution was prepared in DI water and incubated in the dark at room temperatures for 12 hrs. The solution was then diluted to obtain an absorbance of 2.55 ± 0.07. A 50 mM Trolox® solution was prepared by dissolving 25 mg Trolox® in 150 μL methanol and adding 1.747 mL DI water and 103 μL 1M NaOH to a final pH of 7.3. Dilutions were made in the range 0.5 mM–10 mM to obtain a Trolox® standard curve.
Standards, glass-ceramic powders, and extracts (n = 3) were added (10 mg or 25μL) to 0.5 mL ABTS solution in a 1.5 mL centrifuge tube, sealed and vortexed (ground disk samples were centrifuged using an 5415 D centrifuge, Eppendorf, Westbury, NY, USA at 3000 rpm for 2 min) then 100 μL (n = 4) of each sample was pipetted into a 96-well plate. Plates were read at 734 nm using a μQuant Microplate Spectrophotometer to obtain the absorbance. A one-way analysis of variance (ANOVA) was employed to compare the difference in antioxidant capacity between time
8
periods for each glass and between glass-ceramic powders/extracts. Comparison of relevant means was performed using the post hoc Bonferroni test. Differences between groups was deemed significant when p < 0.05.
2.7 Cytocompatibility Evaluation
MC-3T3-E1 Osteoblasts (ATCC CRL-2593) were maintained on a regular feeding regime with Medium 199 Media (w/Earl’s balanced salts and L-glutamine) or Minimum Essential Medium (MEM) Alpha Media (w/L-glutamine, ribonucleosides, and deoxyribonucleosides), respectively, both supplemented with 10% fetal bovine serum (FBS) in a cell culture incubator at 37°C/5%CO2/95%air atmosphere. Cells were seeded into 96-well plates at a density of 104 cells/well and incubated for 24 hrs. Liquid extracts were used for testing (n=9) for each composition, and heat treatment regime after 1-, 7- and 14-days incubation in SBF.
Cytocompatibility was tested using the methyl thiazolyl tetrazolium (MTT) assay. 10 μL of MTT reagent was added to each well and incubated for 4 hours (37°C/5%CO2). After incubation each well was aspirated and 100 μL of MTT solubilization solution (10% Triton X-100 in acidic (0.1M HCl, Isopropanol) was added, and mixed by gently pipetting at half the well volume (50 μL). Once the crystals were fully dissolved, the absorbance was measured at 570 nm using a μQuant Microplate Spectrophotometer (Bio-tek Instruments Inc., VT, USA). Media wells with the SUPDI water control samples were used to determine the background effect and a control cell population was assumed to represent 100% viability to normalize the readings.
9 3 RESULTS
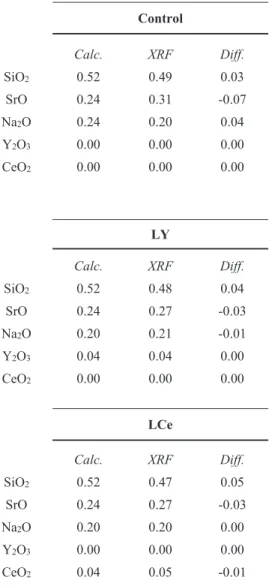
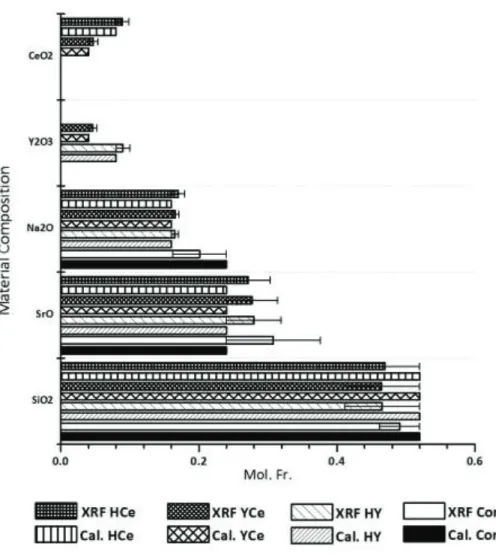
Initial characterization of these materials has previously been conducted by the authors where each glass composition was determined to be amorphous by X-ray Diffraction (XRD) with a particle size ranging from 4.2 – 4.6 Pm as measured by particle size analysis (PSA)[34, 37]. Regarding this study, X-ray fluorescence (XRF) was the primary characterization method and was employed to analyze each of the glass batch compositions to that of the experimental determinations (figure 2, table 3). SiO2 levels were consistent for each of the glasses ranging from 44 – 52 mol% where the batch composition for each glass was 52 mol%. Similarly, SrO levels were consistent with the batch calculations at 24mol% and ranged from 24-28mol% as determined by XRF. Na2O XRF concentrations were consistent for the Control Glass at 24mol% when compared to the batch composition (24mol%). The experimental glasses HY, YCe and HCe also presented consistent batch Na2O concentrations to the XRF analysis at 16mol%. The CeO2 and Y2O3 concentrations were only determined for the HCe, YCe and HY as these are not present in the Control glass composition. Both CeO2 and Y2O3 were determined to range from 3-4 mol% for the YCe by XRF, which correlates with the batch composition where each were calculated at 4mol%. For the HCe XRF analysis was found to be 9mol% for CeO2, and for HY 9 mol% was also determined for Y2O3, similar to the calculated composition of 8mol% for each.
Glass-PVA powders were monitored for burnout of the polymer phase used to stabilize the powder pellets during pressing (figure 3). PVA weight loss between 200°C and 500°C was 81%, followed by Control-PVA at 11%, and the Y and Ce containing glasses-PVA from 7-8%.
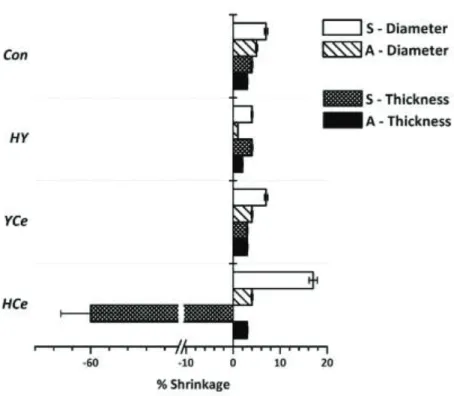
Shrinkage of the disks and changes in thickness and diameter were monitored after thermal processing and the data is presented in figure 4. Samples for each composition were produced by thermal processing (figure 1) to anneal (A) the samples and retain a degree of amophicity or induce full crystallization by controlled heat treatment at the sintering temperature (Ts), and the resulting samples are denoted S. Changes in thickness and diameter were similar between A and S samples for Control, HY and YCe ranging from 2-4%. Diameter shrinkage ranged from 1% (HY-A) to 7%
(Control-S and YCe-S), with the remaining disks at 4-5%. HCe-A shrinkage was within the previously mentioned ranges at 3% for thickness and 4% in diameter, however HCe-S experienced the most prominent changes where the thickness expanded by 60% with a diameter shrinkage of 17%.
10
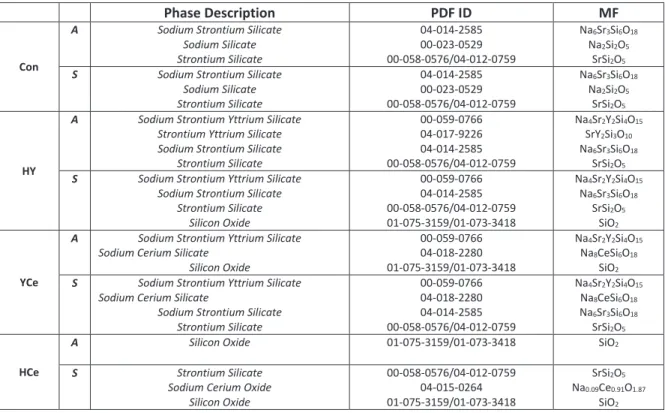
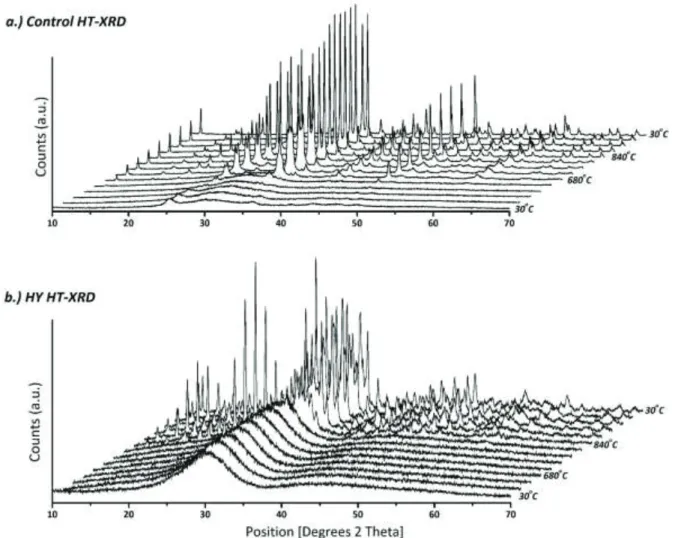
High Temperature X-ray diffraction (HT-XRD) was used to analyze changes in each materials structure (annealed - A and sintered – S) as a function of temperature and the results for Control Glass and HY are presented in figure 5a and 5b, while the results for HCe and YCe are presented in figure 6a and 6b. Evolution of crystallinity can be seen for each set of disks where A- samples exhibit partial crystallinity at their processing temperature (Tg), while S-disks show full crystallization at their respective sintering temperature (Ts). Regarding the Control, partial crystallinity was observed early in the heat treatment and amorphicity was lost at approximately 640oC. Crystal phases for the control were identified as Na6Sr3Si6O18, Na2Si2O5 and SrSi2O5 (table 2, figure 5a). For the HY samples, the initial glass samples were fully amorphous and experienced partial crystallinity at approximately 640oC and experienced full crystallinity at 840-880oC. The HY-A samples presented the crystalline phases Na4Sr2Y2Si4O15, SrY2Si3O10, Na6Sr3Si6O18, and SrSi2O5, while the HY-S samples presented Na4Sr2Y2Si4O15, Na6Sr3Si6O18, SrSi2O5 and SiO2 (table 2, figure 5b). Regarding the HCe composition, partial crystallinity was present at 720oC and amorphicity was retained until approximately 720-760oC. For the HCe-A samples, the only crystalline species was identified as SiO2. The HCe-S sample experienced more extensive crystalline phases and they were identified as SrSi2O5, Na0.09Ce0.91O1.87 and SiO2 (table 2, figure 6a). The crossover composition YCe retained some of its amorphous character until 800-840oC.
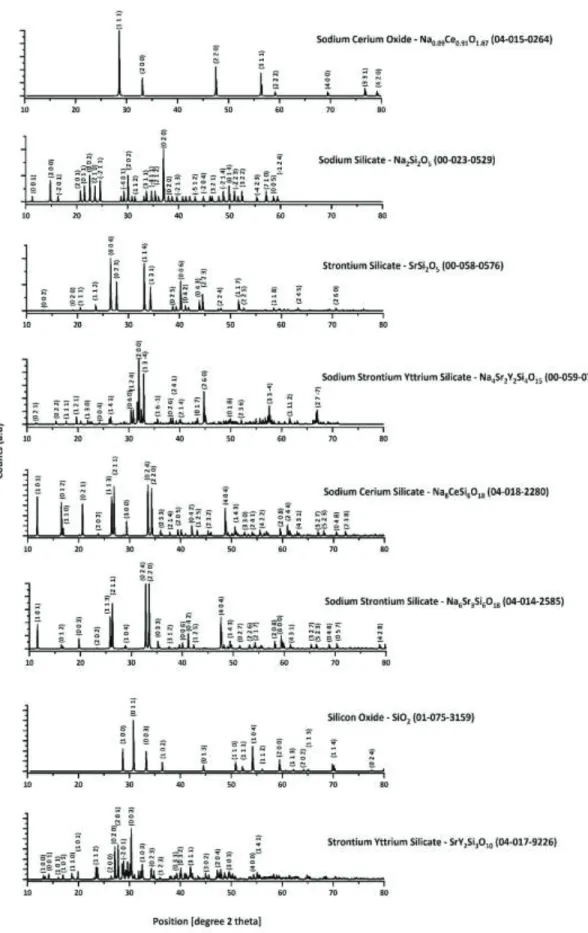
The crystalline species identified with YCe-A were Na4Sr2Y2Si4O15, Na8CeSi6O18 and SiO2, while the crystalline phases identified for YCe-S were Na4Sr2Y2Si4O15, Na8CeSi6O18, Na6Sr3Si6O18 and SrSi2O5 and the corresponding data is presented in table 2, figure 6b. The hkl planes for each crystalline phase is presented in figure 7.
Ion release data from each composition after annealing (A) and sintering (S) is presented in figure 8. Regarding the Control-A, Si4+ reaches a maximum of 1550 μg/mL after 7 days incubation, decreasing to 580 μg/mL at 14 days (figure 8a). Control-S shows a similar trend where Si4+ release reaches a maximum 950 μg/mL after 7 days and decreases to 720 μg/mL after 14 days.
Regarding the Y3+ and Ce3+ containing disks, i.e. HY, YCe, HCe, Si4+ release was greatly reduced and ranged from 190 μg/mL to 320 μg/mL over the 14 day period without any significant difference in ion release that can be attributed to thermal treatment. Sr2+ release shows trends opposite those of Si4+ where a maximum release of 13 μg/mL and 24 μg/mL was reached for Control-A/S respectively. Y3+ and Ce3+ containing disks show a significant trend in increasing Sr2+
release (figure 8b) where S-disk release profiles show significantly higher release at each time
11
period. Sr2+ release for these samples ranges from 50 μg/mL from HCe-A after 1 day where a maximum of 1085 μg/mL is presented from HY-S after 14 days. A common characteristic is that Sr2+ release is higher at each time period for the S samples when compared to the A samples. Na+ release is presented in figure 7c as the difference in Na+ content in comparison with that of SBF- only samples incubated over the same time period. Similar to Si4+ release, Na+ release from Control disks is significantly greater than the other samples however, it does not experience a drop off after 14 days as experienced with Si4+. Na+ release for both glasses (Control-A and Control-S) is comparable reaching a maximum of 4475 μg/mL after 14 days incubation. Both HY-A/S and YCe- A/S samples shows an increase in Na+ release from 1 to 7 days reaching 630 μg/mL for A-samples and 409 μg/mL for S-samples. This is followed by a reduction below levels evident in SBF after 14 days. HCe-A/S disks also appear to reach a maximum release after 7 days followed by a decrease; however the significance is unclear. The release of Y3+ or Ce3+ was not detected from any of the Y3+ or Ce3+ containingmaterials, i.e. HY, YCe, HCe.
Antioxidant capacity is determined by comparing the quantity of the ABTS radical reduced by a known concentration of the antioxidant Trolox to that reduced by the sample and is given in terms of mM Trolox Equivalency (mMTE). The antioxidant capacity of the liquid extracts collected after disk incubation in SBF is presented in figure 9a and shows that the Control extracts have the greatest antioxidant capacity. Control-A extracts show an increase in antioxidant capacity up to 1.14 mMTE after 7 days and a decrease to 0.96 mMTE after 14. Control-S extracts antioxidant capacity increases over the 14 day period to 0.91 mMTE. All of the remaining samples (HY-A, HY-S, YCe-A, YCe-S, HCe-A, HCe-S) fall within the range of 0.31 – 0.51 mMTE and do not exhibit any distinct trends between each time period. Significant differences in antioxidant capacity based on time for each extract are observed for each disk type with the exception of YCe- A and HCe-S. For Control-A, each time period is significantly different from the other two, while for Control-S the 1 day value is significantly different from the 7 and 14 day values, but the two are not significantly different from each other. The remaining glasses only show significance between the values at one adjacent time period, though the time periods and trend varies. The antioxidant capacity of the solid disk samples are presented in figure 9b where the Control disks antioxidant potential is at 2.9-3.9 mMTE where the un-incubated (t=0) samples performed better than the incubated (t=7-day) samples. HCe-S un-incubated reached 1.7 mMTE, however the remaining samples fell within the range of 0.8-1.2 mMTE. Significant differences exist between t
12
= 0 and t=7-day samples was found for Control-A, HY-S, and both HCe disk types, where the t = 0 samples showed higher antioxidant capacity. Another trend is observed through the differences that exists as a function of time (t=0 vs t=7 day). For each sample tested there is a slight reduction in antioxidant potential after incubation for 7 days. It was also evident that the S-samples preform significantly better than their A counterparts; the exception is YCe where the opposite is observed.
Cytocompatibility testing was conducted using liquid extracts for each composition and heat treatment (A and S) after 1, 7 and 14 days incubation and the resulting data is presented in figure 10. It is evident that there is relatively little difference between the heat treatment samples A and S, and at each time period there is no significant reduction in cell viability for any of the compositions tested, at any time period. Cell viability was observed to increase (>100%) more frequently for the A samples for Control, HY, YCe and HCe. Overall, no significant reduction in cell viability was observed for any of the compositions tested.
4 DISCUSSION
In an effort to reduce the dissolution of the original glass series thermal processing was utilized to crystalize disk samples from each composition. Initial burnout of the polymer phase prior to reaching the lowest processing temperature is confirmed through thermal analysis where of the 10% addition all Y and Ce glasses reached 7-8% weight loss corresponding to the 81%
observed in the PVA sample by 500°C. Con reached 11% weight loss which can be attributed to its small particle size and highly reactive nature [24], where the additional 3% is due to loss of free water and –OH groups from the surface[26]. Following the burnout of the PVA and approaching the processing temperature, glasses are expected to follow similar sintering behavior to that which is seen in 45S5 Bioglass, beginning with the initial phase of densification just after the Tg is reached through viscous flow, onset of crystallization where viscosity increases preventing viscous flow, and secondary densification where increasing temperatures cause viscosity decrease and viscous flow to resume[38]. Using HSM, the highest processing temperature used for each disk type corresponded to a 5% volume reduction. Shrinkage calculations suggest each sample reached 1- 7% of both thickness and diameter with minimal differences between disks processed at high (S) versus low (A) temperatures with the exception of HCe-S. The similarity in shrinkage may be a result of the heating rate. A study by Bretcanu et al found the heating rate to correlate with the magnitude of shrinkage, where at a heating rate of 10°C/min 45S5 powder forms reached a
13
maximum shrinkage of 6% at 900°C[38]. This suggests that the heating rate of 10°C/min selected for this work limited the shrinkage around 6%, and coupled with the holding temperatures selected, A-disks were likely held in the temperature range favoring viscous flow for the duration of their thermal treatment, while S-disks were heated through the region allowing viscous flow into the plateau where viscosity is too high due to crystallization and neither entered the second densification. The HCe-S samples are the exception to this where thickness expansion and diameter shrinkage relates to an overall expansion of the disk samples. One consideration for this is that the Ts is greater than the Tc and may also approach the temperature required for second densification. Therefore, upon thermal treatment these samples pass through the viscous flow and crystallization regions to reach the sintering temperature and returned to the Tc. HCe HSM trace reveals a 10% volume increase initiating around 1100°C and peaking at nearly 1150°C. While the maximum processing temperature for these samples was 963°C, HSM was running at a rate of 2°C/min and the samples were treated at a rate 10°C/min. Bretcanu’s study also shows the effect of heating rate on different characteristic temperatures where Tg and Tc increase with increasing heating rate and onset Tm decreases. It is possible that the onset of the expansion seen in the HSM trace occurred at a lower temperature during the thermal treatment as a result of the increased heating rate. In conjunction with a potential onset temperature decrease, the furnace may have slightly overshot approaching the target temperature. The expansion seen in the HSM trace and HCe-S disks suggest the release of a gaseous phase resulting in swelling of the samples. This is not observed in the other HSM traces and can therefore be attributed to the presence of Ce, despite the presence of Ce in the YCe disks for which a study by Li et al may also support an explanation.
The reduction of Ce4+ to Ce3+ at higher temperatures (~1000°C) is associated with structural expansion of the unit cell by 17% and creation of oxygen vacancies for charge compensation. This combination likely produces the expansion seen in the HCe-S samples[39]. This does not appear in the YCe HSM traces as Y has been shown to reduce the reduction of Ce4+ to Ce3+ as well as stabilize the transition[39]. The presence of Ce crystallites in the HCe-S glass-ceramic confirmed by the identification of a sodium-cerium-oxide phase (suggesting Na+ was charge compensating within the glassy network) in the corresponding XRD patterns, both of which are only observed in the HCe-S disk; lending further support to the Ce reduction mediated expansion characteristic of the HCe-S disks. The Control disks XRD patterns present the primary sodium-strontium-silicate and secondary strontium-silicate phases, which can be compared to the sodium-calcium-silicate and
14
calcium-silicate phases commonly generated during typical bioactive glass sintering [26, 38, 40], and are prominent in each Y3+ and Ce3+ containing disk suggesting that despite the complete crystallinity, dissolution and HCA layer formation may still occur.
Ion release studies reveal Con-A/S disks are reactive in SBF and release significantly higher levels of Si4+ and Na+ and lower levels of Sr2+ than the Y3+ and Ce3+ containing disks. Si4+ release approaching 1550 μg/mL exceeds typical levels released by bioactive glasses where a solubility limit is reached at 120 μg/mL up to a pH of 9; this suggests that the pH of the extracts are slightly higher where the solubility limit begins to increase exponentially[41, 42]. The maximum value of Si4+ release from the Control disks 10x lower than that observed from the original glass powders, though a similar drop-off in concentration is observed after 7 days incubation. This suggests that the Si4+ release reaches the solubility limit after 7 days and proceeds to precipitate over the duration of the 14 day time period, though at a lower pH and corresponding concentration than that of the original glass powders[43]. Na+ is typically found in physiological fluids at concentrations ranging from 2,500-3,500 μg/mL[20, 44]; the original glass and Control-A/S disks Na+ release exceeds these levels with only a minor decrease associated with the thermal treatment, though the rate of release was slowed reaching a maximum release at 14 days in comparison to the first day[24]. Sr2+, which was released in excess from the original glasses at a maximum of 100 μg/mL, decreased to a maximum of 13 -24 μg/mL from the Con-A/S disks bringing it into the range found to support healthy bone mineralization[45, 46]. Ion release levels for Control disks are still high but a reduction in Si4+ and Sr2+ release by a factor of 10 upon thermal treatment will likely reduce the associated toxicity to levels seen for the original Y3+ and Ce3+ containing glasses with similar release[24]. Si4+
release from HCe disks decreased by a factor of 2 from the original glasses and showed only minimal decreases by HY and YCe disks. These levels were found to pose minimal toxicity to fibroblasts and osteoblasts through cell viability assays[24, 25]. With the exception of HCe-A, Na+ released by the Y3+ and Ce3+ containing disks increases over the initial 7 days of incubation with a maximum of 630 μg/mL which is well within physiological levels. HCe-A is the exception where Na+ release remains within physiological levels but peaks at 1525 μg/mL and subsequently precipitates to 66 μg/mL. Sr2+ release for the original glasses fell within the optimum range from 10.6 to 0.9 μg/mL, however, these levels are dramatically higher levels from the Y3+ and Ce3+
containing disks. While Sr2+ levels are excessive, any excess is excreted through the kidneys in the same manner as Ca2+, thereby reducing the potential for toxic effects[46, 47]. In addition, disks
15
treated at higher temperatures exceed the Sr2+ concentrations compared to those treated at lower temperatures. This is indicative of structural effects associated with thermally treating the disks where Y3+ and Ce3+ are able to adopt optimum configurations causing Sr2+ to sit in weaker network positions, and allowing for freedom of movement through particular phases, network channels, or phase boundaries. Further work is required to clarify the structural role of Sr2+ within the network and describe the significantly increased propensity for dissolution from the glass-ceramic network.
Y3+ and Ce3+ are retained within the glass-ceramic network as seen with the original glasses and is in agreement with the literature[34, 48, 49].
Y3+ and Ce3+ were incorporated in the glass composition with the aim of developing structures within the glass network similar to those present in yttria and ceria nanoparticles that have previously been shown to provide protection to damaged nerve tissue from oxidative stress.
It is clear in both the ground disks and liquid extracts from incubation in SBF, that the Control samples show the greatest propensity for ROS scavenging. In addition, the antioxidant capacity associated with the solid disk samples is double that of the liquid extracts, and the Control disks have double the capacity of the Y3+ and Ce3+containing disks. Therefore, in these glass-ceramics Y3+ and Ce3+ can be considered inhibitors of ROS scavenging. Since Y3+ and Ce3+ are known to increase the rigidity of the glass network which leads to reduced solubility it may follow that the antioxidant capacity is related to the reactivity of both the surface and dissolution products[34, 48-
51]. The lack of Y3+ and Ce3+ in the extracts further eliminates them as a source for the ROS scavenging ability of these glass-ceramics. Therefore, it is likely due to the silanol surface (Si-OH) and possibly negatively charged silicic acid species that may be present in the extracts[52-54]. The negatively charged surface or extract species may account for the neutralization of the ABTS radical cation through strong electrostatic interactions or electron donation[54, 55]. Cytocompatibility studies however, show that despite the differences in ion release from each of the materials, no significant decrease in osteoblast viability was observed. It is likely that modifications to the glass composition, i.e. increase in network modifiers, changing the concentration of Y3+ and Ce3+ will result in a less rigid network in the HY, YCe and HCe starting glasses. This may result in a network the is more soluble, and more favorable to the Y3+ and Ce3+
forming antioxidant structures.
16 5 CONCLUSIONS
The thermal treatment of Y3+ and Ce3+ glasses were shown to produce glass-ceramics with varying degrees of crystallinity and associated shrinkage with the exception of the HCe-S samples which exhibits an expansion due to Ce4+ reduction. The resulting phases reduce Si4+ and Sr2+
release from Con-A/S samples while Na+ release remained consistent. Y3+ and Ce3+ containing disks shows a significant increase in release of Sr4+ after thermal treatment, exceeding levels found to promote bone mineralization. Antioxidant capacity remained at 2.9-3.9 mMTE for treated Control disks and fell to < 1 mMTE for the Y3+ and Ce3+ glass-ceramics. Therefore, the formation of glass-ceramics partially reduces solubility, while maintaining antioxidant capacity. Minor changes to the glass composition may result in enhancing the antioxidant capacity, however it is highly beneficial that these glass compositions did not cause any cytotoxicity and will likely present excellent bioactivity. Antioxidant improvement and the potential for bioactivity through the deposition of a HCA layer will therefore be the subject of future work.
Funding Source.
This research received no specific grant from any funding agency in the public, commercial, or not-for-profit sectors
Acknowledgements.
The authors wish to gratefully acknowledge Prof. Scott Misture and the use of the X-ray Diffraction Laboratory at Alfred University for the collection of High Temperature -X-Ray Diffraction data.
The Author(s) declare(s) that there is no conflict of interest.
17
Table 1. Glass Compositions in Mol%.
Con HY YCe HCe
SiO2 52 52 52 52
SrO 24 24 24 24
Na2O 24 16 16 16
Y2O3 - 8 4 -
CeO2 - - 4 8
Table 2. PDF and Molecular Formula (MF) for identified phases.
Phase Description PDF ID MF
Con
A Sodium Strontium Silicate Sodium Silicate Strontium Silicate
04-014-2585 00-023-0529 00-058-0576/04-012-0759
Na6Sr3Si6O18
Na2Si2O5
SrSi2O5
S Sodium Strontium Silicate Sodium Silicate Strontium Silicate
04-014-2585 00-023-0529 00-058-0576/04-012-0759
Na6Sr3Si6O18
Na2Si2O5
SrSi2O5
HY
A Sodium Strontium Yttrium Silicate Strontium Yttrium Silicate Sodium Strontium Silicate
Strontium Silicate
00-059-0766 04-017-9226 04-014-2585 00-058-0576/04-012-0759
Na4Sr2Y2Si4O15
SrY2Si3O10
Na6Sr3Si6O18
SrSi2O5
S Sodium Strontium Yttrium Silicate Sodium Strontium Silicate
Strontium Silicate Silicon Oxide
00-059-0766 04-014-2585 00-058-0576/04-012-0759 01-075-3159/01-073-3418
Na4Sr2Y2Si4O15
Na6Sr3Si6O18
SrSi2O5
SiO2
YCe
A Sodium Strontium Yttrium Silicate Sodium Cerium Silicate
Silicon Oxide
00-059-0766 04-018-2280 01-075-3159/01-073-3418
Na4Sr2Y2Si4O15
Na8CeSi6O18
SiO2
S Sodium Strontium Yttrium Silicate Sodium Cerium Silicate
Sodium Strontium Silicate Strontium Silicate
00-059-0766 04-018-2280 04-014-2585 00-058-0576/04-012-0759
Na4Sr2Y2Si4O15
Na8CeSi6O18
Na6Sr3Si6O18
SrSi2O5
HCe
A Silicon Oxide 01-075-3159/01-073-3418 SiO2
S Strontium Silicate
Sodium Cerium Oxide Silicon Oxide
00-058-0576/04-012-0759 04-015-0264 01-075-3159/01-073-3418
SrSi2O5
Na0.09Ce0.91O1.87
SiO2
18
Table 3. Tabulated data for the X-ray Fluorescence (XRF) results, the batch calculated composition for each glass compared o the composition determined using XRF.
Control HY
Calc. XRF Diff. Calc. XRF Diff.
SiO2 0.52 0.49 0.03 0.52 0.47 0.05
SrO 0.24 0.31 -0.07 0.24 0.28 -0.04
Na2O 0.24 0.20 0.04 0.16 0.17 -0.01
Y2O3 0.00 0.00 0.00 0.08 0.09 -0.01
CeO2 0.00 0.00 0.00 0.00 0.00 0.00
LY YCE
Calc. XRF Diff. Calc. XRF Diff.
SiO2 0.52 0.48 0.04 0.52 0.46 0.06
SrO 0.24 0.27 -0.03 0.24 0.28 -0.04
Na2O 0.20 0.21 -0.01 0.16 0.17 -0.01
Y2O3 0.04 0.04 0.00 0.04 0.05 -0.01
CeO2 0.00 0.00 0.00 0.04 0.05 -0.01
LCe HCe
Calc. XRF Diff. Calc. XRF Diff.
SiO2 0.52 0.47 0.05 0.52 0.47 0.05
SrO 0.24 0.27 -0.03 0.24 0.27 -0.03
Na2O 0.20 0.20 0.00 0.16 0.17 -0.01
Y2O3 0.00 0.00 0.00 0.00 0.00 0.00
CeO2 0.04 0.05 -0.01 0.08 0.09 -0.01
19
Figure 1. Thermal treatment profile and processing temperatures for annealed (A) and sintered (S) disks.
20
Figure 2. X-ray Fluorescence of each of the starting materials comparing calculated (Cal.) compositions to XRF analyzed compositions.
21
Figure 3. Weight change of PVA and glass-PVA powders up to 500°C.
Figure 4. % shrinkage of Con, HY, YCe and HCe disks after thermal processing.
22
Figure 5. High Temperature X-ray Diffraction profiles of a.) Con and a.) HY materials from room temperature to
~1000oC.
23
Figure 6. High Temperature X-ray Diffraction profiles of a.) HCe and b.) YCe materials from room temperature to
~1000oC.
24
Figure 7. hkl planes for each crystalline phase identified for each composition as presented in table 2.
25
Figure 8. Ion release profiles determined for a.) Si, b.) Sr and c.) Na from Con, HY, YCe and HCe after 1-, 7- and 14-days incubation in Simulated Body Fluid (SBF).
26
Figure 9. Antioxidant capacity of Con, HY, YCe and HCe considering efficacy of a.) liquid extracts and b.) solid disk samples.
27
Figure 10. MTT testing of Control, HY, YCe and HCe liquid extracts using MC 3T3 Osteoblasts after 1, 7 and 14 days incubation.
1. Tohda C and Kuboyama T. Current and future therapeutic strategies for functional repair of spinal cord injury. Pharma Therap 2011; 132 (1): 57-71.
2. Bartholdi D and Schwab ME. Degeneration and regeneration of axons in the lesioned spinal cord. Phys Rev 1996; 76(2): 319-70.
3. Stichel CC and Müller HW. Experimental strategies to promote axonal regeneration after traumatic central nervous system injury. Prog Neurobio 1998; 56 (2): 119-48.
4. Dugan L, Sensi S, Canzoniero L, Handran S, Rothman S, Lin T, Goldberg M and Choi D.
Mitochondrial production of reactive oxygen species in cortical neurons following exposure to N-methyl-D-aspartate. J Neurosci 1995; 15 (10): p. 6377-88.
5. Tymianski CH and Tator M. Normal and abnormal calcium homeostasis in neurons: a basis for the pathophysiology of traumatic and ischemic central nervous system injury. Neurosur 1996; 38(6): 1176-95.
28
6. Choi DW. Calcium and excitotoxic neuronal injury. Ann New York Acad Sci 1994; 747(1):
162-71.
7. Wolf JA, Stys PK, Lusardi T, Meaney D and Smith DH. Traumatic axonal injury induces calcium influx modulated by tetrodotoxin-sensitive sodium channels. J Neurosci 2001;
21(6): 1923-30.
8. LoPachin RM and Lehning EJ. Mechanism of calcium entry during axon injury and degeneration. Tox App Pharma 1997; 143(2): 233-44.
9. Schubert D, Dargusch R, Raitano J and Chan S-W. Cerium and yttrium oxide nanoparticles are neuroprotective. Biochem Biophy Res Comm 2006; 342(1): 86-91.
10. Hench LL. The story of Bioglass. J Mat Sci:Mat Med 2006; 17: 967-978.
11. Jones JR. Review of bioactive glass: from Hench to hybrids. Acta Biomater 2013; 9: 4457- 4486.
12. Rahaman MN, Day DE, Sonny Bal B, Fu Q, Jung SB and Bonewald LF. Bioactive glass in tissue engineering. Acta Biomater 2014; 7: 2355-73.
13. Chen QZ, Thompson ID and Boccaccini AR. 45S5 Bioglass®-derived glass-ceramic scaffolds for bone tissue engineering. Biomat 2006; 27(11): 2414-2425.
14. Vargas GE, Mesones RV, Bretcanu O, López JMP, Boccaccini AR and Gorustovich A.
Biocompatibility and bone mineralization potential of 45S5 Bioglass®-derived glass- ceramic scaffolds in chick embryos. Acta Biomater 2009; 5(1): 374-380.
15. Wren AW, Coughlan A, Laffir FR and Towler MR. Comparison of a SiO2-CaO-ZnO-SrO glass polyalkenoate cement to commercial dental materials: Glass structure and physical properties. J Mat Sci:Mat Med 2013; 24(2): 271-280.
16. Wren AW, Coughlan A, German MJ, Hall MM and Towler MR. Comparison of a SiO2- CaO-ZnO-SrO glass polyalkenoate cement to commercial dental materials: ion release, biocompatibility and antibacterial properties J Mat Sci:Mat Med, 2013; 24: (9): 2255-64.
17. Wren AW, Boyd D, Thornton R, Cooney JC and Towler MR., Antibacterial properties of a tri-sodium citrate modified glass polyalkenoate cement. J Biomed Mat Res B: App Biomat 2009; 90-B(2): 700-709.
18. da Costa Guimaraes C, Moralles MC and Roberto Martinelli J. Monte Carlo simulation of liver cancer treatment with 166Ho-loaded glass microspheres. Rad Phys Chem 2014; 95:
185-187.
29
19. Bortot MB, Prastalo S and Prado M. Production and characterization of glass microspheres for hepatic cancer treatment. Proc Mat Sci 2012; 1(0): 351-358.
20. Kokubo T and Takadama H. How useful is SBF in predicting in vivo bone bioactivity?
Biomat 2006; 27(15): 2907-15.
21. Hoppe A, Güldal NS and Boccaccini AR. A review of the biological response to ionic dissolution products from bioactive glasses and glass-ceramics. Biomat 2011; 32(11):
2757-74.
22. Saffarian Tousi N, Velten MF, Bishop TJ, Leong KK, Barkhordar NS, Marshall GW, Loomer PM, Aswath PB and Varanasi VG. Combinatorial effect of Si4+, Ca2+, and Mg2+
released from bioactive glasses on osteoblast osteocalcin expression and biomineralization.
Mat Sci Eng C, 2013; 33(5): 2757-2765.
23. Hench LL. Genetic design of bioactive glass. J Euro Cer Soc 2009; 29(7): 1257-1265.
24. Placek LM, Keenan TJ, Coughlan A and Wren AW. Investigating the effect of glass ion release on the cytocompatibility, antibacterial efficacy and antioxidant activity Y2O3 / CeO2 doped SiO2-SrO-Na2O glass extract. Biomed Glasses 2018; 4: 32-44.
25. Placek LM and Wren AW. Cytocompatibility of Y2O3 and CeO2 Containing Bioactive Glasses to Aid in Spinal Cord Recovery. 41st Annual Northeast Bioengineering Conference (NEBEC), Troy, NY, April 17th-19th USA, 2015, https://web.northeastern.edu/nebec14/contributed-presentations/.
26. Lefebvre L, Chevalier J, Gremillard L, Zenati R, Thollet G, Bernache-Assolant D and Govin A. Structural transformations of bioactive glass 45S5 with thermal treatments. Acta Mater 2007; 55(10): 3305-3313.
27. Massera J and Hupa L. Influence of SrO substitution for CaO on the properties of bioactive glass S53P4. J Mat Sci:Mat Med 2014; 25(3): 657-68.
28. Massera J, Hupa L and Hupa M. Influence of the partial substitution of CaO with MgO on the thermal properties and in vitro reactivity of the bioactive glass S53P4. J Non-Crys Sol 2012; 358(18–19): 2701-7.
29. Wren AW, Coughlan A, Smale KE, Misture ST, Mahon BP, Clarkin OM and Towler MR.
Fabrication of CaO–NaO–SiO2/TiO2 scaffolds for surgical applications. J Mat Sci:Mat Med 2012; 23(12): 2881-91.
30
30. El-Kheshen AA, Khaliafa FA, Saad EA and Elwan RL. Effect of Al2O3 addition on bioactivity, thermal and mechanical properties of some bioactive glasses. Cer Int 2008;
34(7): 1667-1673.
31. Fredholm YC, Karpukhina N, Brauer DS, Jones JR, Law RV and Hill RG. Influence of strontium for calcium substitution in bioactive glasses on degradation, ion release and apatite formation. J Roy Soc Inter 2012; 9(70): 880-9.
32. Gentleman E, Fredholm YC, Jell G, Lotfibakhshaiesh N, O'Donnell MD, Hill RG and Stevens MM. The effects of strontium-substituted bioactive glasses on osteoblasts and osteoclasts in vitro. Biomat 2010; 31(14): 3949-56.
33. Marie PJ, Ammann P, Boivin G and Rey C. Mechanisms of action and therapeutic potential of strontium in bone. Calc Tis Int 2001; 69(3): 121-9.
34. Placek LM, Keenan TJ, Laffir F, Coughlan A and Wren AW. Characterization of Y2O3 and CeO2 doped SiO2-SrO-Na2O bioactive glasses. Biomed Glasses 2015; 1: 159-172.
35. Bains M and Hall ED. Antioxidant therapies in traumatic brain and spinal cord injury.
Bioch Biophy Acta - Mol Bas Dis 2012; 1822(5): 675-84.
36. Estevez AY, Pritchard S, Harper K, Aston JW, Lynch A, Lucky JJ, Ludington JS, Chatani P, Mosenthal WP, Leiter JC, Andreescu S and Erlichman JS. Neuroprotective mechanisms of cerium oxide nanoparticles in a mouse hippocampal brain slice model of ischemia. Free Rad Bio Med 2011; 51(6): 1155-63.
37. Placek LM, Keenan TJ and Wren AW. Bioactivity of Y2O3 and CeO2 doped SiO2-SrO- Na2O glass-ceramics. J Biomat App 2016 3(2): 165-180.
38. Bretcanu O, Chatzistavrou X, Paraskevopoulos K, Conradt R, Thompson I and Boccaccini AR. Sintering and crystallisation of 45S5 Bioglass® powder. J Euro Cer Soc 2009; 29(16):
3299-3306.
39. Li Z-P, Mori T, Ye F, Ou D, Auchterlonie GJ, Zou J and Drennan J. Cerium-Reduction- Induced Defects clustering, ordering, and associated microstructure evolution in yttrium- doped ceria. J Phys Chem C, 2012; 116(9): 5435-5443.
40. ElBatal HA, Azooz MA, Khalil EMA, Soltan Monem A and Hamdy YM. Characterization of some bioglass–ceramics. Mat Chem Phys 2003; 80(3): 599-609.
41. Plettinck S, Chou L and Wollast R. Kinetics and mechanisms of dissolution of silica at room temperature and pressure. Mineral Mag A, 1994; 58: 728-9.
31
42. Dent Glasser LS and Kataoka N. The chemistry of ‘alkali-aggregate’ reaction. Cem Con Res 1981; 11(1): 1-9.
43. Fleming BA. Kinetics of reaction between silicic acid and amorphous silica surfaces in NaCl solutions. J Coll Int Sci 1986; 110(1): 40-64.
44. Mandal R, Guo AC, Chaudhary KK, Liu P, Yallou FS, Dong E, Aziat F and Wishart DS.
Multi-platform characterization of the human cerebrospinal fluid metabolome: a comprehensive and quantitative update. Gen Med 2012; 4(4): 38-38.
45. Verberckmoes SC, De Broe ME and D'Haese PC. Dose-dependent effects of strontium on osteoblast function and mineralization. Kid Int 2003; 64(2):534-43.
46. Pors Nielsen S. The biological role of strontium. Bone, 2004; 35(3): 583-8.
47. O'Donnell MD, Candarlioglu PL, Miller CA, Gentleman E and Stevens MM. Materials characterisation and cytotoxic assessment of strontium-substituted bioactive glasses for bone regeneration. J Mat Chem 2010; 20(40): 8934-41.
48. Cacaina D, Ylanen H, Hupa M and Simon S. Study of yttrium containing bioactive glasses behaviour in simulated body fluid. J Mat Sci:Mat Med 2006; 17(8): 709-16.
49. Leonelli C, Lusvardi G, Malavasi G, Menabue L and Tonelli M. Synthesis and characterization of cerium-doped glasses and in vitro evaluation of bioactivity. J Non-Crys Sol 2003; 316(2–3): 198-216.
50. Christie JK and Tilocca A. Aluminosilicate glasses as yttrium vectors for in situ radiotherapy: understanding composition-durability effects through molecular dynamics simulations. Chem Mat 2010; 22(12): 3725-34.
51. Du J, Kokou L, Rygel JL, Chen Y, Pantano CG, Woodman R and Belcher J. Structure of cerium phosphate glasses: molecular dynamics simulation. J Amer Cer Soc 2011; 94(8):
2393-401.
52. Greenberg SA and Sinclair D. The polymerization of silicic acid. J Phys Chem 1955; 59(5):
435-40.
53. Goto K. Effect of pH on polymerization of silicic acid. J Phys Chem 1956; 60(7): 1007-8.
54. Coradin T and Livage J. Effect of some amino acids and peptides on silicic acid polymerization. Coll Sur B 2001; 21(4): 329-36.
55. Chan SH. A review on solubility and polymerization of silica. Geother 1989; 18(1): 49-56.