These results show how gene expression can be programmed via non-coding RNA regulators, and that the. To test this, Lim's group replaced native protein-protein interactions between the kinase and scaffold with heterologous interaction domains from other proteins and found that the cascade could function properly.4 The researchers extended these findings by creating synthetic scaffolds that brought together kinases. which are not naturally associated.
Construction of genetic circuits as an engineering discipline
Patterning typically involves signaling and communication between cells, processing these signals, and modulating the expression of a variety of genes. Thus, engineering underlying functionality (i.e., quorum sensing) and gene circuits enabled spontaneous patterning in a population of cells.
Nucleic acids as a substrate for designing circuits
Over the past 10 years, the discovery and characterization of a highly conserved RNA-based regulatory mechanism has fundamentally changed the understanding of the biological function of RNA in cells. The strategy of the automata is thus "hard-wired" in the structures and arrangements of deoxyribozymes.
Constraints and trade-offs with increasing complexity
Trade-offs shape circuit design and function
Heat shock causes the rapid unfolding and aggregation of many proteins in the cell, compromising normal function. Given limited cellular resources and energy, these demands are often contradictory – for example, a high turnover rate in the production of heat shock regulators is necessary for rapid response, but at the expense of metabolic efficiency.61 Recent work has shown how the architecture of the A heat shock system balances such tradeoffs.62 For example, numerous feedback and feed-forward loops have been identified that couple the induction dynamics, steady-state levels, and decay of multiple regulators of the heat shock response.
Trade-offs in life history evolution
The authors were able to propose and support a mechanism for the trade-off between reproduction and survival. In this case, a developing population is forced to optimize and balance the trade-off between fitness benefits in two different environments.
Genome-scale organization
- Organizing biology: engineering perspectives
- Optimality principles in network organization
- Game theoretic strategies for maximizing competitive ability
- Robustness as an organizing principle
The biological analogue is that the success of a given genome depends on the composition of the population. Recent work has emphasized the importance of robustness to changes in the cell's internal environment.
Open questions: from cellular to ecological networks
Can circuits be designed to produce new optimal phenotypes (for example, in terms of fitness in new environments). 3) How can ecological-scale interactions between organisms and their environment be understood in terms of regulatory networks.
Constraints on adaptive development: a functional trade-off between reproduction and rapid swimming initiation in the Trinidadian guppy (Poecilia reticulata). The Hsp90 capacitor, developmental remodeling and evolution: the robustness of gene networks and the unusual evolvability of metamorphosis.
Programmable Ligand Controlled Riboregulators of Eukaryotic Gene Expression
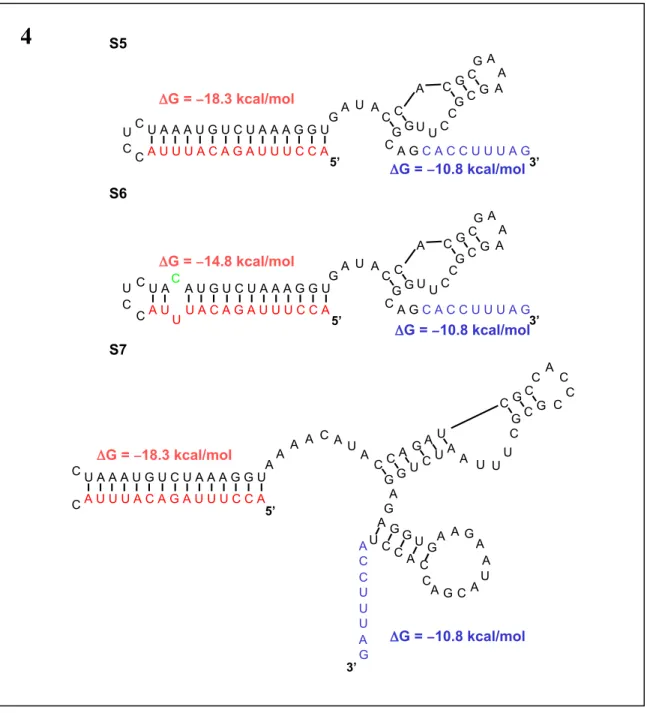
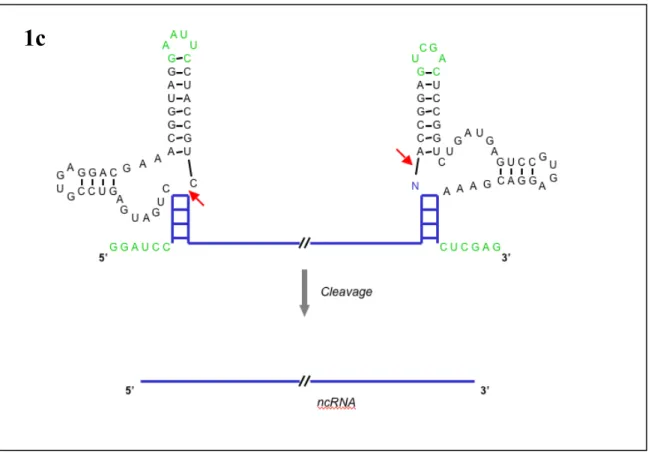
In this platform, the antisense domain is sequestered in an "antisense stem" in the absence of ligand. Ligand binding to the aptamer domain mediates a change in the conformational dynamics of the antisense stem that results in the antisense domain being in a more single-stranded form (Fig. 1a). This mutation introduces a mismatched pair into the antisense stem so that in the absence of ligand, the construct is less thermodynamically stable.
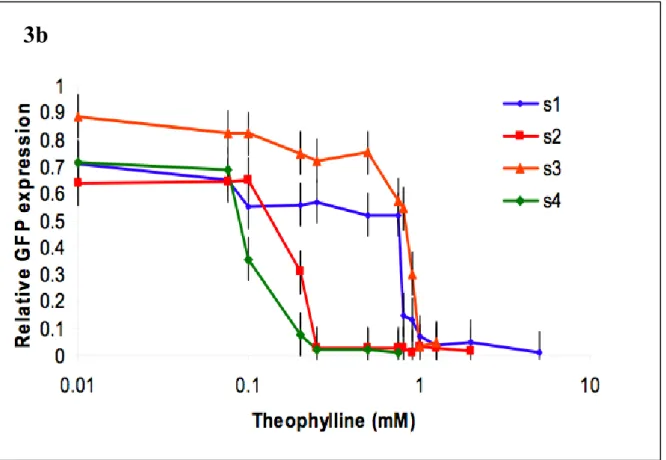
Changes in the targeting capabilities of these molecules were made by swapping the antisense stem and swapping the aptamer stem, while keeping the rest of the aptamer module the same. These strains are designed such that in the absence of ligand, the free energy of the antisense strain is lower than that of the aptamer strain. In the absence of an effector, the antisense domain is bound in a double-stranded region of the RNA called the “antisense stem,” and the antiswitch is in the “off” position.
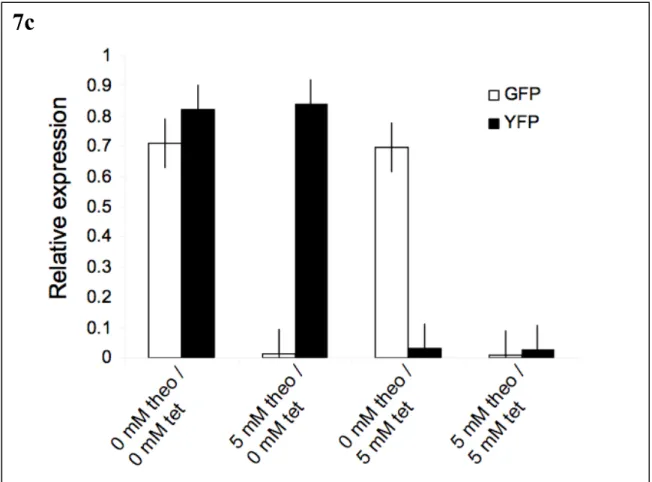
In the presence of effector, the antiswitch binds the molecule, forcing the aptamer stem to form, switching its attachment to the "on" state. On the target mRNA, the start codon is indicated in green. s8 is designed so that in the absence of theophylline, the antiswitch is "on" or the antisense domain is free to bind to its target. In the presence of theophylline, the antiswitch undergoes a conformational change to the. off” state such that the antisense domain is bound in a double-stranded RNA stem that is part of the aptamer stem.
In the presence of theophylline, an antiswitch switches its conformation to the "on" state and disables GFP production.
The Regulation of Noise in a Metabolic Gene Determines an Ecological Strategy in Yeast
We then measured the fitness of strain PGAL-DAL80 at different Dal80p levels over a range of ammonia concentrations (spanning near growth limiting to near toxic conditions)9 by direct competition with a reference strain.10 At low Dal80p expression , the engineered strain exhibited lower fitness than the parent strain at low ammonia concentrations and higher fitness with increasing ammonia concentrations (Fig. 3a). To examine the effect of noise in this system, we repeated the simulations, holding constant the average amount of enzyme while varying the noise on enzyme expression (Fig. 8a). Regulatory roles of galactose permease and kinase in the GAL network induction response in Saccharomyces cerevisiae.
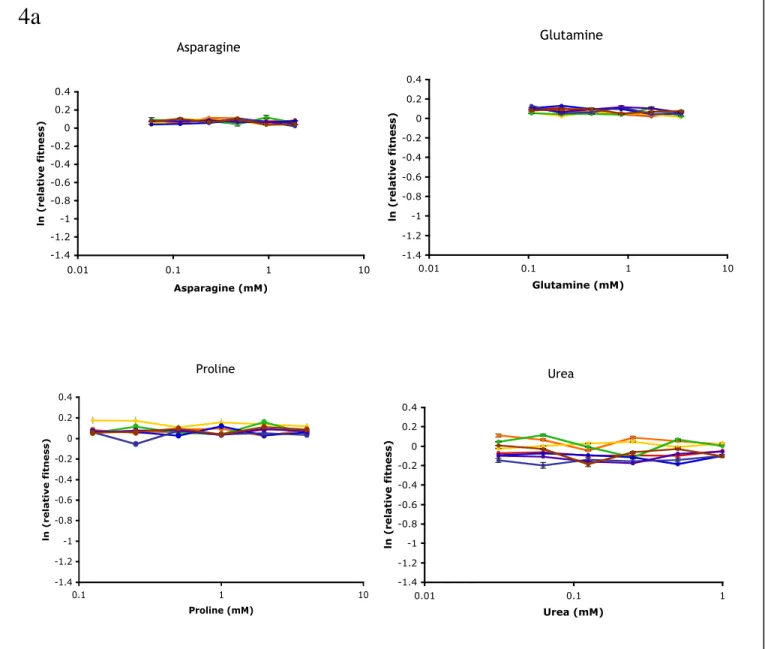
Equal amounts of the reference and PGAL-DAL80 or parental strains were mixed and grown in the indicated ammonia and galactose concentrations. The number of each strain was quantified through flow cytometry, and fitness of the PGAL-DAL80 strain is reported as the natural log frequency change over the growth period relative to the parent strain. Relative fitness of the engineered PGAL-DAL80 strain in alternative nitrogen sources at different Dal80p expression levels.
Shown is the arithmetic mean of the fluorescence population distribution relative to the parental strain, which changes little as Dal80p levels increase. The slope of product formation versus the noise trend represents the sensitivity to noise at that enzyme concentration. Fitness of the low rate strains D150H (red) and C313S (blue) relative to the parent strain at different ammonia concentrations.
Representation of the effects of noise and Gdh1p abundance in the presence or absence of Glt1p.
Yeast Use a Tit-For-Tat Strategy in Ammonia Metabolism to Establish Cooperation
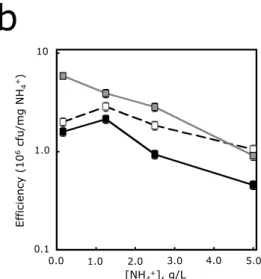
In abundant ammonia (>2.5 g/l), the wild-type and B strains showed similar growth rates, while the growth rate of the A strain was several times higher (Fig. 1a). At low ammonia concentrations, the wild-type strain switched to relatively low efficiency, similar to the A strain. We were surprised that the wild-type strain did not exhibit a growth rate and efficiency profile comparable to the defector strain.
We propose that the wild-type strategy is analogous to the tit-for-tat (TFT) strategy in the Prisoner's Dilemma. At low initial wild-type frequencies (< 0.3), the wild-type strain showed positive fitness values, indicating that it was able to invade the deserter population. The wild type showed rates similar to strain B in high ammonia and rates similar to strain A in low ammonia.
The A strain and the B strain exhibit high and low noise, respectively, while the wild-type strain exhibits low noise at high ammonia and high noise at low ammonia. At low initial frequencies (< 0.3), the wild-type strain showed w > 1, indicating that it was able to enter the defector population.
Appendix A
Riboregulator Methods and Materials
Total RNA was extracted using standard acid phenol extraction procedures.45 Briefly, cells were pelleted and frozen in liquid nitrogen. Cells were lysed by the addition of SDS to a final concentration of 1.6% and an equal volume of acidic phenol. RNA was transcribed using Ampliscribe T7 transcription kits (Epicentre) according to the manufacturer's instructions, except that transcription was performed at 42°C, and for gel shift assays, antiswitches were radiolabeled by the addition of [α-32P ]-UTP to the transcription mix.
For nuclease mapping, antiswitches were 5' end labeled with fluorescein (Molecular Probes) by adding 25 µg of phosphate-reactive labeled RNA in labeling buffer (0.12 M methylimidazole pH 9.0, 0.16 M EDAC) for 4 incubate for hours, according to manufacturer's instructions. After incubation, 10% glycerol was added to the RNA-target-ligand mixtures, and RNA complexes were separated from free RNA by electrophoresis at 125 V on an 8% polyacrylamide gel in 1X Tris-borate buffer at room temperature for several hours. For nuclease mapping, fluorescein-labeled antiswitch RNA was resuspended in buffer (50 mM Tris-HCl pH 8.0, 100 mM NaCl, 5 mM MgCl ), denatured at 65 °C for 3 min and slowly cooled to room temperature .
RNase T1 (Ambion) was added to the antiswitch ligand mixture and incubated for 15 min at room temperature. Cleavage products were visualized by laser-induced capillary fluorescence electrophoresis on a P/ACE MDQ machine (Beckman) using a single-stranded nucleic acid analysis kit (Beckman) according to the manufacturer's instructions.
Appendix B
Ecological Strategy Methods and Materials
Standard lithium acetate transformations for homologous recombination were performed as previously described. 28 Integration of the GAL promoter was performed by amplifying the GAL1-10 promoter sequence from pRS314-Gal. 29 This fragment was PCR assembled with the kanamycin resistance gene from pFA6a-ZZ-TEV -S- kanMX630 together with flanking homologous regions to the DAL80 upstream region and on chromosome XI). Similar techniques were used to integrate the GAL1-10 promoter upstream of the GDH1 coding sequence. Gene deletions were performed by amplifying the kanamycin resistance gene from pFA6a-ZZ-TEV-S-kanMX630 along with flanking homologous regions for the entire coding region of GDH1, GDH3, or GLT1.
The catalytic rate mutants D150H and C313S were constructed by amplifying genomic DNA from the GDH1 coding region with primers carrying the appropriate nucleotide substitution, assembled with the LEU2 gene from pRS315,29 and transformed as above. The first gate isolated cells that showed regular morphology based on electronic volume and side scatter, while the second gate removed non-fluorescent cells from the distribution. This gating method was compared to other previously described methods and the observed trends in density and noise were consistent between methods.32,33 Noise was calculated as the square of the coefficient of variation (σ2/p2) of the distribution.26 50,000 events were analyzed . to calculate noise for each sample.
2 µl of the acclimated population was diluted in 2 ml of synthetic complete medium containing two ammonia concentrations at 139 mM ammonia and 556 mM ammonia. 10-fold dilutions of each strain were performed and cell density of the overnight culture was measured by flow cytometry as described above.