Valentine Siagian
Vol. 6 No.2 Desember
2023
Revolutionizing Investment Strategy:
A Holistic Approach to Firm Valuation Using a Dividend Discount Model
Valentine Siagian Universitas Advent Indonesia
Abstract
This paper studied the investment decision references by comparing the market price and the firm's intrinsic value in the PEFINDO index from 2018-2021. The market value of the firms measured firm valuation, and intrinsic value was measured by the DDM model. The results showed that over 2018-2021, only three companies were consistently listed in the PEFINDO index, and all samples showed undervalued stocks. This indicated that investors could have gained more by buying stocks from the sample firms.
Keywords: Dividend discount model, firm valuation, investment decision, financial management
Valentine Siagian
Vol. 6 No.2 Desember
2023
INTRODUCTION
Investors tend to find better investment strategies from time to time. There is a need to revolutionize investment strategy, which means a significant shift or change in how investors approach investing, resulting in significant improvements in investment decision-making and performance. This can be driven by a variety of factors, including changes in economic conditions or market trends, the development of new technologies, the emergence of new investment approaches or methodologies, or a combination of these factors. Different approaches can be used, such as incorporating new forms of data analysis, adopting new investment philosophies or strategies, or leveraging technology to automate investment decisions. The goal is to achieve better investment results than traditional methods by identifying new opportunities, improving accuracy and efficiency, and better managing risk.
A holistic approach is looking at a situation or problem as a whole rather than focusing on individual parts or aspects in isolation. It involves considering all relevant factors, including those that may not be immediately apparent or obvious, and taking a comprehensive and integrated view of the situation. In this approach, the different parts of a system are seen as interconnected and interdependent, and changes in one part of the system can affect the entire system. This approach recognizes that complex systems are more than the sum of their parts and that a complete understanding of a system requires considering its various components in relation to one another. In the context of investment strategy, a holistic approach might involve considering various factors, such as company financials, market trends, macroeconomic conditions, and social and environmental factors, to make more informed and comprehensive investment decisions.
Company financials play a significant role in determining firm valuation, and investors should carefully evaluate these metrics when making investment decisions. By taking a holistic approach to firm valuation that considers all relevant financial factors, investors can understand a company's value and make more informed investment decisions.
Valentine Siagian
Vol. 6 No.2 Desember
2023
Firm valuation is figuring out how much a company or business is worth from an economic point of view (Penman, 1998; Pinto, 2020). Some financial factors that might impact its valuation are (1) Revenue, a key financial metric indicating a company's ability to generate income from its core operations. A company with strong revenue growth may be valued higher than a company with stagnant or declining revenue. (2) Profitability is another important factor in determining a company's valuation. A company with high- profit margins is typically seen as more valuable than a company with low-profit margins.
(3) Debt: A company's debt level can impact its valuation. A company with high debt levels may be viewed as a higher-risk investment and valued lower than a company with lower debt levels. (4) Assets: A company's assets, such as property, equipment, and inventory, can also impact its valuation. Companies with a high level of assets may be valued higher than those with low levels of assets. (5) Growth potential: A company's growth potential is a critical factor in its valuation. A company with strong growth prospects may be valued higher than a company with limited growth potential.
In practice, investors and analysts will typically use a combination of these factors and other non-financial factors such as market trends and competition to determine a company's valuation. By taking a holistic approach to evaluating a company's financials and growth potential, investors can gain a more comprehensive understanding of the company's value and make more informed investment decisions.
For example, understanding a company's assets is an important aspect of evaluating its financial health and performance. Assets are resources that a company owns or controls and have economic value that can be converted into cash. This can be done for a variety of reasons, including mergers and acquisitions (Grove & Lockhart, 2019), selling or buying a business (Ivanoski, Ivanovskaa, & Narasanov, 2015), raising capital (Ovechkkin, Boldyreva, & Davydenko, 2021), or to understand the value of a company's assets (Jezcova, Rowland, Machova, & Hejda, 2020; Moro Visconti & Moro-Visconti, 2021).
A firm's valuation is based on various factors, including financial performance (Javed, Rashid, Hussain & Ali, 2020), assets and liabilities, market conditions, and other
Valentine Siagian
Vol. 6 No.2 Desember
2023
qualitative factors. Valuing a firm with its assets and liabilities involves using different financial metrics to determine the company's overall value, such as determining the firm's book value, calculating the firm's market value, using the price-to-book-ratio, or using the price-to-earnings ratio. Commonly used methods for valuing a firm include discounted cash flow analysis, comparable company analysis, precedent transaction analysis, and asset-based approaches.
The growing interest among retail investors in dividend-paying stocks (d'Amico
& De Blasis, 2020) can be calculated using the DDM model. In recent years, many people who want to make money from their investments have turned to stocks with high dividend yields. Investors often look for companies that pay dividends because dividends provide a regular source of income and a potential signal of financial stability. Investors who rely on income from their investments may prefer companies that pay dividends because they provide a regular source of income. This is particularly important for retired investors who rely on their investments for their living expenses. Then, companies that pay dividends may be seen as financially stable and well-managed. Further, companies that pay dividends may also have the growth potential. Moreover, Companies that pay dividends may be less volatile than those that do not. When a company pays a dividend, it distributes a portion of its earnings to its shareholders. This can have several implications for the company's stock price and volatility. First, companies that pay dividends are often more established and have a more predictable revenue stream than companies that do not pay dividends. This can make them less volatile because investors are more confident in the company's ability to generate stable earnings and continue paying dividends in the future. Second, companies that pay dividends tend to attract more long-term investors who are interested in the steady income stream provided by dividends. These investors are often less likely to sell their shares during periods of market volatility, which can help to stabilize the company's stock price. Third, investors may view companies that pay dividends more favorably, particularly those who prioritize income generation and risk management. This can lead to higher demand for the company's stock and a more stable stock price.
Valentine Siagian
Vol. 6 No.2 Desember
2023
Though, paying dividends does not guarantee stability or immunity from volatility.
Companies can still experience significant fluctuations in their stock price due to changes in market conditions or unexpected events. However, on average, companies that pay dividends tend to exhibit lower volatility than companies that do not pay dividends.
Because of this, there has been a growing need for reliable ways to determine how much dividend-paying stocks are worth. The DDM model has become one of the most popular ways to do this. Researchers have done much work to improve the DDM model and make it more accurate to determine how much a company is worth based on its expected future dividend payments.
The growing use of the DDM model in corporate finance is another thing that shows how important it is to study how firms are valued using the DDM model. Firms use the DDM model to look at investment opportunities, determine their cost of capital, and determine how much their equity is worth. Calculating firm valuation using the dividend discount model (DDM) is an important tool for investors and analysts because it provides a way to estimate a company's intrinsic value based on its expected future cash flows in the form of dividends. The DDM focuses on estimating the future cash flows that a company will generate in the form of dividends. This makes it a forward-looking valuation method that takes into account a company's expected future performance rather than just its past performance. The DDM takes into account the time value of money by discounting future cash flows back to their present value. This means that the DDM considers the fact that a dollar received in the future is worth less than a dollar received today. The DDM is particularly useful for companies that pay dividends consistently and have a predictable dividend policy. By relying on dividends, the DDM provides a way to estimate a company's intrinsic value based on its expected future cash flows.
Researchers have conducted studies to explore the limitations of the DDM model and to develop alternative models that can provide a more comprehensive view of a company's value (Ong'ele, 2018; Sutjipto, Setiawan, & Ghozali, 2020). For example, some researchers have developed dividend growth models that incorporate the impact of earnings growth and changes in the payout ratio on a company's future dividends. The
Valentine Siagian
Vol. 6 No.2 Desember
2023
DDM can be used to compare a company's intrinsic value with its market price. If the market price is lower than the estimated intrinsic value, the company may be undervalued, providing a potential investment opportunity.
A comparative analysis of different valuation methods, including the DDM, discounted cash flow (DCF), and relative valuation, could provide valuable insights into the strengths and limitations of each method and help investors make more informed investment decisions (Mavlutova et al., 2021). Overall, research on firm valuation using the DDM model has become increasingly important in recent years as investors and firms (Mugoša & Popović, 2015) seek more reliable methods for estimating the value of companies based on their expected future cash flows. As a result, there is likely to be continued interest in this area of research in the future as investors and firms seek to improve their understanding of the factors that influence a company's value. The DDM takes into account the risk associated with a company's future cash flows by using a discount rate that reflects the required rate of return of the investor. This means that the DDM considers the risk associated with a company's future cash flows and provides a way to estimate its intrinsic value accordingly.
Ultimately, firm valuation is essential for investors, buyers, and sellers because it estimates the company's worth, which can be used to make informed decisions about investment or acquisition opportunities. It is important to note that firm valuation is not an exact science, and different valuation methods can lead to different results. So, to get a more accurate estimate of a firm's value, it is important to take a comprehensive approach and think about more than one method of valuation.
The literature on the dividend discount model has contributed to our understanding of the factors that influence firm valuation and dividend policy. By exploring the assumptions and limitations of the DDM and comparing it to other valuation methods, researchers have provided insights into the strengths and weaknesses of the model. This research has implications for investors and analysts who use the DDM to value companies and make investment decisions for the firms listed in the Pefindo Index.
Valentine Siagian
Vol. 6 No.2 Desember
2023
LITERATURE REVIEW Firm Valuation
The past literature has mentioned many factors affecting firm valuation.
Khasharmeh & Mohd-Nor (2019) found a positive relationship between corporate governance and firm performance and a positive relationship between firm performance and firm valuation. Corporate governance refers to the system of rules, practices, and processes by which a company is directed and controlled. Good corporate governance is characterized by transparency, accountability, and effective oversight by the board of directors. Firm performance refers to a company's ability to generate profits and create value for its shareholders. Good corporate governance can help to improve firm performance by promoting efficient and effective management, encouraging strategic planning and risk management, and promoting ethical behavior. Firm valuation refers to the market value of a company's equity, which reflects the present value of its expected future cash flows. The positive relationship between corporate governance and firm performance can contribute to the positive relationship between firm performance and firm valuation. Companies with good corporate governance tend to perform better, which can lead to higher valuations.
The study by Kumar and Shukla (2019) reviewed the literature on the relationship between dividend policy and firm valuation, and the results show that there is a positive relationship between dividend policy and firm valuation, but the strength of this relationship depends on factors such as the company's life cycle, growth opportunities, and financial constraints. Dividend policy refers to the decision by a company's management to distribute a portion of its profits to shareholders in the form of dividends.
The amount and frequency of dividends can affect how investors perceive the company's financial health and growth potential. Studies have found that companies that pay dividends tend to have higher valuations than those that do not. This is because dividends clearly signal to investors that the company has a stable cash flow and that its management is confident about its future prospects. Moreover, dividends can attract investors who are seeking a regular income stream. Companies in different stages of their life cycle may
Valentine Siagian
Vol. 6 No.2 Desember
2023
have different dividend policies. For example, young, growing companies may reinvest all their profits into growth opportunities and may wait to pay dividends. As a result, the relationship between dividend policy and firm valuation may need to be stronger for these companies. Companies that have high growth opportunities may choose to retain their earnings rather than pay dividends to finance their growth. In such cases, the relationship between dividend policy and firm valuation may be weaker. Companies that have limited financial resources may choose to retain their earnings rather than pay dividends to finance their operations or investments. In such cases, the relationship between dividend policy and firm valuation may be weaker.
Another study that needs firm valuation is an M&A transaction. Cross-border mergers and acquisitions (M&A) involve companies from different countries and cultures, and the success of these deals can be affected by differences in national cultures. National culture can affect how investors perceive the value of a company and how well companies can work together post-merger. Different cultures have different communication styles, and this can lead to misunderstandings and misinterpretations during negotiations. This can affect the valuation of the companies involved in the deal and the success of the post- merger integration. Different countries have different legal and regulatory environments, and this can affect the valuation of companies involved in cross-border M&A. Investors may perceive a company as riskier or less valuable if it operates in a country with a less favorable legal and regulatory environment. Different countries have different accounting standards, which can affect the valuation of companies involved in cross-border M&A.
Investors may need help comparing financial statements from different countries, which can affect their perception of the value of the companies involved in the deal. Hennart &
Slangen (2019) explored the role of culture in the valuation of cross-border mergers and acquisitions and found that differences in national cultures can affect the valuation of companies involved in cross-border M&A, as well as the success of these deals.
Differences in national cultures can affect the valuation of companies involved in cross-border M&A, as well as the success of these deals. Companies need to be aware of these cultural differences and take them into account when negotiating deals and
Valentine Siagian
Vol. 6 No.2 Desember
2023
integrating post-merger. By doing so, they can increase the chances of a successful cross- border M&A deal. A previous study by Gao & Gao (2019) examined the relationship between social media sentiment and firm valuation and found a positive relationship between social media sentiment and firm valuation. This relationship is stronger for firms with higher levels of media coverage. Social media sentiment refers to the collective attitudes, opinions, and emotions expressed on social media platforms towards a particular company or its products and services. Social media sentiment can affect how investors perceive a company's reputation and future prospects. If a company is perceived positively on social media, it can generate positive buzz, increase brand awareness, and attract investors. This positive perception can lead to an increase in the company's valuation.
Social media can be a useful tool for engaging with customers and addressing their concerns. By responding to customer feedback on social media, companies can demonstrate their commitment to customer satisfaction, which can improve customer loyalty and increase sales. This increased engagement can also lead to a higher valuation for the company. The relationship between social media sentiment and firm valuation is stronger for firms with higher levels of media coverage. This is because social media sentiment can amplify the effects of media coverage, both positive and negative. If a company is featured prominently in the media and has positive sentiment on social media, it can lead to a higher valuation.
Tay, Tan, & Tse (2020) examined the literature on the relationship between corporate social responsibility (CSR), firm value, and financial performance. The results show a positive relationship between CSR and firm value, and this relationship is more robust in countries with more vital legal institutions. Corporate social responsibility (CSR) refers to a company's voluntary actions to improve its social and environmental impact.
CSR activities can enhance a company's reputation and build trust with stakeholders. By investing in social and environmental initiatives, companies can demonstrate their commitment to the well-being of society and the environment. This positive perception can lead to increased customer loyalty, improved employee morale, and greater investor confidence, which can increase the company's value. CSR activities can also help
Valentine Siagian
Vol. 6 No.2 Desember
2023
companies manage environmental, social, and governance risks. By proactively addressing these risks, companies can avoid negative impacts on their reputation, legal liabilities, and financial performance. This risk management can lead to an increase in the company's value. CSR activities can also drive innovation and efficiency, increasing competitiveness and financial performance. By investing in sustainable practices, companies can reduce waste, increase energy efficiency, and improve their supply chain management. These innovations can lead to cost savings, increased revenues, and a higher value for the company.
The research on how to value a company from the past five years shows how important things like corporate governance, dividend policy, culture, social media sentiment, and corporate social responsibility are. These results can help investors, managers, and policymakers make better decisions about how much a company is worth.
This paper investigates the use of DDM to measure the firm's intrinsic value and compare it to the market price to determine whether the firm is overvalued or undervalued.
Dividend Discount Model
The dividend discount model (DDM) is a common approach to firm valuation. It estimates the present value of a company's future dividends to determine its current value (Sorensen & Williamson, 1985; Cornell & Gerger, 2022). The model assumes that the value of a firm is equal to the sum of the discounted value of all future dividends paid by the company. DDM assumes that the value of a company is based on the cash flows that it will generate for shareholders in the form of dividends. DDM works by estimating the future cash flows that a company will generate and then discounting those cash flows back to their present value using a discount rate.
To estimate future dividends, analysts will typically consider a range of factors, including the company's historical dividend payments, financial performance, and growth prospects. They will also consider external factors that may impact the company's ability to pay dividends, such as regulatory environment changes or market demand shifts.
Valentine Siagian
Vol. 6 No.2 Desember
2023
Once future dividends are estimated, the model uses a discount rate to determine their present value. The discount rate is typically based on the cost of capital, which reflects the risk associated with investing in the company's stock. A higher discount rate will result in a lower present value of future dividends, while a lower discount rate will result in a higher present value.
The DDM has its limitations and is best suited for companies with a history of paying dividends and are expected to continue doing so. Additionally, the model assumes that all future cash flows will be paid out in dividends, which may differ for some companies. Nonetheless, the DDM can be useful for investors looking to value dividend- paying companies and make informed investment decisions.
In this sense, the DDM provides a simple framework to estimate a firm's value based on its expected future cash flows (Agosto, Mainini, & Moretto, 2019). Knowing the firm valuation using the DDM is essential for several reasons:
1. Investment decisions: Investors can use the DDM to determine whether a stock is overvalued or undervalued relative to its expected dividend payments (Sim &
Wright, 2017). By comparing a company's current stock price to its estimated value based on the DDM, investors can decide whether to buy, hold, or sell a stock.
2. Capital budgeting: Firms can use the DDM to evaluate investment opportunities and determine whether a project is expected to generate returns that exceed the cost of capital (Mubashar & Tariq, 2019). By discounting a project's expected future cash flows, firms can estimate its net present value (NPV) and determine whether it is worth pursuing.
3. Mergers and acquisitions: The DDM can estimate a company's value for mergers and acquisitions (Singh, 2017). By estimating the present value of a company's future dividends, acquirers can determine a fair price for the company.
The DDM provides a simple but powerful framework to estimate the value of a company based on its expected future cash flows. By using the model, investors, firms, and acquirers can make informed decisions about investment opportunities and evaluate the potential value of a company.
Valentine Siagian
Vol. 6 No.2 Desember
2023
The basic DDM framework involves estimating the next dividend payment, estimating the long-term growth rate of the company's dividends, determining the required rate of return, and then using these values to calculate the present value of the future dividends.
The basic DDM framework involves the following steps (Galves, 2022):
1. Forecast future dividends: The first step is to estimate the expected future dividends of the company based on its historical dividend payments and earnings forecasts. This involves making assumptions about the growth rate of dividends over time.
2. Determine the required rate of return: The next step is to determine the required rate of return for the investor, which considers the risk of investing in the company.
This rate is typically estimated using the capital asset pricing model (CAPM) or similar models.
3. Calculate the present value of dividends: Using the expected future dividends and the required rate of return, the present value of each dividend payment can be calculated. This involves discounting each dividend payment back to its present value using the required rate of return.
4. Calculate the intrinsic value of the company: Finally, the company's intrinsic value can be calculated by summing up the present value of all future dividends.
By using this basic framework, investors can estimate the intrinsic value of a company's stock based on its expected future dividend payments. If the estimated intrinsic value is higher than the current market price, the stock may be considered undervalued and a potential investment opportunity. Conversely, if the estimated intrinsic value is lower than the current market price, the stock may be considered overvalued and not a good investment opportunity. This basic framework can be modified and extended in various ways to incorporate different assumptions and factors, such as different growth rates for dividends or changes in the required rate of return over time. However, the basic steps of forecasting future dividends, determining the required rate of return, and
Valentine Siagian
Vol. 6 No.2 Desember
2023
discounting future dividends to calculate their present value remain the core components of the DDM framework.
METHODOLOGY
In this paper, I use a quantitative research method to analyze financial data from firms listed in the PEFINDO indexes from 2018 to 2021. Quantitative research is a research method that involves collecting and analyzing numerical data to test hypotheses and answer research questions. This method is often used in financial research to analyze trends and patterns in financial data and to identify relationships between variables.
The data used in this research includes historical financial statements, stock prices, dividend payments, and market capitalizations taken from the IDX and firm websites.
Financial statements provide information about a company's financial performance, including its revenues, expenses, profits, and losses. Stock prices, dividend payments, and market capitalizations are important indicators of a company's value and performance in the stock market. By analyzing these data points, the author can gain insights into the financial performance and value of the companies included in the PEFINDO indexes.
I use the dividend discount model (DDM) to estimate the value of each firm based on their financial data. The DDM is a commonly used valuation method that estimates the intrinsic value of a stock based on its expected future dividend payments. The model takes into account several variables, including the expected dividend payments, the discount rate used to calculate the present value of these payments, and the growth rate of the company's earnings.
By using the DDM model to estimate the value of each firm, the author can compare the estimated values to the actual stock prices of the firms. This comparison can help the author identify undervalued or overvalued stocks and make investment recommendations based on this analysis.
The quantitative research method used in this paper allows me to analyze financial data from firms listed in the PEFINDO indexes and gain insights into their financial performance and value. By using the DDM model to estimate the value of each firm and
Valentine Siagian
Vol. 6 No.2 Desember
2023
comparing these estimates to actual stock prices, the author can make informed investment recommendations based on this analysis.
Table 1. Purposive Sampling
Criteria Number of Firms
Firms listed in PEFINDO 25 25
Period of research 4
Total number of firms 100
Firm that stays in the Index from 2018-2021 3
The PEFINDO 25 Index is a stock market index that is designed to reflect the stock prices of 25 issuers that have been carefully selected based on several criteria. These criteria include total company assets, return on equity (ROE), public accountants' opinions, liquidity, and the number of shares owned by the public. By taking these factors into account, the PEFINDO 25 Index aims to provide investors with a comprehensive picture of the stocks of small and medium-sized companies (SME/UKM) listed on the Indonesia Stock Exchange.
The PEFINDO 25 Index is a collaboration between the Indonesia Stock Exchange and the rating agency PT PEFINDO. The purpose of this collaboration is to provide investors with more information about the stocks of small and medium-sized companies and to help them make more informed investment decisions. The PEFINDO 25 Index is updated twice a year to ensure that it remains relevant and up-to-date. This means that the index always reflects the most current information about the stocks of the companies included in the index.
To conduct a study on the PEFINDO 25 Index, I use purposive sampling to select firms that were continuously listed on the index from 2018 to 2021. Purposive sampling is a type of non- probability sampling that is used when the researcher wants to select specific participants for a study based on predetermined criteria. In this case, the criteria were that the firms had to be listed on the PEFINDO 25 Index continuously for the four-year period from 2018 to 2021. The PEFINDO 25 Index is a valuable tool for investors who are interested in investing in small and medium-sized companies listed on the Indonesia Stock Exchange. The index provides investors with a comprehensive picture of the stock prices of these companies, and it is updated regularly to
Valentine Siagian
Vol. 6 No.2 Desember
2023
ensure that it remains relevant and up-to-date. The use of purposive sampling in the study of the PEFINDO 25 Index helps to ensure that the results of the study are representative of the companies listed on the index over the four-year period.
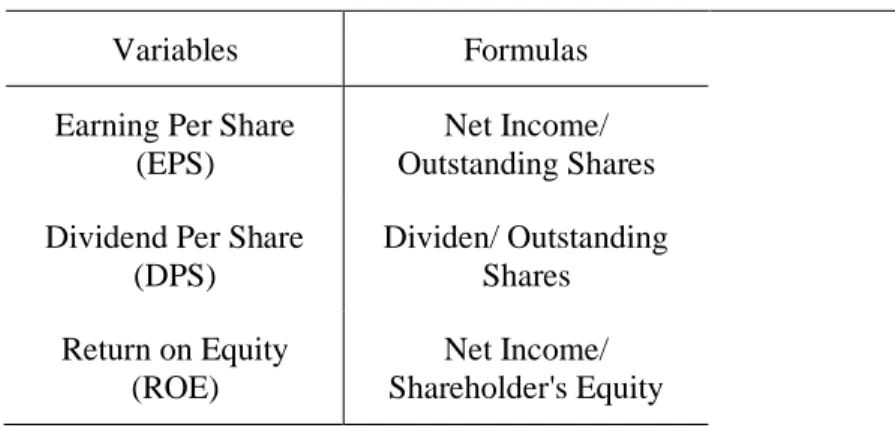
Table 2 is a list of variables used in the DDM, along with how to measure these variables.
For example, some common variables in the DDM include Expected Earning Growth Rate (g), Expected Dividend Estimate, Expected return value (k).
Panel A in the table presents a list of variables that can be used to analyze the financial conditions of a company. These variables include Earnings Per Share (EPS), Dividend Per Share (DPS), and Return on Equity (ROE). EPS is a financial metric that calculates the earnings generated by a company per share of outstanding stock. It is calculated by dividing the net income of the company by the total number of outstanding shares. EPS is an important metric for investors as it can be used to evaluate a company's profitability and growth potential. DPS is a financial metric that calculates the amount of dividends paid to shareholders per share of outstanding stock.
It is calculated by dividing the total amount of dividends paid by the company by the total number of outstanding shares. DPS is an important metric for investors who are interested in generating income from their investments. ROE is a financial metric that measures the profitability of a company by calculating the return generated on the shareholder's equity. It is calculated by dividing the net income of the company by the shareholder's equity. ROE is an important metric for investors as it provides insight into the efficiency of a company in generating profits with the money invested by its shareholders.
Table 2. Variable Definition Panel A. Analyze Financial Conditions
Variables Formulas
Earning Per Share (EPS)
Net Income/
Outstanding Shares Dividend Per Share
(DPS)
Dividen/ Outstanding Shares Return on Equity
(ROE)
Net Income/
Shareholder's Equity
Valentine Siagian
Vol. 6 No.2 Desember
2023
Panel B. Calculate Dividend Discount Model
Variables Formulas
Expected Earning Growth Rate (g)
g= ROE x b g= ROE x (1-DPR) Expected Dividend
Estimate
D1 = D0 x (1 + g) Expected return value
(k)
k = (D1/P) + g Intrinsic value with
DDM Method of constant growth
P0 = D1/ (k-g)
Panel C. Measurement of Firm Valuation
Variables Formulas
Market to Book Value Number of Outstanding Stocks x Closed Price
Panel B in the table presents a list of variables and formulas that can be used to calculate the Dividend Discount Model (DDM) for a company. The DDM is a valuation method used to estimate the intrinsic value of a company's stock based on its expected future dividend payments.
The first variable in Panel B is the expected earnings growth rate (g). This variable can be calculated using two different formulas, depending on whether the company has a dividend payout ratio (DPR) or not. The first formula is g= ROE x b, where b is the plowback ratio (1-DPR). The second formula is g= ROE x (1-DPR).
The next variable is the expected dividend estimate (D1), which is the estimated amount of the company's dividend payment in the next period. This variable is calculated by multiplying the previous dividend payment (D0) by (1 + g).
The expected return value (k) is then calculated using the formula k = (D1/P) + g. This formula takes into account the expected dividend payment and the expected earnings growth rate to estimate the expected return on investment for the company's stock.
Valentine Siagian
Vol. 6 No.2 Desember
2023
Finally, the intrinsic value with the DDM method of constant growth (P0) is calculated using the formula P0 = D1/ (k-g). This formula estimates the intrinsic value of the company's stock based on the expected future dividend payments and the expected return on investment.
By using these variables and formulas, I can estimate the intrinsic value of a company's stock and compare it to the current market price to make informed investment decisions. These formulas is applied to each of the 3 samples for a specific company. By analyzing these financial conditions, investors can gain a deeper understanding of a company's financial health, and use this information to make informed investment decisions.
To calculate the expected dividend payments, I used information such as the company's historical dividend payments, earnings growth rate, and payout ratio. The earnings growth rate refers to the expected rate at which the company's earnings per share will grow over time. The payout ratio is the percentage of earnings that the company pays out as dividends. The discount rate used in the DDM reflects the risk associated with investing in the company's stock. The discount rate may be based on the risk-free rate of return (such as the yield on a government bond) and the company's beta, which measures the volatility of the stock's returns compared to the overall market. By using the formulas in Table 2 to calculate the DDM for the companies included in the PEFINDO 25 Index, the author can estimate the intrinsic value of these stocks and compare them to their current market prices. This analysis can help investors make more informed investment decisions and identify opportunities for undervalued stocks.
Table 3. Investment References
Information Stock Condition Investment Decision
Intrinsic Value > Market Price Undervalued Buying Stocks Intrinsic Value < Market Price Overvalued Selling Stocks
Intrinsic Value = Market Price Fair valued Hold Stocks
Valentine Siagian
Vol. 6 No.2 Desember
2023
Table 3 contains information references as well as the investment decisions that the author recommends based on a comparison of the intrinsic value and market price of each stock. This information can be helpful to investors who are trying to decide whether to buy, hold, or sell a particular stock.
The intrinsic value of a stock is the estimated true value of the stock based on factors such as its future earnings potential, dividend payments, and the risk associated with investing in the stock. The market price of a stock, on the other hand, is the price at which the stock is currently trading in the market. If the intrinsic value of a stock is greater than its market price, this suggests that the stock may be undervalued and could be a good investment opportunity.
Based on the comparison of the intrinsic value and market price of each stock, I may recommend different investment decisions. For example, if the intrinsic value of a stock is significantly higher than its market price, the author may recommend buying the stock, as it may be undervalued and likely to increase in value over time. On the other hand, if the market price of a stock is significantly higher than its intrinsic value, the author may recommend selling the stock or avoiding it altogether, as it may be overvalued and likely to decrease in value over time.
RESULTS AND DISCUSSION
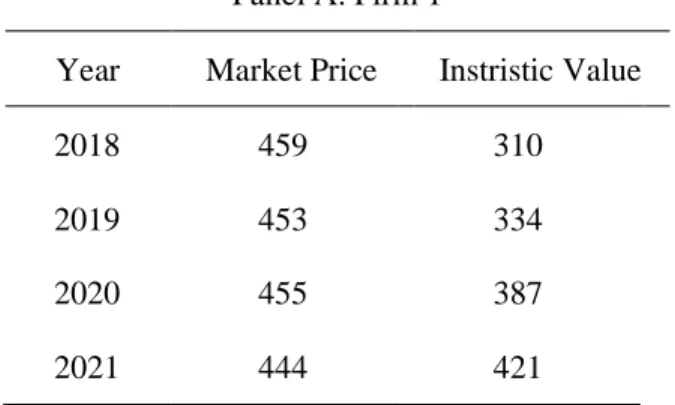
Table 4 is a comparative analysis of the market and intrinsic values for three firms in the sample.
Table 4. Comparison Market Price vs Intrinsic Value Panel A. Firm 1
Year Market Price Instristic Value
2018 459 310
2019 453 334
2020 455 387
2021 444 421
Valentine Siagian
Vol. 6 No.2 Desember
2023
Panel B. Firm 2
Year Market Price Instristic Value
2018 27 195
2019 40 205
2020 236 108
2021 239 115
Panel C. Firm 3
Year Market Price Instristic Value
2018 390 388
2019 397 428
2020 394 434
2021 391 496
The table provides a side-by-side comparison of the the firms form the sample for the period of 2018-2021. Table 4 Panel A shows the comparison from firm 1. Table 4 Panel B shows the comparison with firm 2, and Table 4 Panel C shows the comparison with firm 3.
The dividend discount model (DDM) is a common way to determine a company's worth based on how much it pays out in dividends. It is based on the idea that a company's value equals the present value of its expected future dividends, which a specific rate has reduced. This method is based on the idea that the value of a stock is the sum of its future cash flows, and dividends are one of the most tangible and predictable cash flows a company makes.
The application of the DDM to firm valuation is straightforward. The first step is to estimate the firm's future dividends, typically based on historical dividend payments and expected future earnings growth. The second step is to select an appropriate discount rate, which reflects the risk associated with the firm's future cash flows. Finally, the present value of the expected future dividends is calculated by discounting them back to the present using the chosen discount rate.
Valentine Siagian
Vol. 6 No.2 Desember
2023
One of the advantages of using the DDM is that it is relatively simple and easy to use compared to other valuation methods, such as discounted cash flow or market multiples.
Additionally, the DDM can provide a valuable benchmark for comparing the market value of a firm with its intrinsic value based on its expected future dividends.
However, the DDM also has some limitations. Accurately predicting future dividends is one of the biggest challenges because it may depend on changes in the company's earnings, capital expenditures, and dividend policy (Agosto & Moretto, 2015). Additionally, the choice of discount rate is subjective and may depend on assumptions about the firm's risk and expected returns.
Even with these problems, the DDM is still an excellent way to figure out how much a company is worth, especially for companies that have paid dividends for a long time and have a stable dividend policy. It can also give investors valuable information about what drives the value of a company and help them make better investment decisions.
In conclusion, the DDM is a well-established and widely used method for firm valuation.
While it has some limitations, it remains a valuable tool for investors and analysts to estimate the intrinsic value of a firm based on its expected future dividends.
Table 5. Investment Reference Result Panel A. Firm 1
Information Stock Condition
Investment Decision 2018 Overvalued Selling Stocks 2019 Overvalued Selling Stocks 2020 Overvalued Selling Stocks 2021 Overvalued Selling Stocks
Valentine Siagian
Vol. 6 No.2 Desember
2023
The stock conditions listed in Table 5 may also provide additional information that can help investors make informed investment decisions. For example, the conditions may include information on the company's financial performance, growth prospects, industry trends, and competitive landscape. By considering these factors alongside the intrinsic value and market price of each stock, investors can make more informed investment decisions that align with their investment goals and risk tolerance.
Panel B. Firm 2 Information Stock
Condition
Investment Decision 2018 Undervalued Buying Stocks 2019 Undervalued Buying Stocks 2020 Overvalued Selling Stocks 2021 Overvalued Selling Stocks
Panel C. Firm 3 Information Stock
Condition
Investment Decision 2018 Overvalued Buying Stocks 2019 Undervalued Buying Stocks 2020 Undervalued Selling Stocks 2021 Undervalued Selling Stocks
Valentine Siagian
Vol. 6 No.2 Desember
2023
Based on the information reference in Table 3 and the calculation result of the intrinsic value in Table 4, the three firms of the sample have a different investment decision on the four years of sample period. Firm 2 have an interesting change. On the first two years of 2018 and 2019, the stocks were undervalued and on the year 2020 and 2021 when the pandemic were, the stocks were overvalued. This firm is in the health sub sector and this shows the different point of view from investors before and during pandemic situation.
The information provided in Table 5 can be a valuable tool for investors who are trying to make investment decisions based on the intrinsic value and market price of the stocks included in the PEFINDO 25 Index. By considering the investment recommendations and stock conditions listed in the table, investors can make more informed decisions that align with their investment goals and risk tolerance.
CONCLUSIONS
In this study, I used the dividend discount model (DDM) to determine how much each company on the PEFINDO Index Indonesia is worth. The DDM is a popular and helpful way to determine how much a company is worth. It is based on the idea that a company's value is the present value of its future dividends. The study's goal was to find out if the stocks in the PEFINDO Index were overvalued, undervalued, or priced right by comparing their market price to their intrinsic value, which was calculated using the DDM.
According to the results, some stocks in the PEFINDO Index were undervalued, while others were overvalued or priced about right. This means there may be investment opportunities in the undervalued stocks, while investors may want to sell the overvalued ones. Also, our research showed that the DDM can be a helpful tool for finding stocks that are overpriced and making investment decisions.
The results of this study are valuable for investors, financial analysts, and fund managers interested in investing in the PEFINDO Index Indonesia. By providing insights into the intrinsic value of index stocks, this study can help investors make informed investment decisions and optimize their portfolio performance.
Valentine Siagian
Vol. 6 No.2 Desember
2023
However, it is essential to remember that the DDM has some limits, and using it means making assumptions about future dividends and choosing the correct discount rate. So, investors should use the DDM along with other valuation methods and think about industry trends, the state of the economy, and risks specific to a company when making investment decisions. This study shows how important it is to use reliable valuation methods, like the DDM, to determine how much a stock is worth and make intelligent investment decisions.
REFERENCES
Agosto, A., & Moretto, E. (2015). Variance matters in stochastic dividend discount models). Annals of Finance, 11, 283—295.
Agosto, A., Mainini, A., & Moretto, E. (2019). Stochastic dividend discount model:
Covariance of random stock prices. Journal of Economics and Finance, 43, 552—
568.
Cornell, B., & Gerger, R. (2022). Let's get real about the dividend growth model. Business Valuation Review, 41(1), 23—25.
d'Amico, G., & De Blasis, R. (2020). A review of the dividend discount model: From deterministic to stochastic models. Statistical Topics and Stochastic Models for Dependent Data with Applications, 47—67.
Gálvez, J. (2022). Measuring the equity risk premium with dividend discount models.
Banco de Espana Occasional Paper, (2207).
Gao, J., & Gao, J. (2019). Social media sentiment, firm valuation and stock returns.
Journal of Business Research, 100, 351—364.
Grove, H., & Lockhart, J. (2019). Evolution of corporate governance towards intrinsic value. Corporate Law & Governance Review, 1(1), 8—13.
Hennart, J. F., & Slangen, A. H. (2019). The role of culture in the valuation of cross- border mergers and acquisitions. Journal of World Business, 54(2), 94—104.
Ivanovski, Z., Ivanovska, N., & Narasanov, Z. (2015). Application of dividend discount model valuation at Macedonian Stock Exchange. UTMS Journal of Economics, 6(1), 147—154.
Valentine Siagian
Vol. 6 No.2 Desember
2023
Javed, M., Rashid, M. A., Hussain, G., & Ali, H. Y. (2020). The effects of corporate social responsibility on corporate reputation and firm financial performance: Moderating role of responsible leadership. Corporate Social Responsibility and Environmental Management, 27(3), 1395—1409.
Jezkova, V., Rowland, Z., Machova, V., & Hejda, J. (2020). The intrinsic value of an enterprise determined by means of the FCFE tool. Sustainability, 12(21), 8868.
Khasharmeh, H., & Mohd-Nor, R. (2019). Corporate governance, firm performance and firm valuation: A systematic review of the literature. International Journal of Accounting & Information Management, 27(4), 523—547.
Kumar, P., & Shukla, A. (2019). Dividend policy and firm valuation: A systematic review of the literature. Management Review, 31(3), 158—169.
Mavlutova, I., Babenko, V., Dykan, V., Prokopenko, N., Kalinichenko, S., & Tokmakova, I. (2021). Business restructuring as a method of strengtening company’s financial position. Journal of Optimization in Industrial Engineering, 14(Special Issue), 105—115.
Moro-Visconti, R., & Moro-Visconti, R. (2021). FinTech valuation. Startup Valuation:
From Strategic Business Planning to Digital Networking, 245—279.
Mubashar, A., & Tariq, Y. B. (2019). Capital budgeting decision-making practices:
Evidence from Pakistan. Journal of Advances in Management Research, 16(2), 142—167.
Mugoša, A., & Popović, S. (2015). Towards and effective financial management:
Relevance of dividend discount model in stock price valuation. Economic Analysis, 48(1-2), 39—53.
Ong’ele, G. O. (2018). The Prediction Accuracy of Gordon’s Dividend Discount Model in the Valuation of Banking Sector Stocks Listed in Nairobi Securities Exchange (Doctoral dissertation, University of Nairobi).
Ovechkin, D., Boldyreva, N., & Davydenko, V. (2021). Intellectual capital and value:
Testing new IC measures in Russia. Journal of Economic Studies, 48(6), 1111—
1127.
Valentine Siagian
Vol. 6 No.2 Desember
2023
Penman, S. H. (1998). A synthesis of equity valuation techniques and the terminal value calculation for the dividend discount model. Review of accounting studies, 2, 303—323.
Pinto, J. E. (2020). Equity Asset Valuation. John Wiley & Sons.
Sim, T., & Wright, R. H. (2017). Stock valuation using the dividend discount model: An internal rate of return approach. Growing Presence of Real Options in Global Financial Markets (Vol. 33, pp. 19—32). Emerald Publishing Limited.
Singh, A. P. (2017). Merge or Acquire-A Strategic Framework. Annals of the University Dunarea de Jos of Galati: Fascicle: I, Economics & Applied Informatics, 23(3).
Sorensen, E. H., & Williamson, D. A. (1985). Some evidence on the value of dividend discount models. Financial Analysts Journal, 41(6), 60—69.
Sutjipto, E., Setiawan, W., & Ghozali, I. (2020). Determination of intrinsic value:
Dividend discount model and discounted cash flow methods in Indonesia Stock Exchange. International Journal of Management, 11(11). DOI:
10.34218/IJM.11.11.2020.175
Tay, T. L., Tan, K. H., & Tse, Y. K. (2020). Corporate social responsibility, firm value and financial performance: A meta-analysis. Journal of Business Research, 111, 196—209.