I would like to thank my advisor, Professor James Heath, for giving me the opportunity to work on such wonderful research projects. I want to thank him for helping me grow as a scientist during my time at Caltech and leading me on a path to exciting discoveries. I thank Professor David Tirrell for being both an insightful committee member as well as a supportive figure during my time at Caltech.
I thank Professor Sarkis Mazmanian for his great committee membership and inspiring my study of immunology. I would like to thank Kailyn FitzGerald for being so instrumental in my time here at Caltech and for her support. Wei Wei, Blake Farrow, and everyone I forgot – thank you for keeping life fun at Caltech.
Mom, your undying support always kept my chin up when I was at Caltech.
Automated Data Gathering in Single Cell Microfluidic Protein Assays
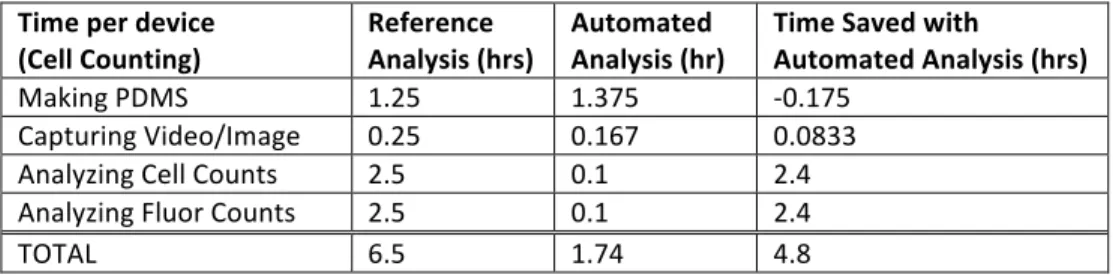
With a complete view of the cells and the fluorescent signal in the microfluidic device, the two automation tasks share a common goal: finding and indexing every single cell chamber. To perform automated computer vision cell counting, a complete image of the microfluidic device must be generated. This was achieved by using the “Stage Overview” feature of the Olympus IX81 CellSens software.
Once the full image of the microfluidic device was acquired, the image was loaded into a specially written Matlab program (see Appendix A for the full code). First, a feature finding method identifies circular regions of interest (ROIs) using the binary image of the single-cell chamber. First, the user identifies the four corners of the device by clicking on the reference signals.
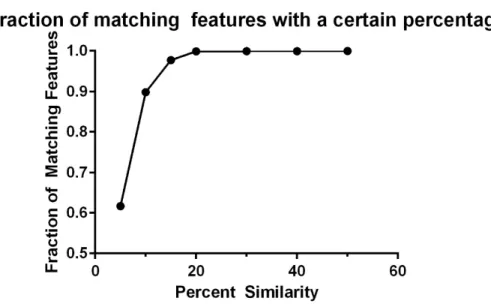
Of the subset of errors examined, the automated program was closer to the exact value 64% of the time.
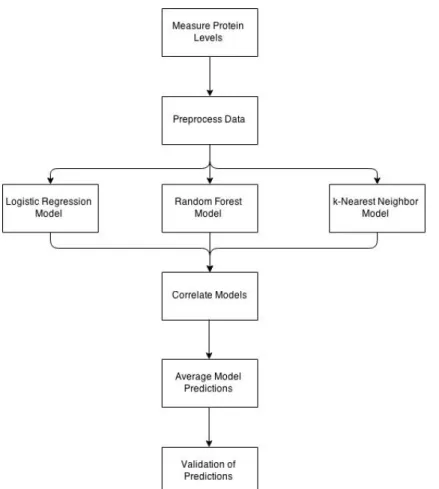
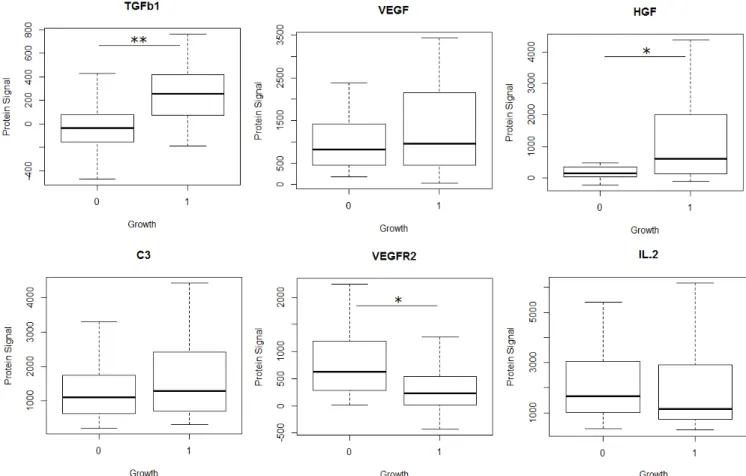
Predicting Glioblastoma Patient Response to Anti-‐Angiogenic Therapy using Statistical
Blennow et al., “Cerebrospinal fluid and plasma biomarkers in Alzheimer's disease,” NATURE REVIEW NEUROLOGY, vol. Kosaka et al., “Circulating microRNA in body fluid: a new potential biomarker for cancer diagnosis and prognosis,” CANCER SCIENCE , vol. Pittawy et al., "Doubling times of human chorionic gonadotropin increase in early viable intrauterine pregnancies," Am J Obstet Gynecol, pp.
Lokshin et al., “Development of a multimarker assay for early detection of ovarian cancer,” J Clin Onco, vol. Fan et al., “Integrated barcode arrays for rapid, multiplex protein analysis in microliter amounts of blood,” Nature Biotech., vol. Loeffler et al., “Lessons from phase III clinical trials on anti-VEGF therapy for cancer,” Nat Clin Pract Oncol., vol.
Arjaans et al., “Bevacizumab-induced normalization of blood vessels in tumors impairs antibody uptake,” Cancer Res., vol. Ferrara et al., “Discovery and development of bevacizumab, an anti-VEGF antibody for the treatment of cancer,” NATURE REVIEWS DRUG DISCOVERY, vol. Zhou et al., “Safety and efficacy of first-line bevacizumab-based treatment in advanced non-‐.
Wang et al., “Immobilized probe and glass surface chemistry as variables in microarray fabrication,” BMC Genomics, vol. Reed et al., “Use of Coefficient of Variation in Assessing the Variability of Quantitative Tests,” Clin. Tollenaar et al., “Proteomic serum biomarkers and their potential application in cancer screening programs,” Int J Mol Sci.
Lodish et al., "Role of transforming growth factor beta in human disease," N Engl J Med, vol Fortin et al., "Transforming growth factor beta and its implication in malignancy of gliomas,". Nakajima et al., “Transforming growth factor beta stimulates breast adenocarcinoma cell invasion and metastatic potential,” Proc Natl Acad Sci , vol.
Cross et al., “Vascular endothelial growth factor receptor-‐2: Structure, function, intracellular signaling, and therapeutic inhibition,” Cellular Signaling , vol.
Phenotyping Cells in Microfluidic Devices using a Photocleavable Conjugate
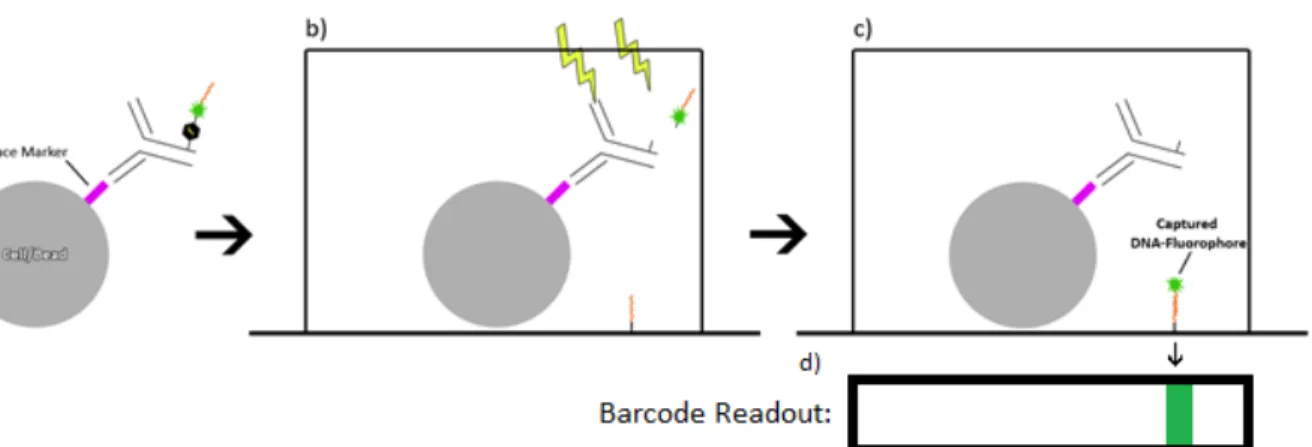
To see if the PC conjugate could bind to surface proteins, an anti-‐CD3 PC conjugate was synthesized and used to stain a J45.01 Jurkat cell line (ATCC). 5 µL of PC conjugate was then added to the solution and allowed to incubate on ice for 30 min. This test was then repeated for Jurkat T cells using a PC conjugate specific for the CD3 surface marker.
To test the PC conjugate phenotype detection method on cells, CD3 was detected on the J45.01 Jurkat cell line. The toxicity of the anti-CD3 PC conjugate was tested with Jurkat T cells by mixing 50 µg/mL with 1x10 6 cells/mL. Jurkats were centrifuged at 500 x g for 4 min and 5 µL of anti-CD3 PC conjugate was added (stock concentration was 0.5 mg/mL).
The initial yield for the PC conjugate was a factor lower than a standard DEAL conjugate. Beads stained with PC conjugate are shown in Figure 4 after 0, 5, and 15 minutes of exposure to UV-A light. In the fluorescence image (Figure 8b) they appear as red dots due to the fluorophore on the PC conjugate.
The y-axis is the percentage of apoptotic T cells found after exposure to UV-‐A light or to the stimulating phorbol 12-‐myristate 13-‐. The percentage of apoptotic cells found after 15 minutes was significantly higher than 5 minutes. This is probably due to the higher extinction coefficient of PE compared to the Cy3 fluorophore used in the PC conjugate (max. extinction coefficients of PE and Cy3 are 2x10⁶ and 1.4x10⁵ M-‐1cm-‐1 respectively) [8, 9] . This was demonstrated in Figure 5 by measuring the reduction in fluorescence as a function of UV exposure time: the bead intensity did not reach the background level even after 15 minutes of UV-A. Therefore, it would be advantageous to either 1) improve the photocleavage efficiency of the PC conjugate or 2) find an alternative cleavage method.
The PC conjugate is best used in situations where the cell count is determined automatically (see chapter 1.2.1) or where a cell trap is used in microfluidics. A cell trap would guarantee that each room would have only one cell. or zero cells), allowing the user to be confident that the phenotype data obtained from the PC conjugate readout comes from a single cell.
Predicting Adoptive Cell Transfer Therapy Success with T cell Polyfunctionality using Single
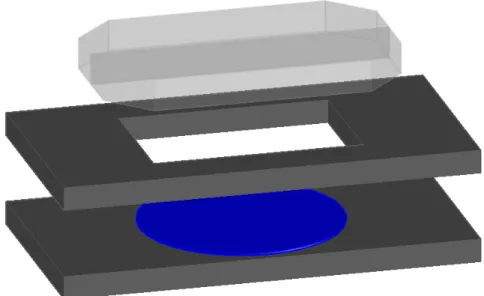
Therefore, we hypothesized that the polyfunctionality of T cells was an important factor in the success of genetically engineered ACT. Prediction was based on the degree of polyfunctionality present in the initial T cell infusion product (referred to as “Pre-‐Infusion” . T cells). The PDMS thin layer was placed in the degassing chamber while still in the mixing cup.
First, a 3% BSA in PBS solution was flowed through the microfluidic device and a dead-fill was performed to remove bubbles in the flow channels. The conjugates were then diluted to 50 µM in 3% BSA and 200 µl was passed through the device for 1 hour. Videos of the cells were then taken and the device was then placed in a 37°C incubator with 5% CO2 for 14 hours.
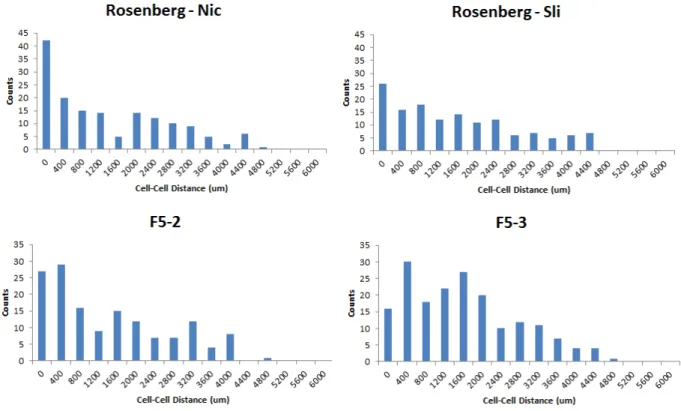
The protein signals were acquired using the “Block Aligning” method in the Genepix Pro 7 software (Molecular Devices). To rule out that cell viability accounts for differences in the T cell measurements, it was. This was especially true in the case of CCL4, where patient F5-‐2's T cells secreted almost 10 times higher on average than all the other patients.
This shows that patient F5-‐2 has significantly higher polyfunctional cells, regardless of the number of functions. However, the patients with the highest mean pSI were the two top responders in the F5 trial. The relationship between mean pSI and PFS in the NIH trial is shown in Figure 7b.
Second, our method successfully captured the two best responding patients in the F5 trial using mean pSI as a prediction metric. This phenomenon has been shown to correlate with successful immunotherapy trials in cases of type I immune responses [17].
![Figure 1: Overview of genetic engineered ACT. Adapted from [8].](https://thumb-ap.123doks.com/thumbv2/123dok/10415146.0/75.918.123.788.104.457/figure-1-overview-genetic-engineered-act-adapted-8.webp)
T cell-‐T cell Contact and its Effect on Protein Secretion in Microfluidic Cell Assays
A difference in this process was that the PDMS device was baked on an aluminum block to achieve a flat surface, as detailed in Chapter 1.2.1.1. In fluorescence detection, the GFP channel was used to visualize CD8 (FITC) on T cells. To determine whether TCR clustering occurred at the T-‐T contact synapse, MART-‐1+ Jurkat T cells were obtained from the Baltimore Laboratory, courtesy of Michael Bethune.
The cells are then counted according to the cell boundaries defined in the normal cell counting program (Chapter 1.2.1.3). In the final output, each room has an additional added value: the number of fluorescent cells. Theoretical values for contact CD4-‐CD4, CD4-‐CD8 and CD8-‐CD8 were calculated from the percentage of CD4 and CD8 sorted on the FACS.
T cells with protein levels less than background level are not plotted but are included in significance calculations. The five proteins shown in the figure were the most statistically discriminating proteins, and the remaining proteins tested (IL-‐6, IL-‐4, IL-‐17, IL-‐2) were not significantly changed after exposure. Furthermore, Xiang demonstrated that preventing T cell communication at the initial stage of an immune response would significantly reduce the number of antigen-specific memory T cells found after infection [ 11 ].
There are two possible explanations for the selective regulation: 1) the exchange of information through cytokines and/or receptors triggered only a few protein synthesis pathways in the cells or 2) the single cell assay was not sensitive enough to detect changes in protein expression for some proteins. Performing blocking experiments, rather than knockdowns, would not be useful in this case, for two reasons: one, antibodies to block cytokines are unlikely to enter the T cell synapse, and two, anti-receptor antibodies have likely to cause steric hindrance. in synapse formation, as shown in The Nature of the T-‐T Contact (Chapter 5.3.3). In the CD4/CD8 phenotype experiment, it was observed that there was less CD4-‐CD8 in contact than the theoretically predicted value (-‐62%).
This can be remedied by increasing the chamber count of the device or designing cell traps in the device that retain contact cells rather than allowing them to be purely stochastic [19]. This is a critical step in the adaptive immune response, as poor contact between T cells and dendritic cells can reduce the formation of T cell memory [ 22 , 1 ].