In the first chapter, we recover a set of major western normal faults that run along the western slope of the southern Sierra, the Western Sierra Fault System (WSFS). The second chapter is a basement landscape and thermochronometric study of the hanging wall at WSFS. Over the past 50 years, our knowledge of the kinematic history and dynamic forces responsible for the genesis and evolution of these regional features has mimicked global advances in Earth science.
Some of these studies claim to disagree with others, and some claim to integrate several of the others. In Chapter IV, we present a pilot magnetostratigraphic study of the Paleocene Goler Formation, El Paso Mountains, California. Together, these studies aim to contribute to an integrated regional geological understanding of the kinematic and dynamic evolution of central and eastern California.

INTRODUCTION
In the context of published records from the Sacramento and San Joaquin valley subsurface, our data from the Western Sierra Fault System suggest an Eocene tectonic regime dominated by low- to moderate-magnitude extension, surface uplift, and deformation. structural interior of the south. Sierra Nevada and the proximal Great Valley arm. However, important details of previous cycles, such as timing and relative magnitude, elude us. This fault is one of a group running along the western slope of the southern Sierra originally described by Hake (1928), and was dismissed (Wahrhaftig, 1965) and neglected in the literature for most of the last century.
Bayesian Monte Carlo Markov Chain (MCMC) modeling of the thermal history of a sample just upstream of the inferred fault constrains fault activity to approximately 45-40 Ma. Additional thermal modeling of data from the high-relief topography of Kings Canyon east of the fault, but below the area of clearly identifiable glacial erosion, indicates that this Eocene fault activity is also consistent with a kilometer-scale incision pulse in the Kings Canyon. The data and thermal models presented here elucidate an Eocene tectonic regime in which the WSFS played a critical role in generating much of the relief along the modern Kings River.
OVERVIEW OF THE PROBLEM
Previous work
This assumption of rigid behavior has also been extended westward into the Great Valley, where sedimentation has been used to balance erosion of the southern Sierra highlands during rigid westward tilting ( Wakabayashi and Sawyer, 2001 ). Together, these interpretations suggest that low-relief uplands and high-relief canyons were both part of the Late Cretaceous landscape. In this view, it has been argued that much of the shape of the modern landscape mimics Late Cretaceous regional geomorphology.
In another study, Clark et al. 2005) identify two knickpoints in the long profiles of the main trunks and tributaries of the Kings and Kern rivers and argue that these knickpoints correspond to two incision pulses responsible for most of the relief in these canyons. McPhillips and Brandon (2012) integrate published Ap-He and apatite fission track thermochronometry, and aluminum-in-hornblende magmatic geobarometric data into a numerical landscape evolution model that includes much of the modern Sierra. In conjunction with the studies discussed above, we constrain an Eocene tectonic regime that provides insight into the early Cenozoic evolution of the southern Sierra.
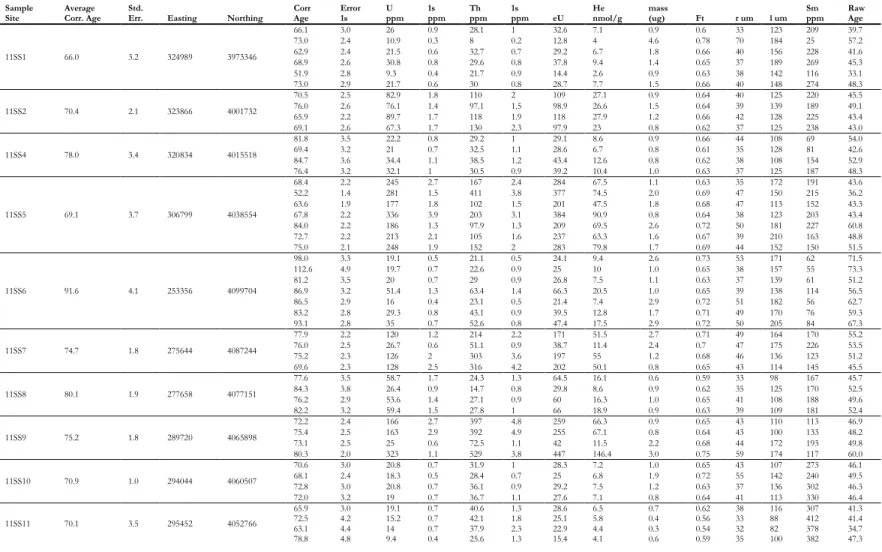
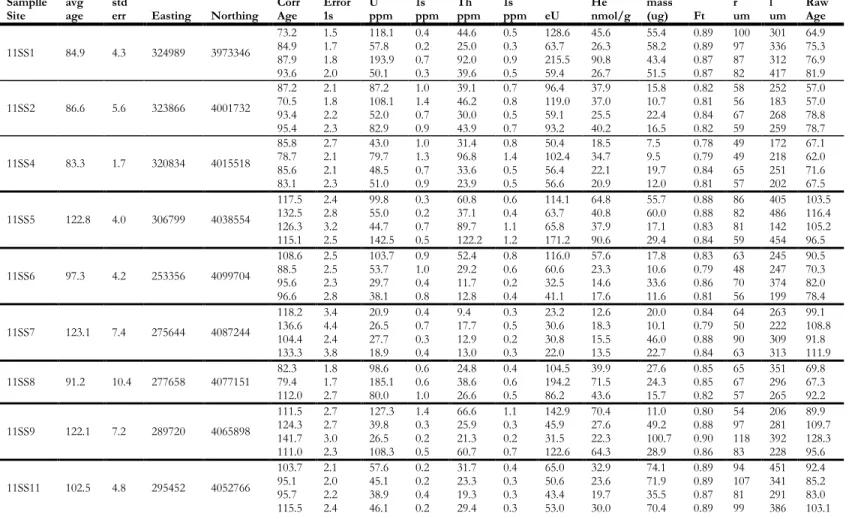
MATERIAL AND METHODS 1 Analytical methods
This balance can be understood conceptually by considering the amount of time the sample has spent in the partial retention zone (PRZ). For example, a sample that has been in the PRZ for a relatively long time will have a diffusely rounded 4He profile, while a sample that has cooled rapidly would have a more squared 4He profile.
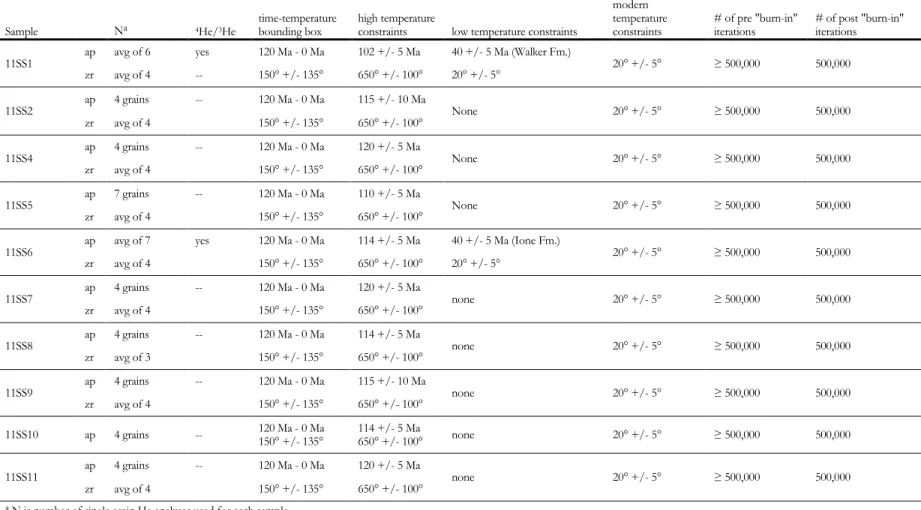
QTQt Modeling
AP-HE DATA
To compare our data with this regional relationship, we plot Ap-He age against corrected elevation for each of the two new vertical transects (FIGURE 2A, B). On both of the new vertical transects, the higher-elevation samples agree well with the regional age-elevation relationship discussed above, as shown by the slopes of the linear regressions shown on FIGURE 2A and B . This deviation is greatest on the KR5- 7 vertical transect (FIGURE 2B), where the bulk Ap-He age of KR7 is 20 m.y.
On the KR1-4 vertical transect, the deviation of the low-elevation samples is of smaller magnitude but in the same direction, with the ages of KR1 and KR3 each around 5 m.y. These deviations from the expected age increasing trend include a local breakdown of the expected pattern of predominantly slow Cenozoic cooling. Furthermore, the large deviation within the KR5-7 vertical transect suggests the possibility of a fault offset (e.g. Maheo et al. 2009).
FAULT IDENTIFICATION
Confirmation of a fault scarp with Ap-He data
We hypothesize that the age offset along vertical transect KR5-7 is due to offset on a discrete west-downward normal fault. In this scenario, cooling ages were already established at the time of the fault, and the slope of the age increase on either side of the fault was the same, as controlled by the slow cooling before 40 Ma. The footwall of the fault (east side) was uplifted and exhumed relative to the hanging wall (west side), and the Ap-He data from each side of the fault should fall on two parallel lines of vertical offset age-height.
To test this hypothesis we overlay more Ap-He data on the KR5-7 age height plot (FIGURE 2C). As predicted, all other Ap-He data from the nearby fault, including our new data (KR8, 13SS6) as well as the data from House et al. 1998) consistently fall into two subparallel, vertically offset ranges for increasing age. Combining the eight Ap-He data points with geomorphic control from our field reconnaissance, we derive a fault trace over 30 km long (FIGURE 1).
THERMOCHRONOLOGIC MODELLING
Footwall low elevation sample: KR8
The top panel shows the t-T probability distribution of assumed thermal histories from the post-combustion phase of the model run. The model result requires that KR8 cooled from more than 80º C to less than 30º C between 45 Ma and 40 Ma, suggesting that the fault was active during, or immediately before, this time.
South-Middle Fork Kings River Vertical Transect: KR1-4
For the lowest sample in the vertical transect, KR1, the individual QTQt model predicts cooling to about 50-60ºC about 45-40 Ma, followed by slow cooling at about 0.8º/m.y. Combined with a reasonable Sierran geothermal gradient of 25ºC/km, this corresponds to about meters of total exhumation at a rate of 0.04 mm/year, which is 60-80% of total vertical relief at the location of the vertical transect, and about 50 -60% of maximum relief in modern Kings Canyon. QTQt simultaneously searches for a t-T path for each of the input data points, which is linearly offset by a temperature value calculated by the model every 1 m.y.
The model result is consistent with the individual models for each sample, showing a rapid cooling event of about 45-40 Ma, after which the upper samples remain below 30ºC and the lower samples cool slowly (FIGURE 6). Not surprisingly, this model is unable to fit the data as well as the individual model runs do (see SUPPLEMENTARY DATA for results from the composite vertical transect QTQt model run). However, the internal consistency of this composite model result with the prediction of rapid cooling from the individual model runs as well as the KR8 model further supports the hypothesis of a major pulse of footwall incision and cooling after fault activity around 45–40 Ma.
DISCUSSION
Implications for incision of Kings River canyon
Accordingly, our data constrain the main phase of relief formation at Kings Canyon to about 45-40 Ma, but are also consistent with previous workers' conclusions that low-relief interfluves at high elevations mimic a Late Cretaceous landscape that was slowly eroded until about 45 Ma .
Integrating the different stories
Eocene faulting and Great Valley Sedimentation Patterns
The location of these vertically stacked, southwest-facing submarine canyons is interpreted to be structurally controlled by the Midland and Kirby Hills fault systems, while the timing of erosion and filling of the canyons is interpreted to be due to variations in sea level. To the south, this graben system continues into the Mount Diablo area, where the Kirby Hills fault joins the Kirker fault on the west side of the graben and the Midland fault terminates in the Brushy Creek fault on the east side (Unruh et al., 2007) . These data from the Great Valley subsurface suggest control of deep marine depocenters along high-angle extensional faults contemporaneous with proximal marine shallowing (Kreyenhagen-Poverty Flats deposition).
The Eocene was a transitional period in the evolution of western North America, between the late Cretaceous and early Cenozoic, the shortening of the Sevier-Laramide crust, and the middle to late Cenozoic initiation and growth of the San Andreas boundary. transformation plate. At that time, the Sierra Nevada was the western flank of an erosion-induced highland that covered much of the west. Using the Ap-4He/3He method, we can distinguish evidence for Eocene tectonics in the southern Sierra and find that it is consistent with evidence from the subsurface of the Great Valley.
CONCLUSIONS
D., 2007, Numerical modeling of the Cenozoic geomorphic evolution of the southern Sierra Nevada, California: Earth and Planetary Science Letters, v. Saleeby, J., 2003, Segmentation of the Laramide slab; evidence from the southern Sierra Nevada region: Geological Society of America Bulletin, v. R., 1991, The Uplift of the Sierra-Nevada and Implications for Late Cenozoic Epeirogeny in the Western Cordillera: Geological Society of America Bulletin, v.
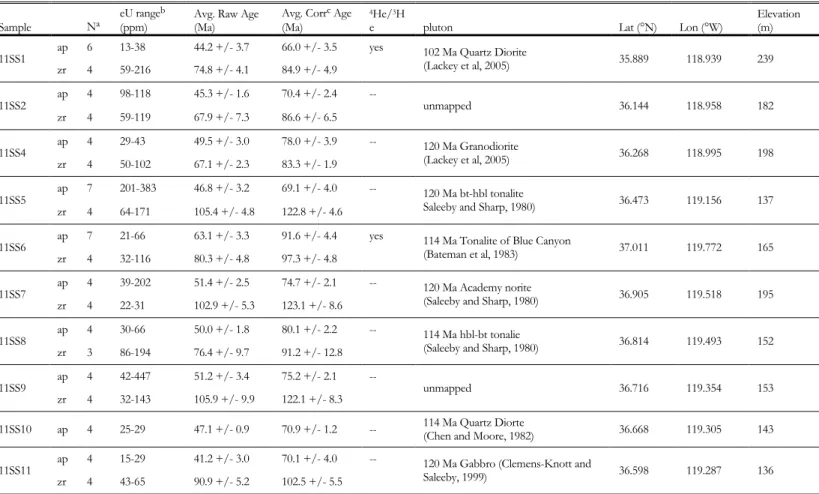
All samples were taken from plutonic outcrops near the western margin of the southern Sierra. This is the same order of magnitude as the Cenozoic in the northern Sierra foothills (Bateman and Wahrhaftig, 1966). N., 1983, Cretaceous deformation in the western foothills of the Sierra-Nevada, California: Geological Society of America Bulletin, v.
B., 1999, Impinging ring dike complexes in the Sierra Nevada batholith, California: Early Cretaceous volcanic arc roots: Geological Society of America Bulletin, v. 2003, Segmentation of the Laramide plate; evidence from the southern Sierra Nevada region: Geological Society of America Bulletin, v. A., 2014, Chronology of tectonic and landscape development of the southern foothills of the Sierra Nevada – eastern San Joaquin Basin.
Cartoon of the summary chronology of tectonic and landscape evolution of the southern Sierra Nevada as described in the text.