New charitable donation data are collected in the panel survey of income dynamics and used to estimate the regression models. The correlation in parents' and children's secular giving (eg, giving to the United Way, educational institutions for poverty alleviation) is smaller, corresponding to the magnitude of the intergenerational correlation in spending. Because widespread giving does not conform to the predictions of models based on utility derived from the available stock of a philanthropically funded public good (Warr 1982; Bergstrom et al. 1986), the discipline has embraced the idea of "warm glow" giving (Andreoni 1989 ), where people find joy in giving of themselves.
We treat secular child giving (eg, giving to the United Way, educational institutions, poverty relief) and religious giving (eg, giving to churches, synagogues, and mosques) separately because the transmission of religion has is likely to play a stronger role in the transmission of religious giving than in the transmission of secular giving, and because it is well known that the determinants of secular giving and religious giving differ (e.g., see Brown and Ferris 2007). A substantial body of evidence in the experimental psychology literature suggests that the transmission of generosity in children is not simply a passive phenomenon similar to, say, The subscript t indicates that the child's endowment and the parent's endowment are measured in the same year.
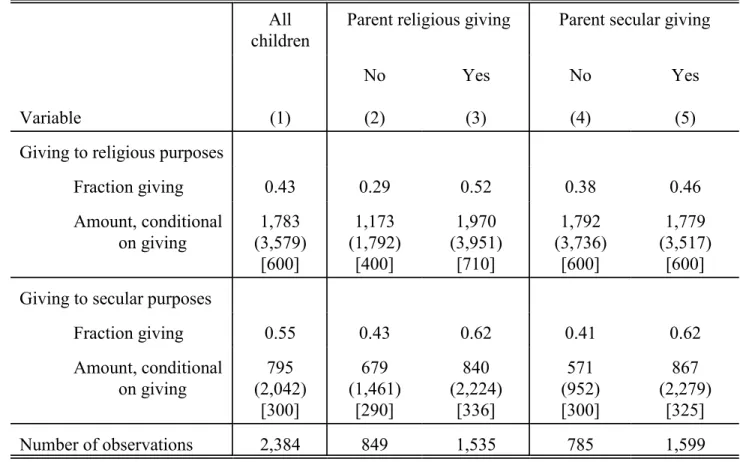
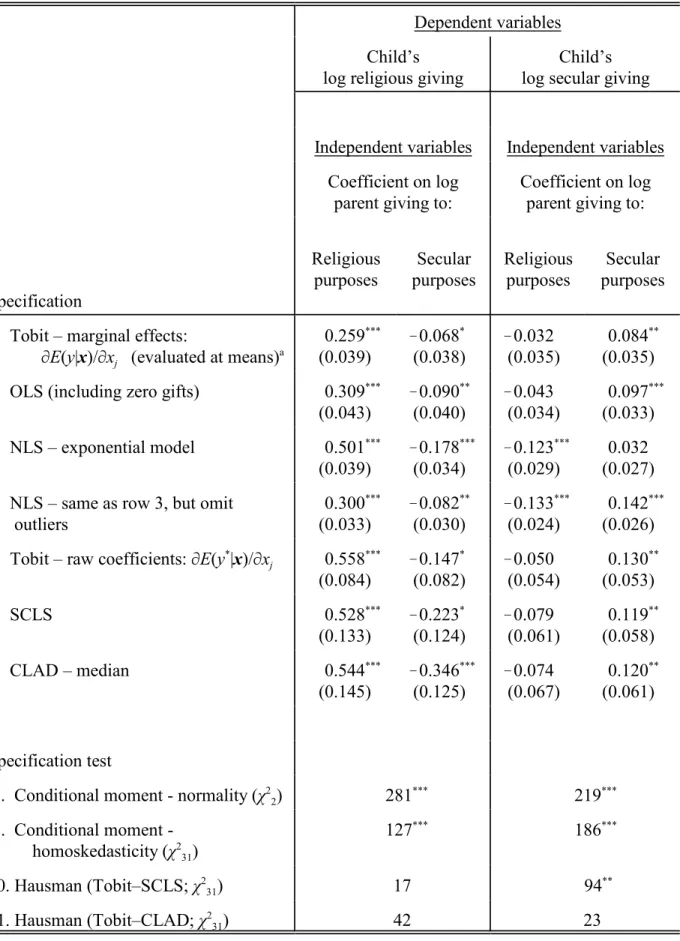
Life-cycle bias is likely to be severe when c2,t is measured when the children are in their twenties as opposed to "well into their thirties (Solon p. 1780)." In the results section, we will do some back-end calculations to gauge the potential. Tobit estimation is the standard approach to dealing with zero c2,t in the charity literature, but departures from homoscedasticity and normality in other literatures have shown that the Tobit inconsistency can be significant (see e.g. Chay and HonorÁ 1998, p.20) . We combine the amounts given to all these other causes into our "secular" giving variable—the other causes are poverty relief, health, education, combined causes (eg, United Way, Catholic . Charities, United Jewish Appeal, etc. ), arts, environmental protection, neighborhood and community organizations, international relief and open, respondent-defined categories.
Asymmetry in the distribution of giving is also visible in the table (medians in square brackets are much smaller than means), which justifies our use of NLS and CLAD.
Results A. Main results
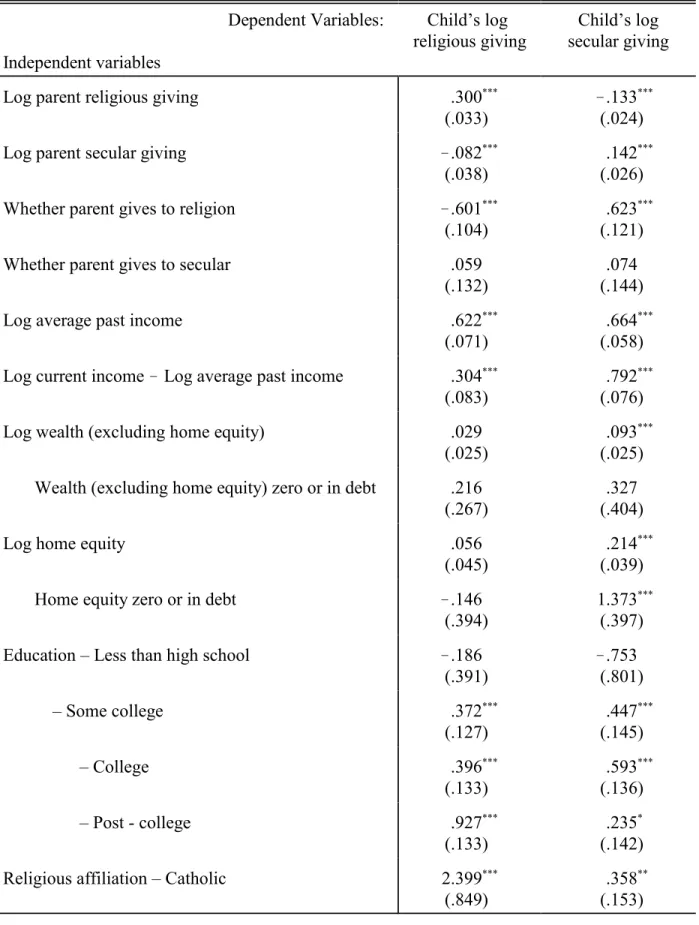
Dropping the same observations in the Tobit and OLS models hardly changes the results. Turning to the secular giving models in the second double-width column, the Tobit elasticity of children's secular giving relative to parents' secular giving (secular elasticity) in row 1 is 0.084. In the NLS-exponential model, the secular elasticity is smaller and insignificant, while the cross-elasticity of children's secular giving relative to parents' religious giving (secular relative to religious elasticity) is significantly negative.
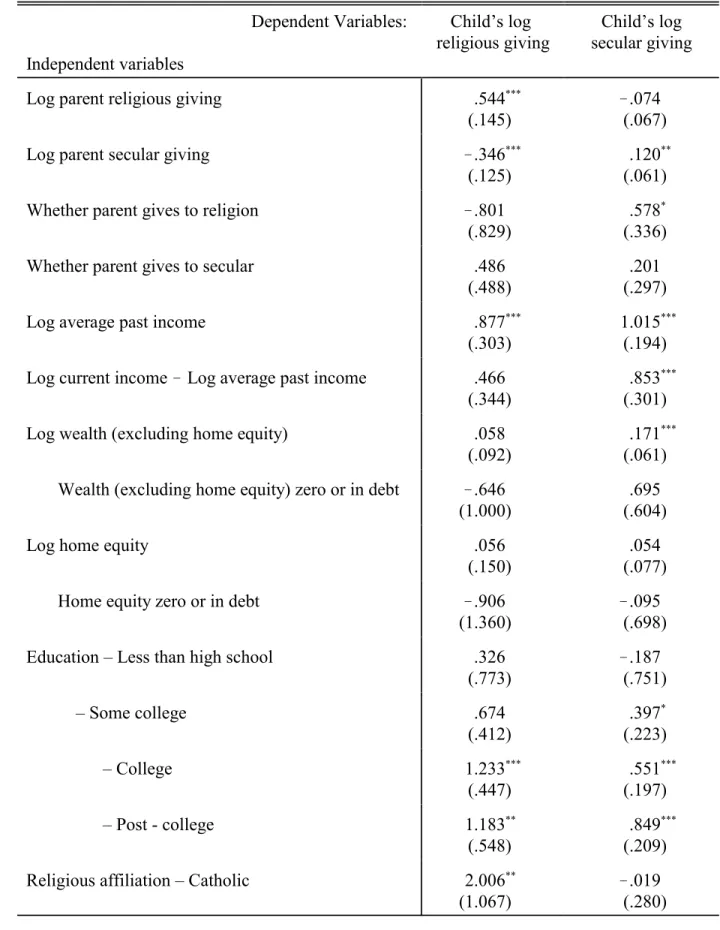
Hausman tests (rows 10 and 11) indicate that the departures from normality and homoscedasticity are for the most part inconsistent with respect to the slope estimates: there is no significant difference between SCLS or CLAD and Tobit in the religious given model, or between CLAD and Tobit in the secular giving model. There is a significant difference between SCLS and Tobit in the secular model, but even here ÷21 tests (not shown) comparing separately the two secular elasticities and the two secular-with-respect-to-religious elasticities do not reject equality. For three of the four intergenerational associations, the dummy variables make no qualitative difference in the interpretation of the elasticities.
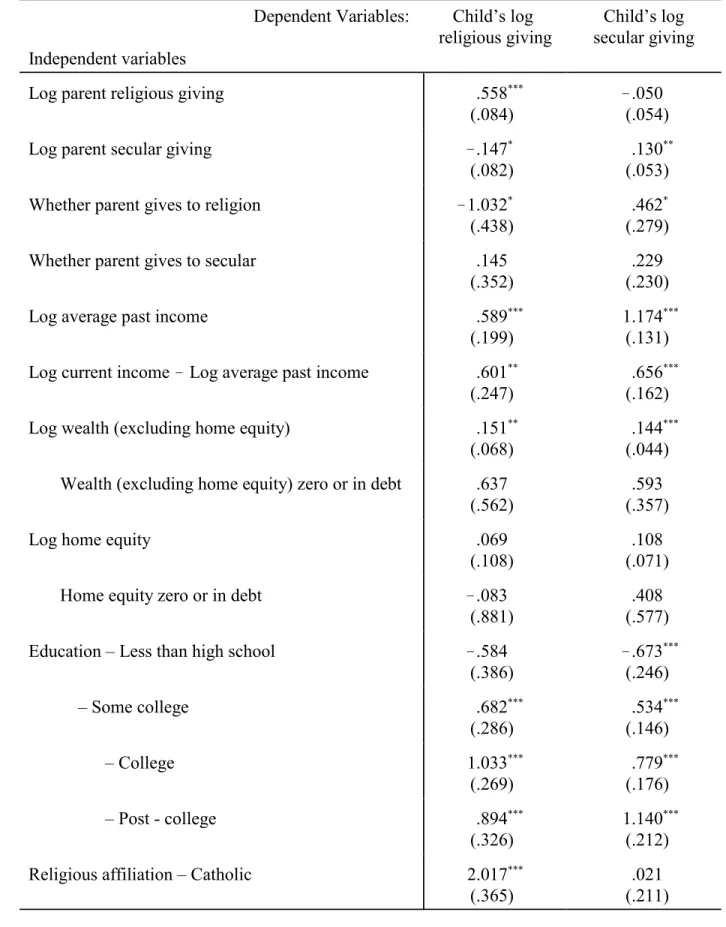
For the religious-to-secular cross-association, however, the dummy variable makes a qualitative difference: Tobit's latent coefficient for whether the parent gives something for religious purposes is .462 (std. dev.. 279); combining that with the !.050 (albeit insignificant) secular-with-respect-to-religious elasticity estimate indicates a positive relationship between parents' religious giving and children's secular giving for parents who give to religious causes, but less than percent of parents in the sample , who give to religion, give less than $10,300). If religious giving is less subject to life-10 cycle bias, then a greater religious elasticity in the young subsample is a better control for the presence of measurement error. Parents' current income is significant in the religious giving model, and parents' average recent past income over 1994–2000 is on the margin of.
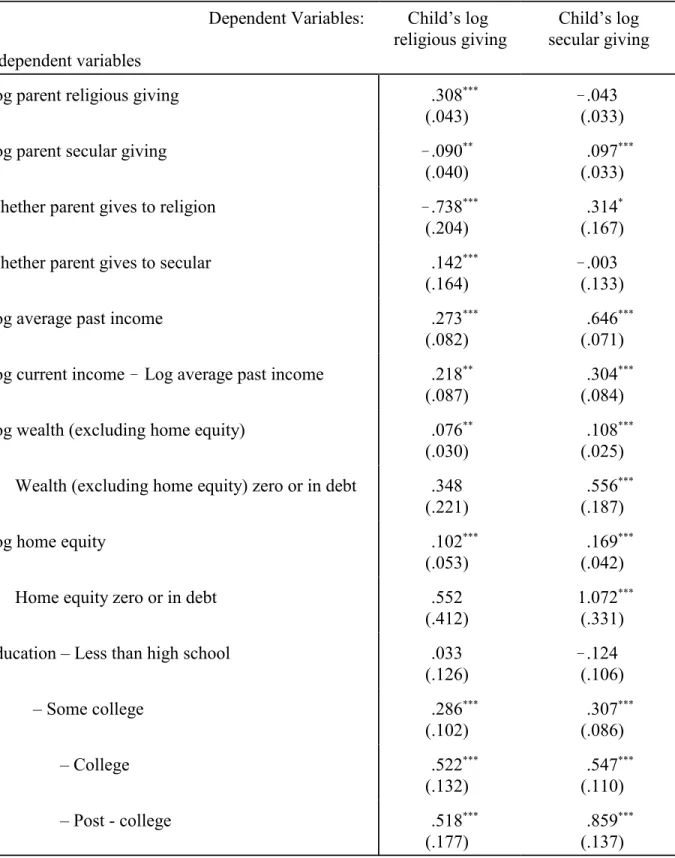
In a model with the full set of parental characteristics, intergenerational elasticities are estimated using the variation in parental giving variables orthogonal to the observed parent. Adding the controls leads to a small drop in the religious elasticity and does not change the secular elasticity.13. In models of religious giving, there is evidence of a positive relationship with education, marriage, living in the South, and (not surprisingly) religious affiliation.
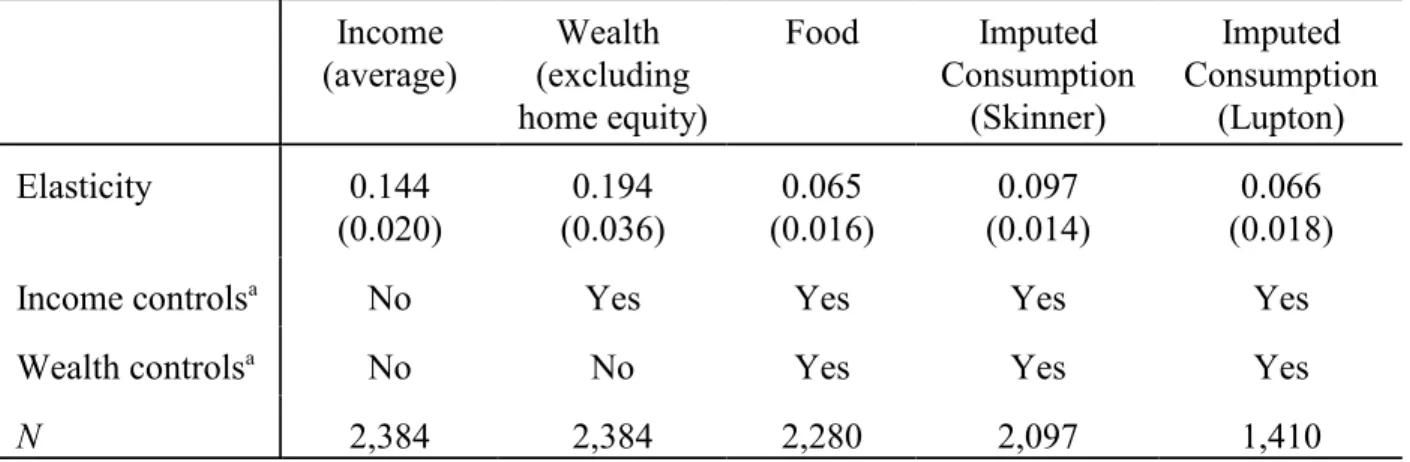
In secular models of giving, those with greater wealth (specifically a measure of wealth without equity), higher education, and those who are married give more. Secular elasticity is in the same range as expenditure elasticity, but less than income and wealth. The non-linearity in the far left part of the religious giving curve reflects the negative.
The level of the child's secular giving and the slope in relation to the parents' secular giving are smaller than in the drawing of the children's religious giving. In the same way, a love of art can be transmitted, but this will only affect the correlation in art giving if generosity towards art is also transmitted.
Conclusions
Estimates of the elasticity of children's giving relative to parents' giving are consistent with the view that children's warm glow emanates (at least in part) from parents, a view that is in turn consistent with the findings of psychologists studying the development of pro- social behavior in children. Notes: The dependent variable in the first two columns is the amount given for religious purposes; in the second two columns the dependent variable is the amount given for secular purposes. Other controls included in the models but not shown are: dummies for whether the parent gives for religious and secular purposes; current income and average past income (both in logs); home equity and wealth excluding home equity (both in registers); wealth and home equity dummies are zero or negative; education and religious affiliation of the head of the household;
In lines 3 and 4, the dependent variables are in levels: y = exp(XNâ) + u where XNâ are the same independent variables as in the other lines; the models in rows 3 and 4 are estimated using nonlinear least squares. The regressions include the demographic controls listed in Table 2, and the income and wealth controls as shown in the current table. Social Capital and Philanthropy: An Analysis of the Impact of Social Capital on Individual Giving and Volunteering.” Non-Profit and Voluntary Sector Quarterly.
Content of sermons and power of the model/preacher: the effect on children's generosity." Developmental Psychology. From Faith to Commitment: The Community Service Activities and Finances of Religious Congregations in the United States, Findings from a National Survey. The term m c represents the effect of the parent's role model of charity on the generosity of her son.
To lighten the notational burden, we do not include parental controls other than income (you can see how other parental controls .. would enter the analysis by following y), but other parental controls are examined in the empirical work. Ideally, we would like to evaluate (R.4) because then we could obtain separate evaluations. Note that parental income (y and y) and parental unobservables (u and u) enter. R.5) only because of the elimination of c and the substitution for ã, which we did because we are.
And, as we noted in the text, estimates of ñ are not sensitive to the inclusion of parental controls other than c1,t. We now turn to a discussion of the econometric problems in estimating ñ , unless the econometric problems are described in detail in the text. If common unobservables are a problem but less correlated when parents and children live in different states (because the local need conditions to which parents and children respond are different in the different states), then a robustness test—estimating models with data from parents and children living. in different conditions—will cause it to drop to zero (it does not; see bottom of page . 16 of the text).
The term !á ô á -1 u is measurement error that arises because we are trying to estimate the combination of automatic/cheap transmission and role modeling, whereas c1,t is a noisy measure of the latent variable ã1 modeling automatic/low - cost transmission. In the text (pages 6-7), we argued that adding current and past observable parental variables such as income to (1) provides an informal control for the presence of measurement error because both parental income and measurement error terms enter (1) in a parallel path through the mismatch between c1,t. In the text (page 15), we report mixed evidence from adding parents' current and past income to (1).
Current and recent parental income variables enter (1) significantly in the children's religious giving model and at the significance limit in the children's secular giving model.