On behalf of the editor and also the organizing committee, I would like to express our joy that the scientific papers presented in the Conference can finally be compiled and published in the form of Proceedings of the 7th Asian Crop Science Association Conference. Selection and Evaluation Characteristics of Six Candidate Varieties of Cucumber (Cucumis sativus) in the Dry Season Plant.
Improving Photosynthesis to Increase the Productivity of Crops Akiho Yokota
Impacts of Climate Change and Climate Variability on Productivity of Food Grain Crops
P V Vara Prasad
The Plant Improvement of Tolerance to Oxidative Stresses
Shigeru Shigeoka
Oligosaccharides such as galactinol and raffinose, which often accumulate in high concentrations, can act as antioxidants and also as osmoprotectants in plant cells. Transgenic Arabidopsis plants overexpressing GolS1 and GolS2, key enzymes in the synthesis of galactinol and raffinose, had increased levels of these oligosaccharides and increased tolerance to increased oxidation induced by exposure to paraquat, chilling, and osmotic stress (Plant Physiol.
Salt Resistance Mechanism of Metroxylon sagu, Starch-producing Palm
A dense distribution of Na was observed in the inner region of the cortex near the endodermis. Therefore, it can be suggested that the rate of increase in the chlorophyll concentration of the treated plants may also be low.
How to Increase Food Crop Productivity in Asia Narasim Upadyayula
Biosynthesis of Nicotine as an Anti-insect Defense in Plants Takashi Hashimoto
Food Security and Agriculture Biotechnology Progress in Indonesia Tantono Subagyo, Fadlilla Dewi Rakhmawaty
14-3-3 Proteins Act as Intracellular Receptors for Rice Hd3a Florigen
Food security is a complex interplay of forces and is more than just a question of supply and demand. RSIS/CNTS proposed four dimensions of food security in the conceptual model, namely food availability, physical access, economic access and utilization.
Improvement of Oil Palm Productivity Tony Liwang
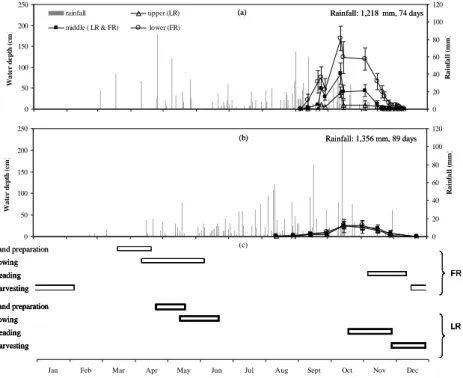
Characterization of Water Availability, Management Practices and Grain Yield for Deepwater Rice in Northwest Cambodia
Rainfall distribution and water depth at the 3 field locations (upper, middle and lower) in WSR 2009. Low yield in WSR 2009 was mainly due to (1) the lack of water at the course stage of both FR and LR, (2) non- or late application of N fertilizer to LR, (3) inadequate weed control to.
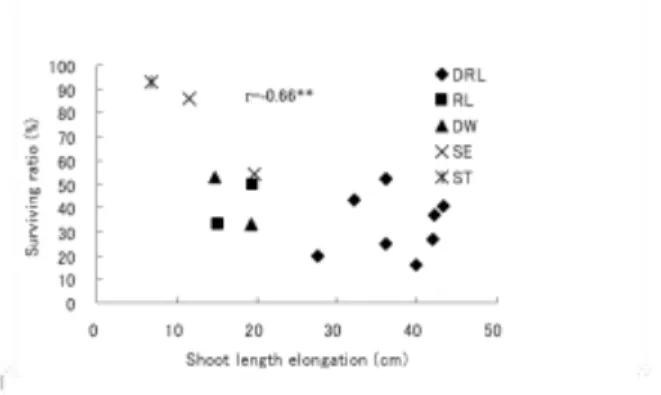
Submergence Escape in Oryza glaberrima Steud
ST were plotted in the region of short shoot elongation and strong increase in DMA (dry matter accumulation), while O. Principal component analysis was performed with the increase of DMA from 1 DAD to 14 DAD, and residence at 1 DAD, shoot elongation during immersion and increased DMA during immersion.
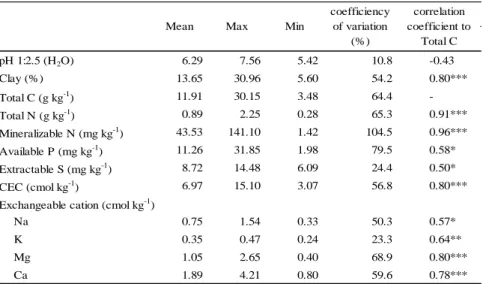
Toposequnential Variation in Soil Fertility and Limiting Nutrient for Rice Growth in the White Volta Floodplain of Northern Ghana
Toposequence variation in soil fertility and limiting nutrient for rice growth in the White Volta floodplain of Northern Ghana. This study revealed steep gradients in soil fertility within a gentle slope of a river floodplain in northern Ghana.
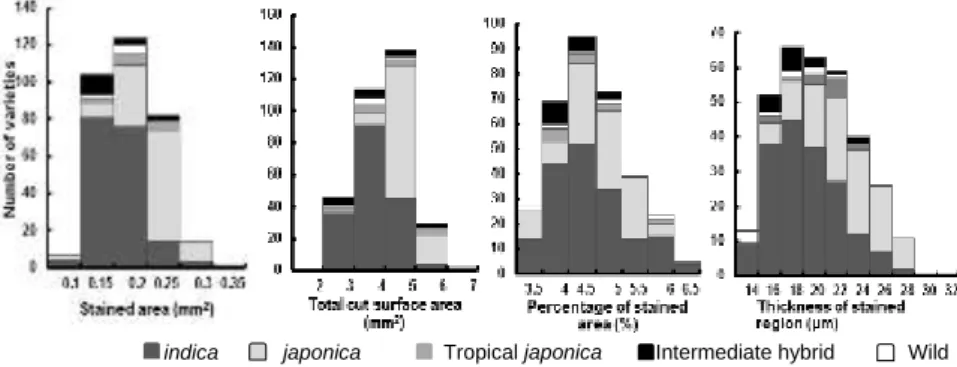
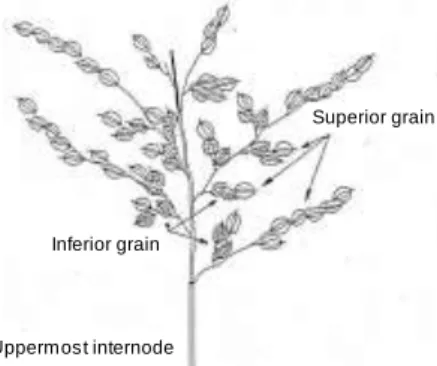
Varietal Differences of Rice (Oryza sativa L.) Genotypes for Aleurone Traits Contributing to Lipid Content
Then, the percentage of the aleurone layer and the average thickness of the aleurone layer were calculated using the same formulas in the half-seed staining method. Therefore, the area of the colored region can be used as a good indicator for the selection of varieties according to the thickness of the aleurone layer.
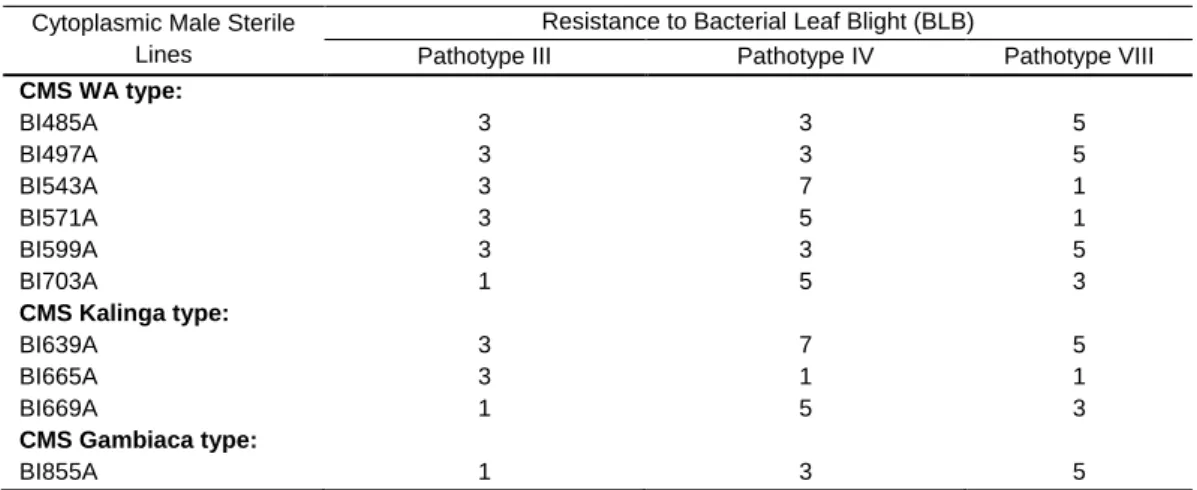
Development of New Cytoplasmic Male Sterile Lines with Good Flowering Behavior for Hybrid Rice Breeding
Evaluating the behavior of blooms that support cross-capability between new CMSs and their maintainers. The results showed that new CMS lines with different cytoplasm source can be used in rice hybrid breeding.
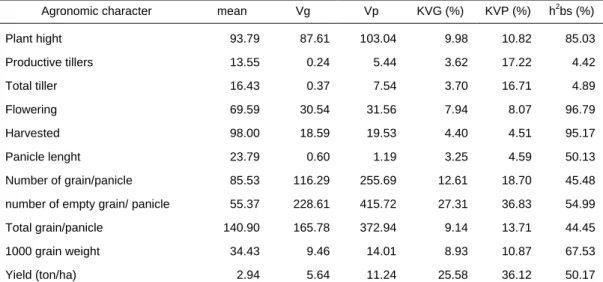
Genetic Analysis of Superior Double Haploid Rice Lines Developed from Anther Culture
Nugraha Lestari (2007) mentioned that the opportunities for improvement of grain yield can be done with the selection of the character of the number of grains per panicle and grain yield drying. Therefore, the improvement of grain yield can be done by the selection of plant height, flowering age, age of harvest, panicle length, number of empty grain / panicle, 1000 grain weight and grain yield per hectare dry. High broad sense heritability value generated on the characters were plant height, flowering age, age at harvest, panicle length, number of empty grain/ panicle, 1000 grain weight and grain yield per hectare dry. Therefore, the characters can be used as benchmarks for improvement. the character of the next generation of this crop.
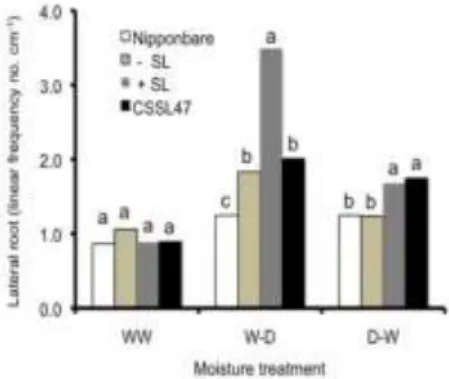
QTLs on Chromosome 12 Responsible for Expressing Root Plasticity under Transient Soil Moisture Fluctuation Stress in Rice
QTLs on Chromosome 12 Responsible for the Expression of Root Plasticity under Transient Soil Moisture Fluctuation Stress in Rice. The linear frequency of lateral root number per cm of the four genotypes grown under different soil moisture conditions: i.e. Effect of the presence of QTL at short arm of chromosome 12 on shoot dry matter production and total root length under different transient soil moisture fluctuation conditions.
Yield and Related Traits in Two Japonica Rice Lines Carrying Ur1 Gene
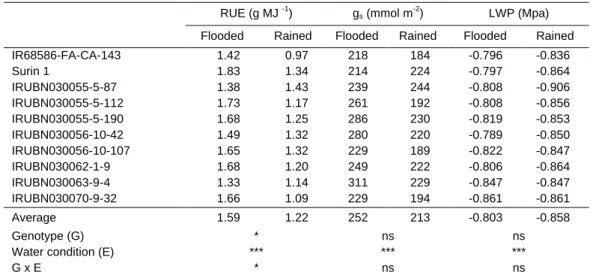
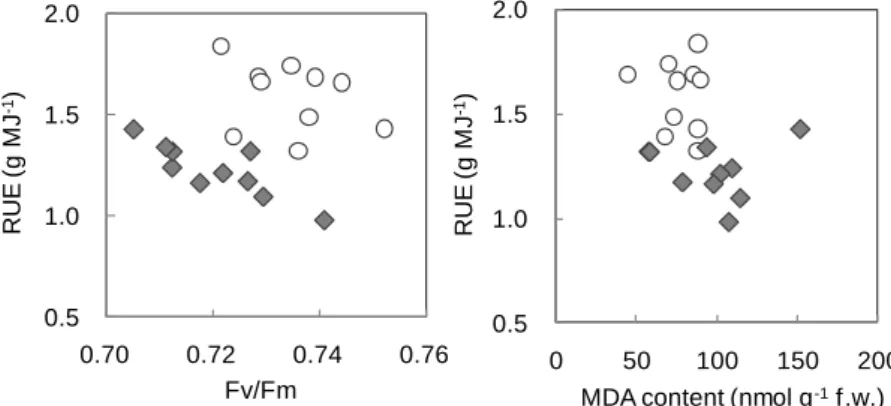
Oxidative Stress and Its Relation to Radiation Utilization Efficiency in Rice Cultivation under Rainfed Conditions in Northeastern Thailand. Most genotypes reduced their overall shoot growth under rainy conditions relative to that under flooded conditions. Decrease in Fv/Fm due to high PAR was greater under rain condition than under flooded condition (Figure 2).
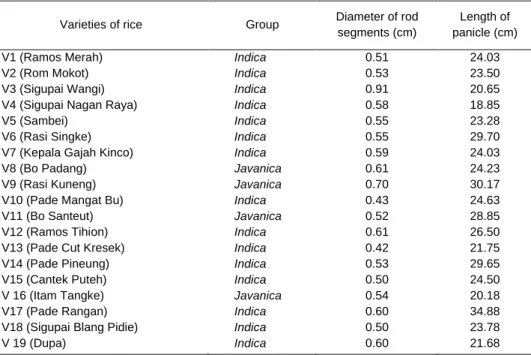
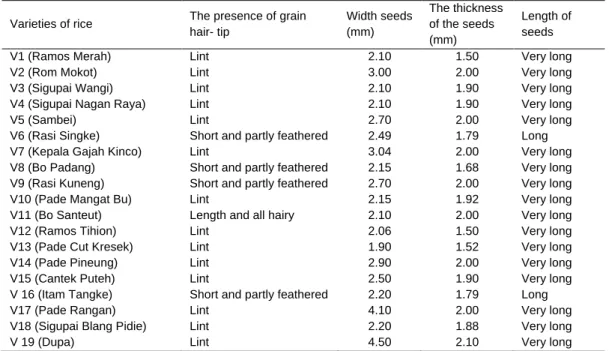
The Growth Characteristics of Some Varieties of Aceh‟s Local Rice (Oriza sativa L.) on Acid Soils
The aim of this study was to identify the agronomic traits and morphology of 18 local rice cultivars in Aceh based on rice cultivar classification and to observe their resistance to soil acidity. Classification of rice based on morphological characteristics, rod segment diameter and panicle length of rice plants. Very long Very long Very long Very long Very long Very long Very long Very long Very long Very long Very long Very long Very long Very long Very long Very long Very long.

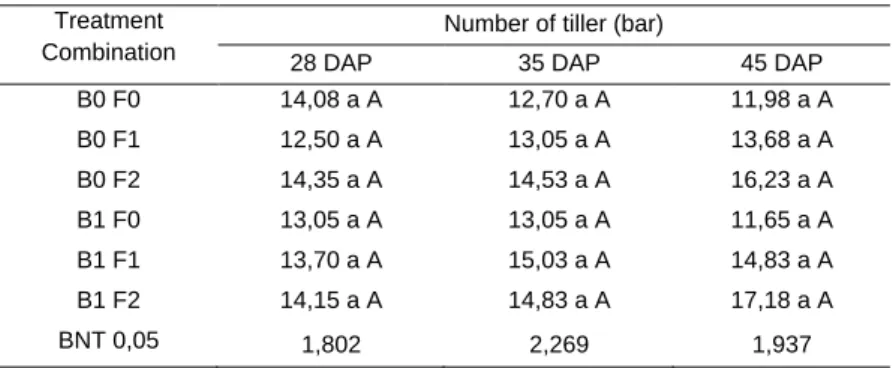
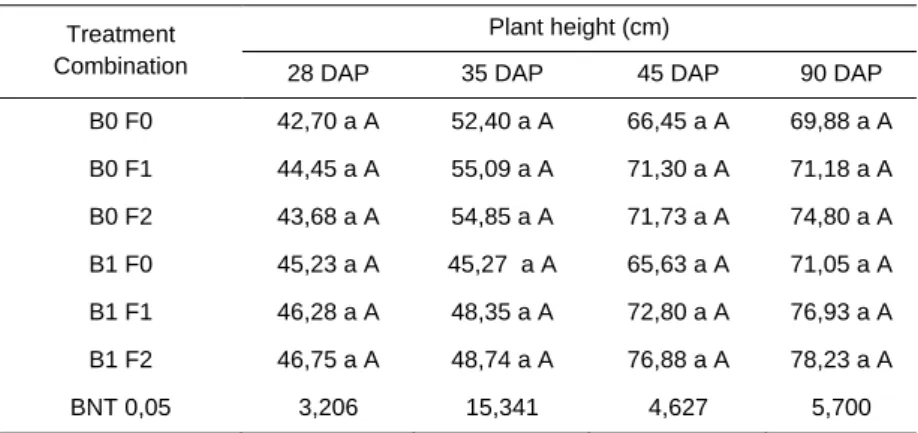
Effect of NPK Fertilizer and Biochar Applications on Growth and Yield of Irrigation Rice
Biochar at 10 tons ha-1 tends to increase the yield component of the paddy plant compared to without Biochar treatment. Increasing the NPK dose tends to improve the yield component of paddy rice plant compared to those without NPK treatment. This can also restore the chemical properties of the soil with enough nutrient elements, so that it affected the increase of the yield component of the paddy plant.
Effects of New Foliar-Application Fertilizer Containing 5-Aminolevlinic Acid on Yield Increase of Direct-Sowing Rice Plants
The effect of spraying 5-ALA fertilizer on the percentage of ripened grain and the yield component was evaluated at the harvest stage. The percentage of ripened grain in rice plant treated with 5-ALA fertilizer is shown in Table 2. Effects of 5-ALA fertilizer sprayed by the helicopter on the percentage of ripened grain in cv.
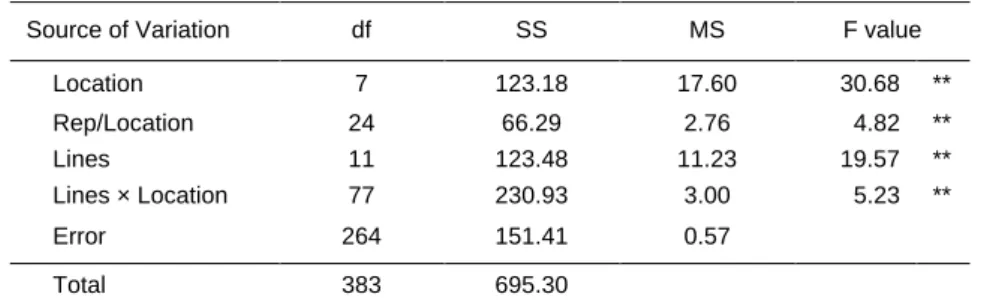
Yield Stability Evaluation of Upland Rice Lines Obtained from Anther Culture
Average dry grain yield (tons/ha) of DH upland rice lines at each trial site. Dry grain yield stability parameters of DH upland rice lines from eight locations are presented in Table 3. Dry grain yield stability parameters of DH upland rice lines from eight locations.
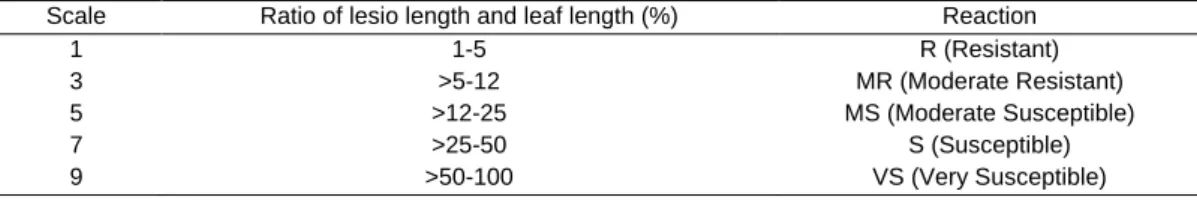
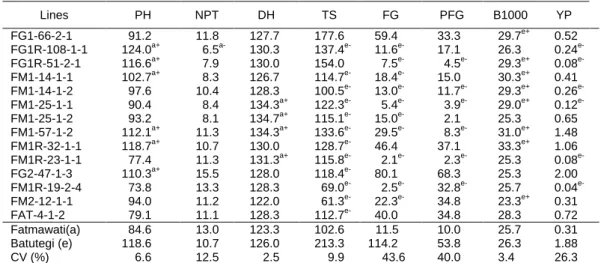
Yield and Blast Resistance Evaluation of Upland Rice Lines with New Plant Type Characters
Observations were made on 5 plants per plot on the variables: plant height, number of farmers producing, days to harvest, total kernels per wedge, percentage of filled kernels, weight of 1000 filled kernels, productivity, rate and intensity of leaf and neck blast. blast disease. According to Herawati (2010) the number of spikelets per panicle of NPT upland rice is more than 150 per panicle. The population had high heritability (h2bs) in leaf and neck blast resistance, plant height, filled grain per panicle, days to harvest, number of grains per panicle and 1000 filled grain weight.
Functional Analysis of Drought-Induced OsLEA3 Promoter Isolated from Batutegi Rice Cultivar
The promoter sequence primers were designed based on the gene sequence of the LEA3 HVA-like gene promoter from rice cultivar IRAT 109 (GenBank Acc. DQ837728) and aligned with the BAC sequence of chromosome No. Primer sequences are also designed to include the start codon. ATG) of the LEA3 gene mRNA sequences (GenBank Acc. DQ789359) and additional EcoRI (G↓ AATTC) and BglII (A↓GATCT) sequences in order to add EcoRI and BglII restriction sites to the primers. The leaf powder is placed in polypropylene tubes containing 10 ml of buffer solution which has been preheated in the incubator at 65oC for 30 minutes.

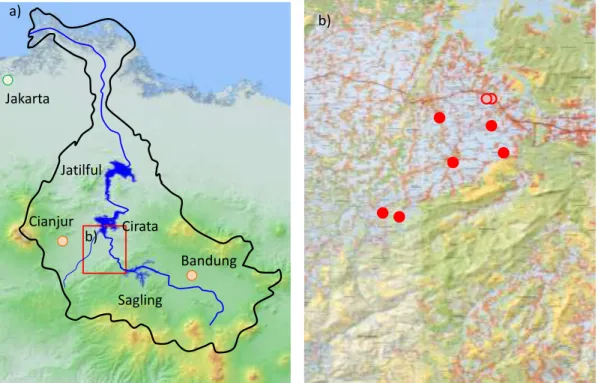
Evaluation of the Nutritional Environment for Rice in Cianjur, Indonesia for Development of an Advanced Basin Model for Asia
Evaluation of the rice nutrient environment in Cianjur, Indonesia for the development of an advanced basin model for Asia. The activities will evaluate nutrient concentrations in irrigation water, soil solution and plants, and their relationship with rice growth will be analyzed using a rice growth simulation model. The research area is in the hydrographic basin of the Citarum River in West Java, Indonesia.
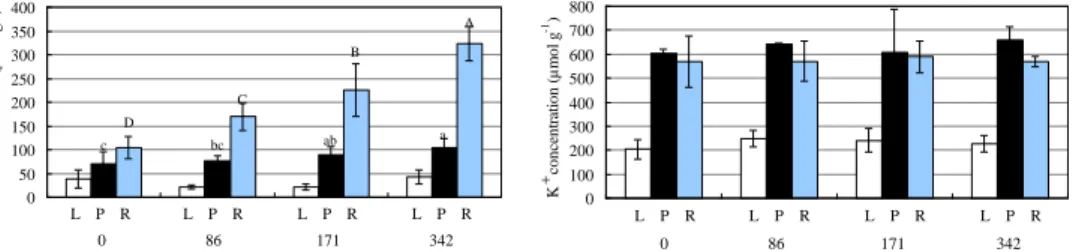
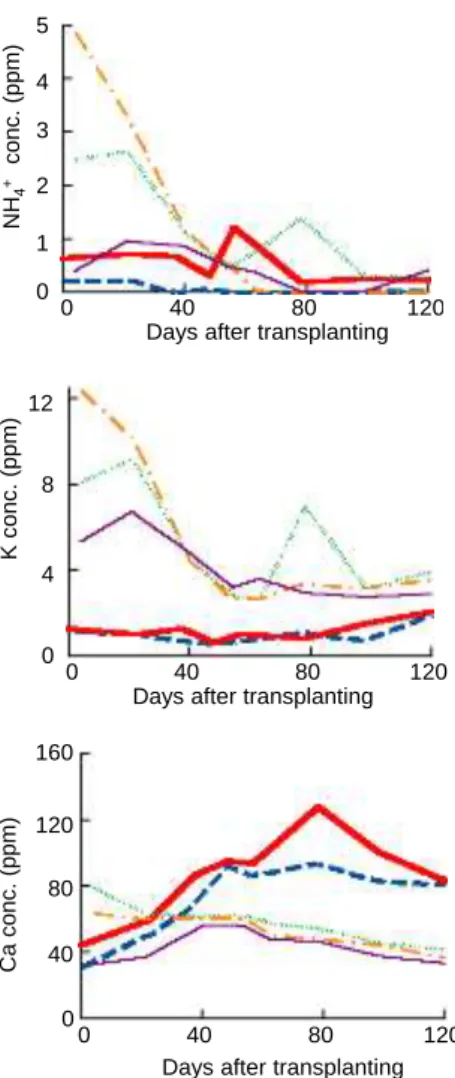
The Nutritional Environment in Nonfertilized Rice Production and Its Effect on the Nutritional Quality of Brown Rice
The difference in the P concentrations between the Expt and NN fields was consistent with the soil chemical analysis (data not shown). Although the P concentration in the soil solution was negligible, the plants absorbed P from the soil (data not shown). The N and K concentrations in brown rice almost mirrored those in the soil solution: brown rice concentrations in the NN fields were generally lower than those in the Expt field.
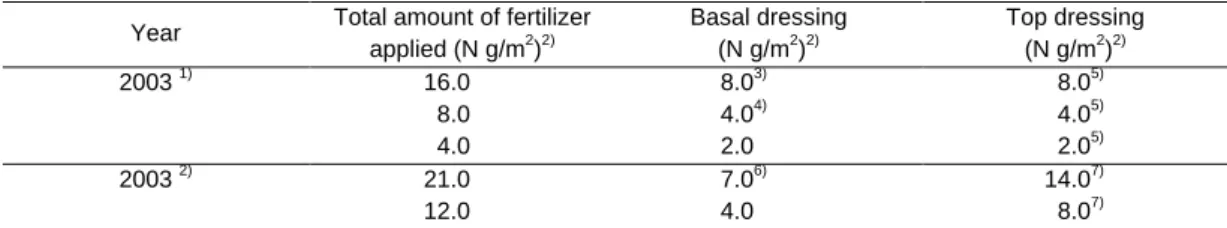
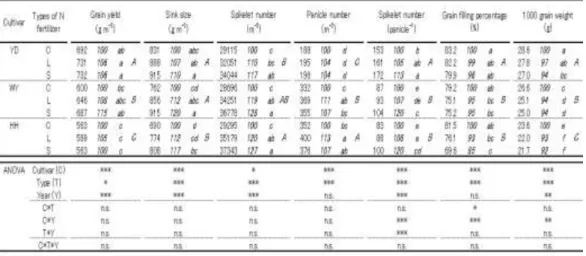
Effect of Slow Release Fertilizer on Yield and Yield Components in Chinese High-Yielding Rice Cultivars
The effect of the slow release fertilizer on yield was not significant in Exp.2 (Table 2). These effects of the slow release fertilizer on yield were due to the increase in pit size (the number of spikelets m-2 multiplied by one grain weight, Venkateswarlu and Visperas, 1987) due to the increase in the number of spikelets m-2 in both experiments. , although the weight of 1000 grains decreased significantly with the increase in the number of spikelets m-2 (Table 1, 2). The effect of the S-type slow release fertilizer was more effective on the increase in sink size and spikelet panicle-1 number than that of the L-type.
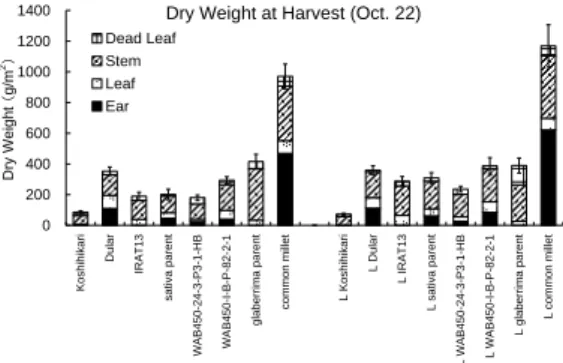
Drought Resistance of NERICA Compared with Asian Rice, African Rice and Millets in the Field with Different Fertilization Levels
Dry weight at harvest at low fertilizer level tended to be higher than at standard fertilizer level. Soil water content at 0-20 cm depth in the standard fertilizer level was low in the glaberrima parent of NERICA (Figure 3). At low fertilization, stomatal conductance and dry weight at harvest tended to be greater than at standard fertilization.
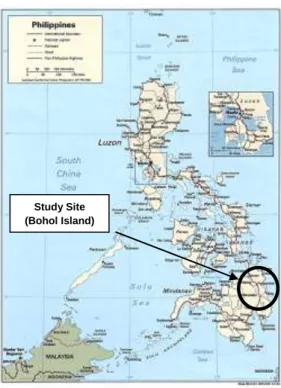
Social Experiment of Volumetric Irrigation Fee Scheme
Case of Gravity Irrigation System in Bohol, the Philippines
The amount of water consumed was estimated based on the meter reading three times a day (morning, noon and afternoon) at the main gate of each TSA. To further study the farmers' response to the experimental interventions, changes in water intake were compared across experimental groups. Factors affecting the total water intake other than the experiment are rainfall, amount of water released from the dam, NIA's promotion of water saving technology.
Ultraviolet-induced Fluorescence of Rice Leaf as Influenced by Nitrogen Application and Cultivars
In this study, we developed a new UV-induced fluorescence measurement system to detect the fluorescence of secondary metabolic materials and of chlorophyll in order to evaluate the photosynthetic activity of crops. The fluorescence peaks were in the region of 400–650 nm, 685 nm and 740 nm, and the spectrum patterns varied with the different nitrogen levels. In conclusion, the differences in these results suggest that soil nitrogen levels and different cultivars influence the fluorescence patterns of leaf blades.
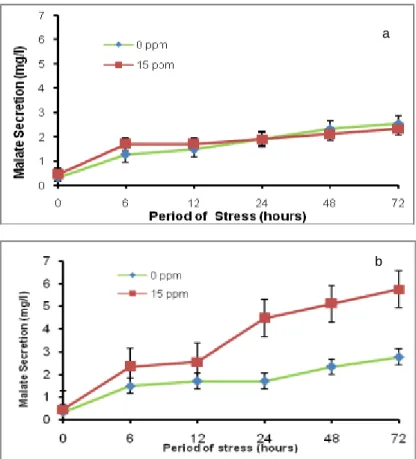
Locus for Malate Secretion in Rice Chromosome 3
Malate secretion from, rice root cv IR64 (a) and Hawara Bunar (b) along the 72 h period of Al stress. Chi-square test for monogenic inheritance pattern of malate secretion in F2 population malate secretion class. Genetic map of the rice chromosome 3 harboring the locus for malate secretion trait contains five markers viz.
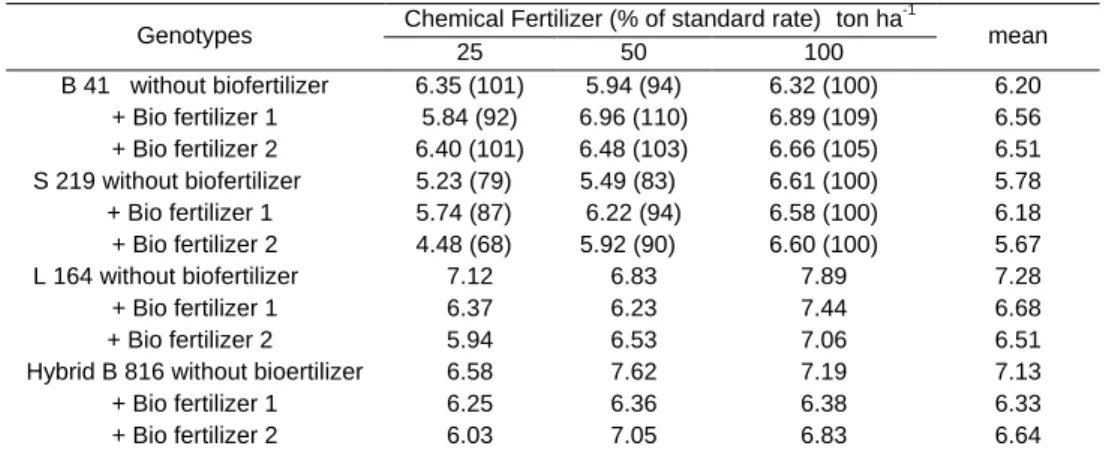
Responses of Nutrient Efficient Maize Genotypes to Bio-fertilizer at Low Chemical Fertilizer Doses
The yield of B 41 at 50 % chemical fertilizer dose was 94 % of its own yield at 100 % chemical fertilization rate without bio-fertilizer. The data indicate that the chemical fertilizer dose can be reduced by 50% with the application of biofertilizer only for B 41 genotype. The effect of genotype on yield was higher than the bio-fertilizer (data not presented).
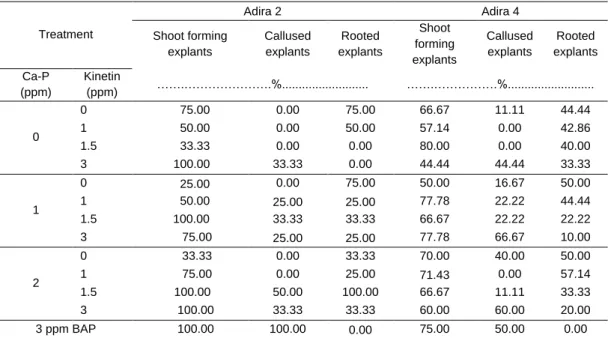
As shown in Table 3, the highest number of leaves for Adira 2 variety at 10 WAP resulted in medium containing 3 ppm BAP. As shown in Table 4, the highest multiplication rate was achieved in the medium containing 3 ppm BAP for both varieties. The highest shoot proliferation rate was achieved in the medium containing 3 ppm BAP for both varieties.
Wet Injury of Wheat in Upland Field Converted from Paddy Field in Japan
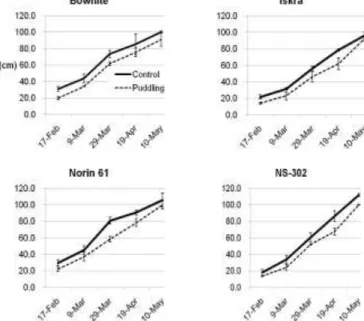
A similar trend was observed in repeated tests in the next wheat growing season. Changes in plant height of 4 wheat cultivars in control condition (solid line) and waterlogged (wet) condition (dashed line) in season. Root aerenchyma can be seen within 48 h after the onset of hypoxia in seminal roots (our study) and adventitious roots (Malik et al. 2003) in wheat.
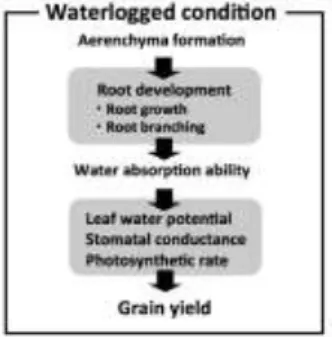
Roles of Root System Development and Function in the Growth and Yield under Waterlogged Condition in Common Wheat
Roles of root system development and function in growth and yield under water-stressed conditions in common wheat. The critical value to inhibit the growth of sago palm was considered to be about 200 ppm Al in the growth medium. Effect of Al concentration on nutrient concentrations in leaflets, petioles, roots and whole plants (experiment 2).
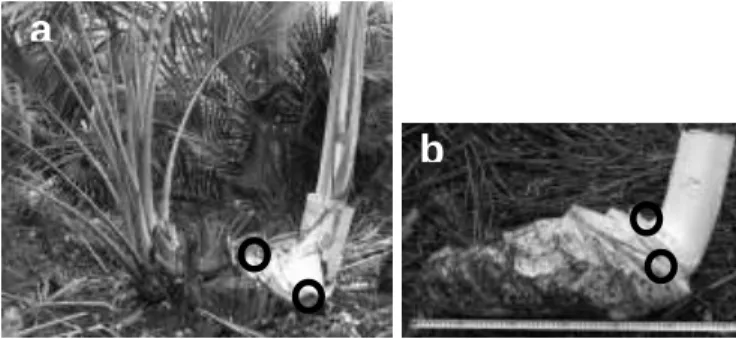
Transplanted Sucker Stem Growth in Sago Palm (Metroxylon sagu Rottb.) Before Trunk Formation
The length of the transplanted sucker stem was determined as the distance from its end to the tip of the shoot, which was covered with a thick leaf sheath. Stem length was observed to increase gradually, possibly increasing exponentially until the beginning of the linear extension of increasing stem length (Goto et al., 2010). In conclusion, the rate of creeping growth of sucker stems in a field was specified after transplanting by monitoring stem length.
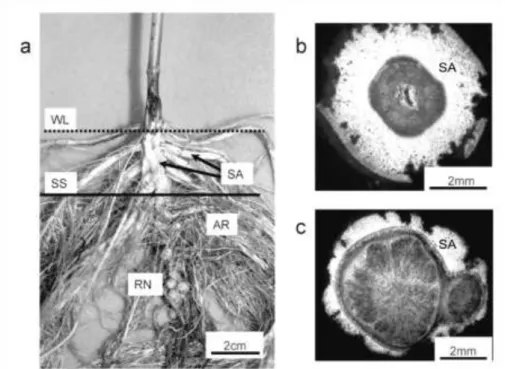
Secondary Aerenchyma Formation and Root Growth Response of Soybean (Glycine max) Seedlings under Flooded Conditions
Secondary Aerenchyma Formation and Root Growth Response of Soybean (Glycine max) Seedlings Under Flooded Conditions. We investigated secondary aerenchyma formation in soybean seedlings grown under flooded conditions (Shimamura et al., 2003). Formation and function of secondary aerenchyme in hypocotil, roots and nodules of soybean (Glycine max) under flooded conditions.
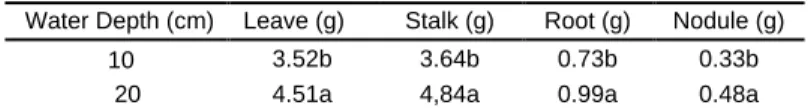
Agronomical Performances of Soybean Cultivated under Saturated Soil Culture on Tidal Swamps
There was the influence of bed width on the leaf, stem, root and bud dry weight. The effect of bed width on leaf, stem, root and bud dry weight at 6 WAP. There was the influence of water depth and bed width interaction on the leaf, stem, root and bud dry weight.