THE TRANSIENT RECEPTOR POTENTIAL VANILLOID-1 CHANNEL AND NEURONAL SURVIVAL IN DEGENERATIVE DISEASE
By
Nicholas J. Ward
Dissertation
Submitted to the Faculty of the Graduate School of Vanderbilt University
in partial fulfillment of the requirements for the degree of
DOCTOR OF PHILOSOPHY in
Neuroscience August, 2014 Nashville, Tennessee
Approved:
Professor David J. Calkins Professor Bruce D. Carter Professor Rebecca M. Sappington
Professor Kevin L. Schey
ii
ACKNOWLEDGMENTS
I would like to thank my advisor, Dr. David Calkins, for his commitment to my training as a scientist. It has been a pleasure working with a mentor who is so passionate about research and pursuing interesting scientific questions. Looking back upon my training, his energy and enthusiasm influenced so many of my successes here at Vanderbilt. Agreeing to mentor a
doctoral student is not a small commitment, and I appreciate that he invested his time and efforts into my development as a scientist. In addition to Dr. Calkins, I received excellent advice and guidance from the members of my thesis committee. I am thankful to Bruce Carter, who headed my committee and allowed me to pursue a teaching apprenticeship under his guidance. Since joining the Neuroscience Training Program, I have admired his kind nature and dedication to helping students grow as scientists. Dr. Rebecca Sappington was instrumental in my early training by teaching me many lab techniques during my rotation project in her lab. As I
progressed through my project, I benefitted tremendously from her expertise in glaucoma and the visual system. At each of my committee meetings, Dr. Kevin Schey asked questions that showed a thoughtful consideration of my project and its aims. I appreciated that he would push me to think of my project in a way that reached beyond simply discussing data to understanding what that data meant in the context of disease pathology and treatment.
Throughout my time in the lab, I have relied upon the help and encouragement of the fantastic research team that Dr. Calkins has assembled. Dr. Wendi Lambert worked directly with me on many of the experiments presented here, and I am indebted to her for her patience and helpfulness at all stages of my research. Dr. Carl Weitlauf also worked with me on these
experiments, and his willingness to provide me with filled ganglion cells made Chapter 4 of this dissertation possible. Wendi and Carl served in many capacities—they helped me brainstorm,
iii
troubleshoot, and think critically about my data—and their efforts deserve special recognition.
Brian Carlson handled many aspects of animal care throughout my project and worked with Wendi on the incredible number of microbead injections involved in all parts of this dissertation.
Karen Ho has been an excellent colleague and fellow graduate student, and it has been exciting to work on projects with and alongside her. Ann Gearon and Erin Eckard, both previous
members of the Calkins lab, aided in tissue preparation that was critical for gathering data that appears in Chapter 2. Tina Tian, Tracey Hong, and Kelsey Karas composed a skilled team of both past and present undergraduates who helped me with many aspects of image analysis and quantification. I am so proud to have been a part of this supportive and caring team of
researchers.
My research was made possible by a combination of funding from Dr. Calkins and the Vanderbilt Vision Research Center (VVRC) Training Grant, which is managed by Dr. Jeff Schall. My training in both vision and neuroscience research was a collaborative effort that spanned three groups: the VVRC, the Vanderbilt Eye Institute (VEI), and the Neuroscience Training Program of the Vanderbilt Brain Institute (VBI). I am especially thankful to the
Neuroscience Training Program’s leadership, especially Drs. Mark Wallace and Doug McMahon for their efforts in creating a strong program for all VBI trainees. Between the VVRC, VEI, and VBI, there are many administrative assistants who helped me. I am grateful for the tireless efforts of Gale Newton (VVRC), Vanessa Alderson (VEI), Roz Johnson (VBI), Shirin Pulous (VBI), Beth Sims (VBI), and Mary Michael-Woolman (VBI). My research was additionally aided by Marie Rodriguez from the VVRC histology core as well as by the Cell Imaging Shared Resource. Both of these core resources enabled me to gather much of the data found in Chapters 2 and 3.
iv
I would not have pursued a doctoral degree had it not been for the significant efforts and guidance of many people. When I was a freshman at St. Ignatius High School in Cleveland, Ohio, Mrs. Jo Ann Lane first opened my eyes to the incredible world of biology, a course that she taught with great enthusiasm. This excitement took hold in me, and I majored in biology at University of Notre Dame, where Dr. Michelle Whaley mentored me in pursuing research opportunities with Drs. David Hyde and Joseph O’Tousa. I am grateful for their willingness to teach me how to think scientifically, a skill I relied upon throughout graduate school. I have had many teachers and mentors throughout my life, and this sequence began with my father and mother, Robert and Rosemary Ward. As a physics teacher and librarian, respectively, they valued learning and encouraged my scientific pursuits. They have always been my inspiration to follow my interests, and I have looked to them for support and advice countless times throughout the years. None of this would have been possible without their love and support.
v
TABLE OF CONTENTS
ACKNOWLEDGMENTS ... ii
LIST OF FIGURES ... viii
Chapter 1. INTRODUCTION ...1
The visual system and degenerative diseases of the central nervous system ...1
Glaucoma pathogenesis ...3
Clinical presentation of glaucoma ...3
RGCs and their susceptibility to glaucomatous neurodegeneration ...7
Degenerative progression in glaucoma ...10
Neurodegeneration in glaucoma ...14
Ca2+ homeostasis is dysregulated in neurodegeneration ...14
Axonal transport disruption in neurodegenerative diseases ...18
Degenerative cellular mechanisms in glaucoma ...19
Protective responses of the retina and RGCs ...21
Ca2+-mediated plasticity and a role for TRPV1 in neuronal survival ...23
Role of Ca2+ in homeostatic synaptic plasticity ...23
Potential for TRPV1 to influence RGC survival in vivo...24
TRPV1 modulates CNS function ...25
The TRP channel family ...25
The structure of TRPV1 ...26
Regulation of TRPV1 ...29
TRPV1 in the CNS...29
TRPV1 in neuronal function ...31
TRPV1 in synaptic transmission and plasticity ...32
TRPV1 in neurodegeneration ...35
TRPV1 in glaucomatous neurodegeneration ...36
Specific Aims of Dissertation ...38
Aim 1. Determine influence of TRPV1 on RGC degenerative outcomes ...38
Aim 2. Determine compartmental nature of TRPV1 response in RGCs ...39
Aim 3. Establish relevance of TRPV1 in survival of RGC dendrites ...39
2. ABSENCE OF TRPV1 ACCELERATES STRESS-INDUCED AXONOPATHY IN THE OPTIC PROJECTION ...40
Introduction ...40
Materials and Methods ...43
Animals, tissue harvesting, and tissue preparation ...43
Trpv1-/- mouse ...43
Trpv1-/- and C57 mouse genotyping ...44
Induction of ocular hypertension by microbead occlusion ...46
Anterograde tracing of retinocollicular and retinogeniculate tracts ...48
vi
Preparation of optic nerves ...50
Quantification of RGC axons...53
Immunohistochemistry in retinal wholemount tissue ...53
RGC soma quantification ...55
Mapping of CTB transport onto retinal quadrant and eccentricity coordinates ...56
Statistical methods ...56
Results ...57
Trpv1-/- mice exhibit a truncated Trpv1 gene...57
Trpv1-/- accelerates axonopathy in the optic projection ...57
Trpv1-/- influences RGC survival in the retina...64
Discussion ...71
3. ELEVATED PRESSURE INCREASES RETINAL TRPV1 AND ITS RELATION TO GANGLION CELL SYNAPSES ...76
Introduction ...76
Materials and Methods ...79
Induction of ocular hypertension by microbead occlusion ...79
Tissue preparation ...79
Quantitative PCR ...79
Immunolabeling of retinal paraffin sections ...80
Imaging and quantification of immunohistochemistry ...81
Statistical methods ...82
Results ...83
Regulation of Trpv1 transcript levels following microbead-induced IOP elevation ...83
TRPV1 protein levels increase transiently in response to IOP elevation ...84
Modulation of dendritic and synaptic protein levels by elevated IOP ...87
Colocalization of TRPV1 with postsynaptic protein PSD-95...90
Discussion ...94
4. TRPV1 INFLUENCES RETINAL GANGLION CELL DENDRITIC COMPLEXITY ...98
Introduction ...98
Materials and Methods ...101
Intracellular labeling of RGCs ...101
Morphometric quantification of RGC dendrites ...102
Sholl analysis of RGC dendrites ...104
Statistical methods ...104
Results ...105
Microbead-induced IOP elevation in C57 and Trpv1-/- mice ...105
Morphometric analysis of RGCs from C57 and Trpv1-/- mice ...106
Sholl analysis of RGCs from C57 and Trpv1-/- mice ...109
Discussion ...116
vii
5. SUMMARY ...120
Purpose of studies ...120
Determining the influence of TRPV1 on RGC degenerative outcomes ...120
Determining the compartmental nature of the TRPV1 response in RGCs ...121
Establishing the relevance of TRPV1 in survival of RGC dendrites ...123
Potential mechanisms of TRPV1 in RGC survival ...124
TRPV1-based interventions for neurodegeneration in glaucoma ...126
Conclusions ...131
REFERENCES ...132
viii
LIST OF FIGURES
Figure Page
1.1. Visual field defects in human glaucoma patients ...3
1.2. Optic disc cupping in human glaucoma patients ...5
1.3. Production and outflow of aqueous humor in the eye ...6
1.4. Retinal circuitry and layers ...8
1.5. Dysregulation of Ca2+ in neurodegenerative disease ...15
1.6. TRPV1 is a member of the transient receptor potential family ...27
1.7. Interaction with other signaling pathways can traffic TRPV1 to the plasma membrane ...28
1.8. TRPV1 is a polymodal cation channel ...30
1.9. TRPV1 contributes to synaptic plasticity ...34
2.1. Elevation of intraocular pressure by microbead occlusion of aqueous outflow ...48
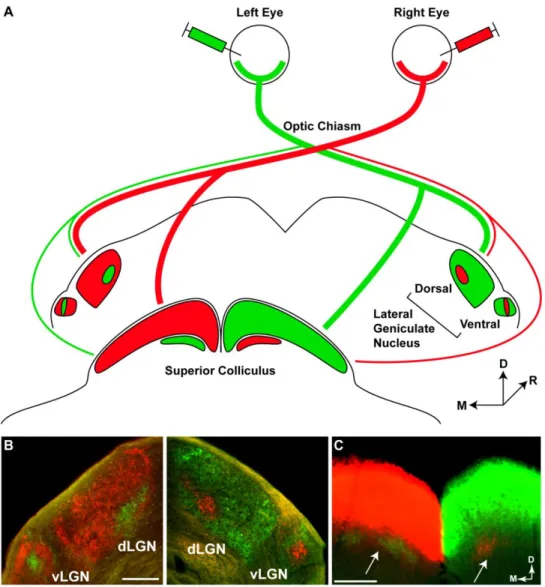
2.2. Anterograde tracing of the mouse retinogeniculate and retinocollicular tracts ...49
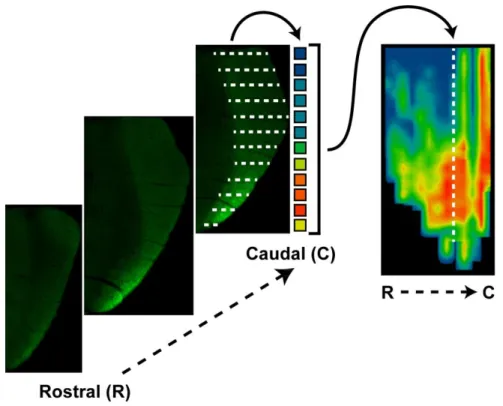
2.3. Creating a retinotopic map of fluorescent CTB transported to the SC ...51
2.4. Quantification of axons in optic nerve sections ...54
2.5. Confirmation of knockout in Trpv1-/- mice...57
2.6. Microbead-induced elevations in mouse intraocular pressure ...58
2.7. Trpv1-/- exacerbates microbead-induced transport deficits to the LGN ...59
2.8. Trpv1-/- exacerbates microbead-induced transport deficits to the SC ...61
2.9. Trpv1-/- exacerbates deficits in anterograde axonal transport ...63
2.10. Quantification of anterograde transport in the superior colliculus ...65
2.11. Trpv1-/- mice exhibit more severe optic nerve pathology following elevated IOP ...66
2.12. Quantification of axon loss in the optic nerve ...67
ix
2.13. Progression to RGC body loss accelerated in Trpv1-/- mice ...68
2.14. Quadrant-specific RGC body loss in Trpv1-/- ...69
2.15. Microbead-induced anterograde transport deficits in SC are retinotopically sectorial ...70
3.1. Microbead-induced IOP elevation for animals used in Trpv1 transcript qPCR ...83
3.2. Trpv1 transcript levels following microbead-induced pressure elevation ...84
3.3. Microbead-induced IOP elevation for animals used in histological experiments ...85
3.4. TRPV1 protein levels transiently increase following IOP elevation ...86
3.5. Microbead-induced IOP elevation transiently increases TRPV1 protein levels ...87
3.6. Controls for immunohistochemistry protocol ...88
3.7. Dendritic MAP2 protein levels transiently increase following IOP elevation ...89
3.8. Postsynaptic PSD-95 protein levels transiently increase following IOP elevation ...90
3.9. Quantification of PSD-95 and MAP2 protein levels in the inner plexiform layer ...91
3.10. Ocular hypertension transiently increases TRPV1 and PSD-95 protein in inner plexiform layer ...92
3.11. Ocular hypertension transiently increases proximity of TRPV1 and PSD-95 proteins ...93
4.1. Quantification of RGC dendritic morphometry ...103
4.2. Microbead-induced IOP elevation for animals used in morphological studies ...105
4.3. Lucifer Yellow-filled RGCs from C57 mice ...107
4.4. Traced C57 mouse RGCs used for morphometric measurements ...108
4.5. Lucifer Yellow-filled RGCs from Trpv1-/- mice...110
4.6. Traced Trpv1-/- mouse RGCs used for morphometric measurements ...111
4.7. Quantification of RGC morphometry ...113
4.8. Sholl analysis of C57 and Trpv1-/- RGC dendrites ...114
x
4.9. Trpv1-/- affects dendritic complexity as determined by Sholl analysis ...115 5.1. Timeline of degeneration and potential for intervention ...130
1 CHAPTER 1
INTRODUCTION1
The visual system and degenerative diseases of the central nervous system
One particular difficulty of studying components of the mammalian central nervous system (CNS) in vivo is the relative inaccessibility of the neural tissue. The CNS consists of the brain and spinal cord, which work together to process and integrate information from the environment and to exert control over an organism’s interactions with that environment. The brain is encased in a protective cavity formed by the bony neurocranium, while the spinal cord is housed within a protective bony structure known as the vertebral column. Such protective structures help minimize trauma to the vertebrate CNS; however, these same structures are a hindrance to experimental manipulation and imaging of the CNS in vivo (London et al., 2013).
To circumvent these hindrances, many neuroscientists have turned to studying the retina, a comparatively accessible CNS structure found within the eye (Ames and Nesbett, 1981; Nowak, 1987).
The retina, a neural tissue that lines the posterior portion of the eye, is the first component of the visual system that encodes incident light from the environment into a neural signal that can be interpreted by the brain. As vertebrates develop embryonically, the retina and optic nerve form as an outgrowth of the brain’s diencephalon, and are therefore considered part of the CNS.
1Portions of this chapter were published as a co-authored review: Ho KW, Ward NJ, Calkins DJ.
TRPV1: a stress response protein in the central nervous system (2012) Amer J Neurodegener Dis 1:1-14.
2
Both the retina and optic nerve each partially house a unique type of neuron known as the retinal ganglion cell (RGC). Like other neurons of the CNS, the RGC neurons are specialized to serve a particular purpose, that is, to convey visual information from the retina to regions of the brain critical for vision. Although very specialized for the visual system, these neurons are known to exhibit similarities to other CNS neurons, as they respond similarly to injury and exhibit a diminished potential for axonal regeneration subsequent to injury (Crish and Calkins, 2011;
London et al., 2013).
Indeed, links between brain pathologies and degeneration of RGCs have been established in several diseases. In Alzheimer’s disease (AD), accumulations of β-amyloid (Aβ) and
phosphorylated tau are associated with the degeneration of multiple brain regions (Wenk, 2003).
Similarly, these accumulations exist in the retinas of both AD patients (Koronyo-Hamaoui et al., 2011) and transgenic mouse models of the disease (Ning et al., 2008; Gasparini et al., 2011). In humans, AD patients exhibit reduced RGC numbers and degeneration of the optic nerve (Hinton et al., 1986; Sadun and Bassi, 1990). In multiple sclerosis (MS), a demyelinating disease, many patients are diagnosed with optic neuritis, in which RGC degeneration and demyelination is observed (Ghezzi et al., 1999). Therefore, it appears that RGCs may be adversely affected by AD and MS in much the same manner as other CNS neuronal populations.
Using this knowledge that RGCs can be affected by disease and injury in a similar fashion to other CNS neurons, it is reasonable to believe that studies of RGC degeneration could likewise inform research related to all CNS degenerative diseases. This document will present studies related to one such disease, glaucoma, which results in the degeneration of RGCs. Taking advantage of the accessibility of the retina, these studies examine how the cation channel
transient receptor potential vanilloid-1 (TRPV1) influences RGC survival in response to
3
neuronal stressors in glaucoma. By understanding how TRPV1 influences survival in RGCs, we will be able to better determine how the channel may influence neurodegeneration throughout the CNS.
Glaucoma pathogenesis
Clinical presentation of glaucoma
Glaucoma is a family of optic neuropathies that causes progressive visual loss due to dysfunction and death of RGCs. It is the most common cause of irreversible blindness
worldwide, and it is estimated that nearly 80 million people will be affected by this disease by the year 2020 (Quigley and Broman, 2006). Age and sensitivity to intraocular pressure (IOP) are the two main risk factors for developing glaucoma, and of these two, IOP is the only modifiable risk factor.
Figure 1.1. Visual field defects in human glaucoma patients. Visual field maps were collected using standard automated perimetry on right eyes of patients. Each map is from the perspective of the patient, so the left side of each map is located nasally and the right side is located
temporally. Darker areas represent reduction in sensitivity, and the natural blindspot can be observed in patients with normal visual field, as in A. Glaucoma typically affects peripheral vision first as in B and C. Late-stage patients who have very progressed visual field deficits retain vision only in their central visual field, as in D.
Figure from Hollands et al. (2013), and used in accordance with Copyright Clearance Center’s RightsLink service.
4
In the clinic, glaucoma is typically defined by a number of characteristics. Primary among these are deficits in the visual field and thinning of the retinal nerve fiber layer (RNFL).
Visual field loss can be assessed by perimetry, in which the examiner maps the patient’s field of vision. Scotomas, or areas of visual field loss, are a hallmark of glaucoma (Figure 1.1). Although a variety of visual field defects are possible, the most common alterations to the visual field in glaucoma are arcuate scotoma (Levin, 2001). This scotoma commonly forms an arc that starts temporally near the region of the optic disc, curves around into the superior or inferior field, and ceases toward the nasal end of the horizontal axis (Figure 1.1B). Many patients do not notice the scotoma formation until it is well-progressed, as peripheral vision is affected much earlier than central vision (Figure 1.1D). The structural correlate of these visual field losses can be observed in the clinic by thinning of the RNFL, the retinal layer composed of RGC axons traversing toward the optic disc. Thinning of the RNFL is caused by loss of RGC axons, and can be
associated with an increased “cupping” at the optic disc as observed in clinical ophthalmoscopic exams (Figure 1.2).
While outcome measures of glaucoma (e.g., visual field defects, RNFL thinning) are specific in nature, the etiology of this family of diseases is complex. To address this, cases of glaucoma that exhibit elevated IOP are typically grouped into one of two types: open angle and closed angle (Hollands et al., 2013). The “angle” referred to by each of these names is the iridocorneal angle formed by the iris and the cornea (Figure 1.3). The integrity of this angle is crucial for the proper drainage of aqueous humor, which both nourishes avascular eye tissue and maintains IOP. Aqueous humor is continuously produced in the posterior chamber of the eye, and it must flow through the pupil, into the anterior chamber of the eye, and finally exit at the angle via the trabecular meshwork (Figure 1.3). The proper balance of aqueous humor
5
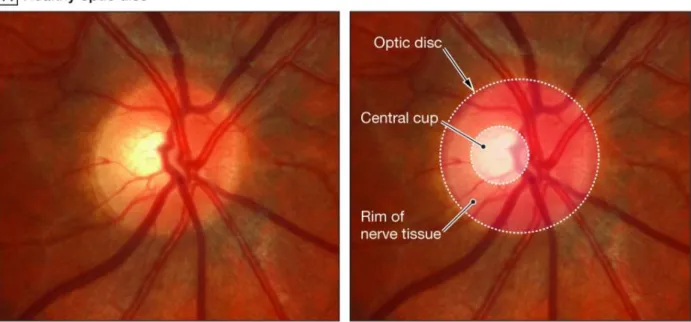
Figure 1.2. Optic disc cupping in human glaucoma patients. The optic disc, where RGC axons leave the eye to form the optic nerve, is the anatomical location of the eye’s blind spot. A, A healthy optic nerve typically exhibits a slightly cupped shape (inner circle, central cup) where the RGC axons come together while leaving the retina. B, As glaucoma progresses, loss of RGC axons results in a thinning of the retinal nerve fiber layer that contributes to the shape of the central cup. When these axons are lost, the size of the central cup increases. When examining the eye, clinicians often speak of glaucoma patients exhibiting a high cup-to-disc ratio, meaning that the size of the central cup is large with respect to the size of the entire optic disc structure.
Figure from Hollands et al. (2013) and used in accordance with Copyright Clearance Center’s RightsLink service.
6
production and drainage maintains IOP within the eye, thus any blockage or defects that exist in structures at the angle may disturb regulation of IOP.
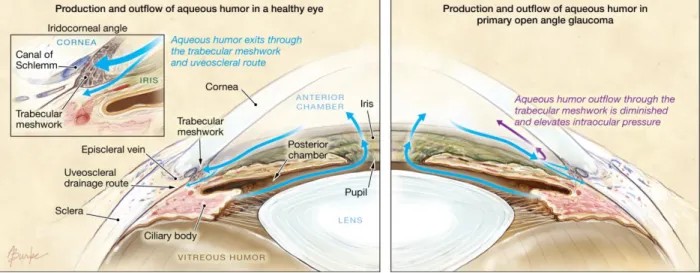
Figure 1.3. Production and outflow of aqueous humor in the eye. Aqueous humor is continually produced by the ciliary body to nourishes avascular eye tissue as well as to maintain intraocular pressure (IOP). This fluid enters the anterior chamber through the pupil and subsequently leaves the anterior segment of the eye through drainage structures at the iridocorneal angle (see inset, left). When the eye is healthy (left panel), production of aqueous humor and outflow of aqueous humor are in a proper balance that maintains IOP in what is generally considered to be a normal range (≤ 21 mmHg). In primary open angle glaucoma (right panel), outflow of aqueous humor through the trabecular meshwork is diminished or obstructed in some way. The resulting build- up of aqueous humor in the anterior eye results in an increase in IOP because the correct balance of aqueous production and outflow has been disturbed.
Figure from Hollands et al. (2013) and used in accordance with Copyright Clearance Center’s RightsLink service.
Closed angle glaucoma (CAG) arises from the iris pressing against the cornea, thereby closing the angle and preventing proper aqueous outflow (Nongpiur et al., 2011). Patients with CAG typically exhibit abnormally high IOP, which can create ocular pain (Salmon, 1999).
Conversely, open angle glaucoma (OAG) is not painful and patients exhibit no angle closure.
OAG involves the degradation and obstruction of the trabecular meshwork, leading to a decrease in outflow facility at the angle (Quigley, 1993). Decreased aqueous outflow, in turn, results in an
7
increase in IOP (Figure 1.3). Both CAG and OAG are associated with increases in IOP, thus measurement of IOP by tonometry is often a component of eye exams. Although ocular hypertension is associated with glaucoma, some patients exhibit disease progression despite never developing an elevated IOP, a condition deemed normotensive glaucoma (Heijl et al., 2002; Iester et al., 2012). Although these patients exhibit what is considered a normal IOP in the clinic, this does not mean that these patients progress solely due to IOP-independent
mechanisms. In support of this idea, it has been determined that patients with normotensive glaucoma often benefit from IOP-lowering regimens (Heijl et al., 2002). It is therefore important to understand that glaucoma is not necessarily a disease related exclusively to IOP elevations, but rather to IOP sensitivity (Crish and Calkins, 2011).
RGCs and their susceptibility to glaucomatous neurodegeneration
All glaucomatous pathology ultimately converges upon the dysfunction and degeneration of RGCs. In humans, there are approximately 1.5 million RGCs, which possess the unique task of gathering information from other cells in the retina and conveying that information along their lengthy axons to distal brain regions (Campbell et al., 2013). To examine the implications of RGC death, it is critical to first understand the important role these neurons play within the context of the entire visual projection system.
Within the retina, visual information is first encoded when photons of light activate rod and cone photoreceptor cells in the outer retina (Figure 1.4). Photoreceptors release glutamate to activate bipolar cells, which in turn release glutamate to activate RGCs. Feed-forward signaling across the retina is most simply achieved at the two excitatory synapses between these three
8
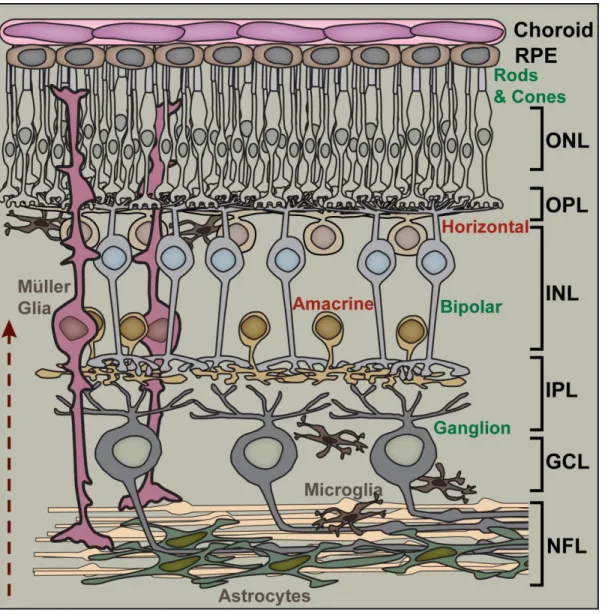
Figure 1.4. Retinal circuitry and layers. Traveling in the direction of the arrow (bottom, left), light reaches the rod and cone photoreceptors (with cell bodies in the outer nuclear layer, ONL) and is transduced into a neural signal. Transmission of visual information proceeds from photoreceptors to bipolar cells (with cell bodies in the inner nuclear layer, INL), and then from bipolar cells to ganglion cells (with cell bodies in the ganglion cell layer, GCL). This information is passed from one cell to another at excitatory synapses found in the outer plexiform layer (OPL) and inner plexiform layer (INL). Activity at these synapses are modulated by horizontal cells (at the OPL) and amacrine cells (at the IPL). As the ganglion cells course through the nerve fiber layer (NFL) toward the optic disc, they interact directly with astrocytes. In addition to astrocytes, other glial cells, such as microglia and Müller glia influence proper function within the retina as well as the overall health of the neuronal cells.
Figure from Calkins (2012) and used in accordance with Copyright Clearance Center’s RightsLink service.
9
classes of neurons. Feed-forward retinal signaling is regulated by two sets of interneurons:
horizontal cells in the outer retina and amacrine cells in the inner retina. Horizontal cells are GABAergic and modulate activity at synapses between photoreceptors and bipolar cells, while amacrine cells are mostly GABAergic and glycinergic and modulate synaptic activity between bipolar cells and RGCs (Wassle and Boycott, 1991; Oesch et al., 2011). Health and activity of all retinal cell types are additionally influenced by three retinal glial cells: astrocytes, microglia, and Müller glia.
Visual information that has been processed through the feed-forward pathway is then carried away from the retina along RGC axons. These axons exit the retina at the optic disc, at which point they bundle together to form the optic nerve. RGC axons terminate at several targets in the brain, particularly the lateral geniculate nucleus (LGN) in the thalamus and the superior colliculus (SC) in the midbrain. In primates, RGCs project primarily to the LGN, while only
~10% of RGCs project to the superior colliculus (Bunt et al., 1975; Perry et al., 1984; Liu et al., 2011). In contrast, rodent RGCs project primarily to the superior colliculus, with only ~30% of RGCs projecting to the LGN (Dreher et al., 1985). Unlike in primates, where half of RGCs cross to contralateral structures and the other half project ipsilaterally, the large majority of rodent RGCs project to contralateral brain structures, with only 3-10% of RGCs projecting ipsilaterally (Drager and Olsen, 1980; Jeffery, 1984; Kondo et al., 1993; Liu et al., 2011).
In glaucoma, it is known that dysfunction and death of RGCs results in progressive blindness, but less is known about why RGCs are the cells primarily affected in glaucoma. It has long been posited that pressure contributes to biomechanical stress on RGC axons as they leave the retina at the optic nerve head, and that this may contribute to damage (Burgoyne et al., 2005);
however, it is likely that components intrinsic to RGCs make them particularly susceptible to
10
degeneration as well. More recent hypotheses suggest that a confluence of factors may determine the primary degeneration of RGCs in glaucoma (Calkins, 2012). These factors may include: (1) the relative thinness of RGC axons, (2) the presence of an energetically-demanding
unmyelinated portion of the RGC axon, (3) a diminishment of transport of mitochondria along axons, and (4) a pressure-related reduction in ATP along the optic nerve.
Degenerative progression in glaucoma
Although the etiology of glaucoma is complex and not fully explained by current
research, much more is known about the pathophysiological changes that occur in glaucoma due to disease modeling in animals. It is understood that during the course of glaucoma, RGCs exhibit signs of dysfunction preceding obvious structural degeneration and loss of neurons in the retina (Crish et al., 2010). It has also been determined that diminished visual function occurs prior to wide-scale loss of RGC somas in the retina (Harwerth et al., 2002). Developing knowledge of disease progression will therefore allow for targeted therapeutic interventions before dramatic vision loss occurs.
Thus far, deficits in anterograde axonal transport along the optic nerve are one of the earliest detectable signs of RGC dysfunction in animal models. Axonal transport is a method by which neurons are able to move cargo—organelles, lipids, synaptic vesicles, and proteins—from the cell body out toward synaptic terminals (anterograde transport) or from the terminals toward the cell body (retrograde transport). Cargo is transported along cytoskeletal tracks via motor proteins known as kinesin and dynein, which move in an anterograde and retrograde direction, respectively (Roy et al., 2005). Healthy axonal transport is critical to neurons because, among other functions, they depend on it to redistribute mitochondria to energetically demanding
11
regions of the neuron (Hollenbeck and Saxton, 2005) and to shuttle neurotrophic factors, which can influence cell survival (DiStefano et al., 1992).
The temporal progression of axonal transport deficits has perhaps been characterized best in studies using the DBA/2 mouse. In the DBA/2 mouse, which exhibits progressive glaucoma as animals age, significant RGC soma death begins at approximately 18 months, though some studies suggest it may begin earlier (Reichstein et al., 2007; Buckingham et al., 2008). However, when evaluating deficits in anterograde axonal transport, the earliest deficits are observed in 3- month-old DBA/2 mice (Crish et al., 2010). This indicates that one of the earliest known deficits exist far in advance of the final stage of RGC degeneration—caspase-dependent apoptotic cell death (Garcia-Valenzuela et al., 1995; Kerrigan et al., 1997). In fact, anterograde transport is almost completely lost by 11 to 12 months in DBA/2 mice, again prior to significant RGC death in the retina (Buckingham et al., 2008; Crish et al., 2010). Retrograde transport is affected later than anterograde transport, as studies in DBA/2 mice indicate deficits are first observed at 6-8 months (Buckingham et al., 2008).
In addition to disruptions in axonal transport, degeneration of axons in the optic nerve occurs prior to RGC soma loss in the retina as well. Axon density within the optic nerve was reduced starting at 13 months in the DBA/2 mouse, and this reduction in density is accompanied by disrupted axon fascicles and enlarged astrocytic processes (Buckingham et al., 2008). In a meta-analysis of studies using RGC soma counts in the retina and RGC axon counts in the optic nerve, it was apparent that reduction of axons was 2-3 times greater than reductions in RGC soma counts, even across different cumulative exposures to IOP (Calkins, 2012).
Although RGC death in the retina stands as the final stage of glaucomatous progression, disease-relevant alterations are not simply confined to the RGC axon alone. In 12-month-old
12
DBA/2 mice with observed optic nerve pathology, certain RGCs exhibited a reduction in dendritic branching as well as abnormal dendritic arbors when compared to controls (Jakobs et al., 2005). Likewise, one study found less PSD-95 present at synaptic sites in the inner plexiform layer of the retina in 10.5-month-old DBA/2 mice, likely indicating of dendritic retraction or pruning (Stevens et al., 2007). This assertion was strengthened by the presence of a concomitant upregulation of C1q protein, which may help target dendrites for pruning by microglia (Stevens et al., 2007). It is not yet clear how early dendritic changes occur, but these results indicate that it may happen alongside the development of pathology in the optic nerve.
Although dendritic pruning and synaptic elimination may occur at intermediate stages of disease progression, it appears that RGC axon terminals persist at target sites in the brain. In the DBA/2 mouse, immunolabeled presynaptic terminals from RGC axons persist within the SC for up to 18-22 months (Crish et al., 2010). This matches well with data suggesting that retrograde axonal transport, which exhibits deficits later than anterograde transport, persists up to 18 months in DBA/2 mice (Buckingham et al., 2008). This knowledge of structural persistence at distal brain sites is encouraging, especially when paired with the idea that therapeutics could focus on rescuing dysfunctional neurons before cellular structures degenerate.
While the DBA/2 mouse model of glaucoma has been highly informative in establishing a progression of degeneration, this model is not without its limitations. The DBA/2 has two mutations that result in a pigmentary form of glaucoma. These mutations in the Gpnmb and Tyrp1 genes cause iris pigment dispersion and iris stromal atrophy, respectively (Anderson et al., 2002). The dispersion and atrophy entail sloughing off of iris pigment and cell debris into the ocular drainage structures, which obstructs aqueous outflow and gradually elevates IOP. In these mice, IOP elevation and disease progression are variable—the majority of mice have elevated
13
IOP by 5 to 6 months of age, but some present with elevated pressure by 3 months, and still others never show any pressure elevation (Inman et al., 2006). In addition, the level of IOP elevation also varies in these mice, ranging anywhere from 2.5 to 8 mmHg depending on the age and sex of the mouse (Inman et al., 2006). Finally, variables such as colony of origin (DBA/2J versus DBA/2NCrl versus DBA/2NTac), diet, along with other environmental factors all influence the natural history of disease in DBA/2 mice (McKinnon et al., 2009).
In consideration of the limitations of the DBA/2, we and other investigators have
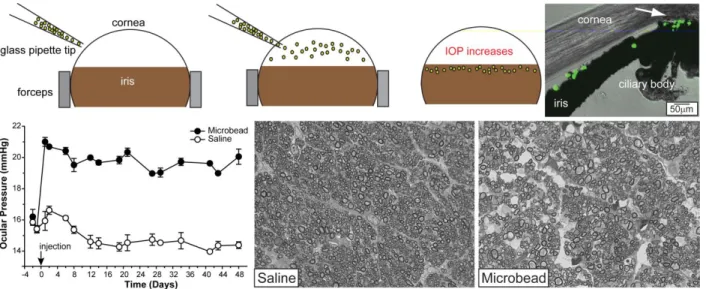
developed methods to induce ocular hypertension (elevated IOP) acutely. These models include laser photocoagulation of episcleral veins (WoldeMussie et al., 2001), episcleral vein occlusion (Garcia-Valenzuela et al., 1995), sclerosis of episcleral veins by injection of hypertonic saline (Morrison et al., 1997), and microbead occlusion of aqueous humor drainage (Sappington et al., 2010). In these models, IOP is typically elevated in one eye, leaving the other to serve as an internal control. We use the microbead model as it provides a reliable and robust (25 to 35%) increase in IOP, it is reproducible across cohorts, and IOP elevation can be sustained for multiple weeks in mice. The microbead model is also effective in inducing optic nerve pathology, as axon counts are reduced by approximately 20% following 4 weeks of elevated IOP. This model does not exhibit issues such as ocular ischemia and neovascularization, both of which can confound interpretation of data (Goldblum and Mittag, 2002; Pang and Clark, 2007). Ultimately, what makes this model so useful is that it produces IOP elevation that is more in line with pressure elevation seen in human disease (~38% elevation for moderate cases), whereas other models use 50-100% elevations that may not be a proper physiological representation of elevations seen in untreated human glaucoma (Sommer et al., 1991; Sappington et al., 2010).
14
Neurodegeneration in glaucoma
Within the CNS, neurodegenerative diseases such as Alzheimer’s disease (AD),
amyotrophic lateral sclerosis (ALS), Parkinson’s disease (PD), and Huntington’s disease (HD) exhibit diverse etiologies and a wide range of clinical presentations. Nevertheless, the underlying neurodegenerative cellular mechanisms often exhibit remarkable similarities (Crish and Calkins, 2011; London et al., 2013). In this section, we will first cover features that are common to most neurodegenerative diseases, such as dysregulation of Ca2+, excitotoxicity, mitochondrial
dysfunction, and disruption of axonal transport. Following that, we will examine how glaucoma shares common characteristics and cellular mechanisms with other neurodegenerative diseases.
Ca2+ homeostasis is dysregulated in neurodegeneration
Ca2+ is an important intracellular messenger that regulates a variety of important neuronal functions like neurotransmitter release, neuronal responses to the binding of neurotransmitter, potentiation and depression of synaptic activity, and gene transcription (Berridge, 1998; Berridge et al., 2000; Gleichmann and Mattson, 2011). While essential to many cellular processes, this cation functions under tight regulation by the cell; situations in which Ca2+ exceeds its typical spatial and temporal limits can result in irreversible damage. Across a number of
neurodegenerative diseases, dysregulation of Ca2+ homeostasis is a common feature that underlies pathogenesis (Marambaud et al., 2009).
Two parts of the machinery that regulates the levels of intracellular Ca2+ are membranous ionotropic glutamate receptors known as NMDA and Ca2+-permeable AMPA receptors (Figure 1.5). When these receptors are activated in an excessive manner, Ca2+ entry into the cell becomes
15
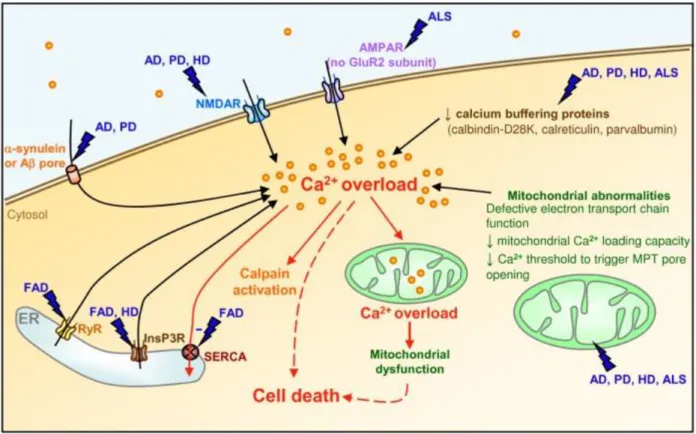
Figure 1.5. Dysregulation of Ca2+ in neurodegenerative disease. Many pathways converge upon Ca2+ overload as a damaging agent in neurodegenerative disease. Disease-relevant stressors such as excitotoxicity and decreased expression of Ca2+ buffering proteins contribute to an overload of Ca2+ within neurons. This excessive Ca2+ overloads the buffering potential of mitochondria and also activates damaging Ca2+-activated proteases known as calpains. As mitochondria
dysfunction, they are prone to release cytochrome c, inducing mitochondrially-mediated apoptosis of the affected neuron.
Figure from Marambaud et al. (2009) and used in accordance with the Creative Commons Attribution License 4.0 (http://www.creativecommons.org/licenses/by/4.0/).
neurotoxic, a phenomenon known as excitotoxicity (Arundine and Tymianski, 2003). The propensity for certain neurons to experience excitotoxicity can be influenced by the type of receptors those cells express. For instance, not all AMPA receptors can flux Ca2+, and this is dictated by the GluR2 subunit; if a GluR2 subunit is present in the AMPA receptor, it cannot flux Ca2+. This is particularly relevant in ALS, as AMPA receptors in the affected spinal motoneurons appear to all lack GluR2 subunits, which may contribute to Ca2+-mediated excitotoxicity
16
(Carriedo et al., 1996; Williams et al., 1997; Takuma et al., 1999). Additionally, protein aggregates that form in some neurodegenerative disease may influence the activity of NMDA receptors, pushing them toward a more excitotoxic activity profile (Sun et al., 2001; Shankar et al., 2007). For example, in AD aggregates of Aβ may directly associate with NMDA receptor subunits, causing an increase in channel activity and a resulting increase in Ca2+ flux into the cell (Shankar et al., 2007).
Multiple stressors can cause dysregulation of Ca2+ in neurodegenerative diseases. In AD, altered cleavage of amyloid precursor protein generates Aβ, which is toxic to neurons (Mattson, 2004). Formation of Aβ oligomers is associated with the production of reactive oxygen species (ROS), which results in membrane-associated oxidative stress (MAOS). MAOS involves lipid peroxidation, which disrupts the function of both Na+/K+- and Ca2+-ATPases as well as
transporters of glutamate and glucose (Mattson, 1998). This results in depolarization of the membrane and influx of Ca2+ through NMDA receptors and voltage-dependent Ca2+ channels (Mattson, 2007). Aside from AD, there is evidence for MAOS occurring in degenerating neurons in PD (Yoritaka et al., 1996) and ALS (Smith et al., 1998) as well.
Due to the dynamic nature of Ca2+ entry and activity within cells, it is important that neurons are able to buffer any excess intracellular Ca2+. Specific proteins called Ca2+ buffering proteins are critical for this buffering process. Degenerative pathology has been associated with changes related to various Ca2+ buffering proteins, including calbindin-D28K, calmodulin, and parvalbumin (Figure 1.5). A common feature of motoneurons affected earliest in ALS is that they do not express calbindin-D28K or parvalbumin, which may render them susceptible to aberrant Ca2+ (Alexianu et al., 1994). Additionally, calbindin-D28K and calmodulin protein and mRNA levels are known to be reduced in several cortical regions in AD, showing that the ability
17
to buffer Ca2+ declines in areas susceptible to degeneration (McLachlan et al., 1987; Ichimiya et al., 1988).
In addition to being buffered by proteins, intracellular Ca2+ concentrations can be reduced via uptake of Ca2+ by mitochondria. However, when levels of Ca2+ within mitochondria become too high, mitochondrial dysfunction occurs (Figure 1.5), which may involve opening of the mitochondrial permeability transition (MPT) pore (Hunter and Haworth, 1979; Brustovetsky et al., 2002). Opening of the MPT pore allows Ca2+ to leave mitochondria again, which causes intracellular Ca2+ to elevate once again. Prolonged opening of MPT can result in other
deleterious effects: disruption of the electron transport chain, reduced ATP production, increased production of reactive oxygen species, and release of cytochrome c from mitochondria (Buki et al., 2000; Luetjens et al., 2000; Stavrovskaya and Kristal, 2005). Cytochrome c release can cause activation of caspase-dependent cellular apoptosis, thus opening of the MPT can have dire consequences for neurons (Green and Reed, 1998). Studies in HD determined that mutant huntingtin protein could directly induce MPT pore opening due to a lowered tolerance of the Ca2+ load within mitochondria (Panov et al., 2002; Panov et al., 2003; Choo et al., 2004). This type of interaction also seems to occur in AD, in which Aβ accumulation in mitochondria may also aid in mediating Ca2+-induced MPT opening (Reddy and Beal, 2008).
As intracellular Ca2+ increases to non-homeostatic concentrations within neurons, degenerative cascades are activated. Ca2+ can directly activate proteases known as calpains, which cleave cytoskeletal proteins, components of synapses, receptors, and enzymes involved in metabolism (Chan and Mattson, 1999; Lu et al., 2000; Vosler et al., 2008). Calpain activation due to dysregulated Ca2+ can therefore promote mechanisms that cause disruptive changes to neurons. Calpain-mediated cleavage of Bax is a feature of PD, and this cleavage promotes
18
release of cytochrome c from mitochondria, which pushes the neurons toward death (Choi et al., 2001). Calpains can also activate abnormal phosphorylation activity of several varieties of kinases, which in turn phosphorylate neurofilaments and tau protein, ultimately resulting in dysfunctional axon transport (Shea et al., 2004; Goni-Oliver et al., 2007; Morfini et al., 2009b).
Axonal transport disruption in neurodegenerative diseases
Disruption of neuronal function in neurodegenerative disease often includes development of deficits in axonal transport. The axon is therefore a challenging feature for neurons, as
important cellular components necessary for axonal function must be transported from their location of synthesis in the cell body (Morfini et al., 2009b). In neurodegenerative diseases, there is evidence for abnormal phosphorylation of motor proteins, which leads to dysfunction of axonal transport. In HD, polyglutamine expansion of the huntintin protein (polyQ-Htt) is associated with neurodegeneration in the striatum and cerebral cortex (Sieradzan and Mann, 2001). PolyQ-Htt was determined to causes deficits in axonal transport by activating a neuron- specific kinase called JNK3, which phosphorylates kinesin protein (Morfini et al., 2009a).
Similarly, kinase activity in AD is altered (Pigino et al., 2001; Wang et al., 2007), and one of these kinases—casein kinase 2 is activated and disrupts axonal transport via increased
phosphorylation of kinesin-1 light chain (Pigino et al., 2009). This deregulated phosphorylation results in the uncoupling of kinesin-1 from its cargo, and thus disrupting transport along the axon.
Phosphorylation of motor proteins is not the only way that axonal transport can be disrupted in neurodegeneration. Excessive phosphorylation of neurofilaments can also be detrimental to axonal transport. Neurofilaments are cytoskeletal elements that are longitudinally
19
oriented in the axon.Neurofilaments were first named according to their molecular mass—light (NF-L), medium (NF-M), and heavy (NF-H)—however, a fourth subunit named α-internexin has since been discovered (Julien and Mushynski, 1998; Yuan et al., 2006). Of these four subunits, both NF-M and NF-H have long C-terminal regions commonly known as their side arms, which can be extensively phosphorylated (Julien and Mushynski, 1998). Increasing side arm
phosphorylation decreases the affinity of NFs for kinesin (Yabe et al., 1999), and increases their affinity for dynein (Motil et al., 2006); therefore, these NFs are not anterogradely transported along the axon, where they are needed. Instead, increased affinity for dynein causes them to be transported retrogradely and accumulate at the cell soma. Additionally, the phosphorylated neurofilaments (pNFs) tend to bundle together, which considerably slows down anterograde transport by kinesin (Shea and Chan, 2008). Elevated or mislocated pNF and hyper-pNF have been reported in many neurodegenerative diseases, including ALS (Sobue et al., 1990), MS (Petzold et al., 2008), AD (Stokin et al., 2005), and glaucoma (Soto et al., 2008).
Degenerative cellular mechanisms in glaucoma
Although direct evidence for excitotoxicity in models of glaucoma is relatively scarce (Carter-Dawson et al., 2002; Levkovitch-Verbin et al., 2002; Casson, 2006), NMDA antagonists MK-801 (Chaudhary et al., 1998) and memantine (Hare et al., 2004a; Hare et al., 2004b) both exhibited a neuroprotective effect in models of glaucoma. Of these two drugs, memantine was tested for use with human patients in a set of clinical trials, which were deemed unsuccessful (Osborne, 2009). It has been hypothesized that glaucoma may be mediated in part by insufficient blood supply, potentially due to increased IOP or other risk factors that could reduce ocular blood flow (Flammer et al., 2002). Based on this hypothesis, RGC death may in part be due to
20
excitotoxic damage downstream of ischemia-reperfusion injury (Osborne et al., 1999; Flammer et al., 2002). One study used a rat model of retinal ischemia/refusion induced by non-
physiologically high IOP (120 mmHg for 45 minutes) to demonstrate that intraocular administration of Coenzyme Q10 (CoQ10) afforded neuroprotection to RGCs by preventing mitochondrial permeability transition pore formation (Nucci et al., 2007a). While these mechanisms may be protective, it is difficult to assess whether or not these mechanisms are relevant to human glaucoma as it presents in the clinic, especially given the use of non-
physiological IOP elevations. Presently, it is poorly understood how much of a role excitotoxic Ca2+ entry plays a role in glaucomatous degeneration.
Ca2+ binding proteins may be relevant in some initial responses to elevated pressure, as RGC-associated expression of Ca2+ buffering proteins parvalbumin and calbindin-D28K were transiently upregulated following pressure elevation in rats (Wang et al., 2005). The authors indicated that this upregulation was prior to loss of RGCs in the retina—it is possible that RGCs may use these buffering proteins to address the presence of aberrant Ca2+. Excessive intracellular Ca2+ can activate calpains, and this activation has been observed in a rat model of glaucoma (Huang et al., 2010). In other neurodegenerative diseases (Vosler et al., 2008), calpains activate cyclin dependent kinase 5 (Lee et al., 2000), glycogen synthase kinase 3(Goni-Oliver et al., 2007), and c-Jun N-terminal kinases/JNK (Tan et al., 2006; Morfini et al., 2009b). Overactive phosphorylation of neurofilaments and the microtubule associated protein tau by kinases results in axonal transport deficits (Shea et al., 2004; Morfini et al., 2009b), which are a hallmark of glaucoma (Anderson and Hendrickson, 1974; Crish et al., 2010; Howell et al., 2012). In DBA/2 mice, somatic and somatodendritic accumulations of phosphorylated neurofilaments were associated with RGCs exhibiting failure of axonal transport (Soto et al., 2008). The kinases
21
associated with this excessive phosphorylation activity can affect motor protein activity as well:
glycogen synthase kinase 3 phosphorylates kinesin, resulting in its dissociation from cargo, and JNK phosphorylates kinesin, inhibiting its ability to bind microtubules (Morfini et al., 2009b).
Early changes in kinase activity in glaucoma may therefore influence onset and progression of axonal dysfunction (Crish and Calkins, 2011).
Dysregulated Ca2+ is also known to influence the development of oxidative stress through mechanisms such as increased neuronal metabolic rate and activation of ROS-producing
enzymes (Abramov et al., 2007; Zundorf et al., 2009; Crish and Calkins, 2011). DBA/2 mice exhibit lipid peroxidation and upregulated oxidative stress-related proteins during pathogenesis, so a group of studies was focused on addressing the relative contribution of oxidative stress to glaucoma pathogenesis (Inman et al., 2013). In these studies, dietary supplementation with antioxidant α-lipoic acid reduced measures of oxidative stress, increased expression of antioxidant proteins, and increased protection of RGCs (Inman et al., 2013). This protection afforded by α-lipoic acid supplementation therefore indicates that oxidative stress contributes to the degenerative outcome of RGCs during the course of glaucoma.
Protective responses of the retina and RGCs
Although neurodegenerative cellular signaling drives neurons toward cell death, there is evidence for intrinsic protective mechanisms that slow this progression. In a study of both experimental glaucoma and optic nerve transection, upregulation of both proapoptotic and prosurvival genes occurred simultaneously in the retina (Levkovitch-Verbin et al., 2006). In this study, proapoptotic gene Gadd45a was significantly upregulated 1 week after IOP elevation and remained upregulated for 2 months, whereas upregulation of prosurvival gene Iap-1 returned to
22
baseline prior to Gadd45a. RGCs exposed to elevated pressure in vitro exhibited upregulation of apoptotic genes, but these cells likewise showed a protective response through upregulation of the prosurvival Bcl-2 gene (Sappington et al., 2006). These studies indicate that both RGCs and the retina as a whole have protective responses to counter the stresses of the degenerative milieu of glaucoma.
As in other neurodegenerative conditions, oxidative stress is a detrimental feature of glaucoma (Lin and Beal, 2006; Tezel, 2006). The retina combats oxidative stress associated with IOP elevation by reducing the formation of damaging reactive oxygen species (ROS). In the DBA/2 mouse, ceruloplasmin protein is upregulated in order to reduce iron-mediated
mechanisms of ROS formation (Steele et al., 2006). This increase was observed in 5-month-old animals, suggesting that this protein is involved in an early response to glaucomatous stressors.
In addition to ceruloplasmin, increases in other antioxidant proteins are elevated in the retina or aqueous humor in monkeys and humans with glaucoma (Farkas et al., 2004; Ferreira et al., 2004;
Ghanem et al., 2010).
Many of these studies examining protective responses examine the retina as a whole tissue; however, this makes it difficult to determine if RGCs have intrinsic mechanisms for responding to glaucomatous stress and damage. Driving synaptic activity, even in injured or degenerating neurons, has been demonstrated to help neurons survive (Corredor and Goldberg, 2009). For example, after optic nerve axotomy in rats, stimulating retinal neurons using a trans- corneal electrode increased RGC survival in vivo (Morimoto et al., 2005). It is important to consider, then, if RGCs make any attempt to bolster their synaptic connections in an effort to survive degenerative stressors. Evidence from manganese-enhanced MRI of DBA/2 mice indicated that very little difference was seen in cationic activity in the DBA inner retina when
23
comparing between ages associated with axonopathy and those considered pre-axonopathy (Calkins et al., 2008). This may support the idea that despite degenerative progression, RGCs make an effort to maintain their synaptic activity in the inner retina as part of an effort to survive.
Ca2+-mediated plasticity and a role for TRPV1 in neuronal survival
Role of Ca2+ in homeostatic synaptic plasticity
In cases of injury and disease, CNS neurons undergo plasticity that involves rewiring of neural circuitry (Moore et al., 2000; Kaas et al., 2008). Reductions in synaptic connectivity as well as dendritic retraction and abnormalities are common features of neurodegenerative diseases and injury (Posmantur et al., 1996; Lin and Koleske, 2010; Furutani and Kibayashi, 2012).
However, it has been hypothesized that neurons may actually take an active role in maintaining synaptic activity following injury in order to recover and preserve function (Lee, 2012). In models of neuronal insult and injury (Liu et al., 2006; Spaethling et al., 2008), Ca2+-permeable AMPA receptors were upregulated in neurons and their synaptic sites. Increased localization of Ca2+-permeable AMPA receptors to postsynaptic specializations of neurons is often involved in potentiating activity at synapses (Malenka and Bear, 2004). It is not yet understood whether this increase in receptors contributes further to Ca2+-related pathology or instead helps bolster neuronal activity and connectivity (Liu et al., 2006; Lee, 2012). It is known that many neurons exhibit homeostatic synaptic plasticity, meaning they are able to monitor their activity and in turn modify the strength of a synapse by trafficking glutamatergic receptors to or from that synapse (Ibata et al., 2008; Turrigiano, 2008; Lee, 2012). Altogether, these homeostatic
24
mechanisms would be useful when healthy neuronal function is compromised, especially given that maintaining activity is critical for neuronal survival (Corredor and Goldberg, 2009).
In terms of understanding neuronal responses to injury, cultures of mechanically lesioned leech nerve cord are used to better understand regenerative neurite outgrowth following CNS injury. One group demonstrated that endocannabinoids, a group of neuromodulatory lipids, were involved in neurite outgrowth following damage; however, they could not identify leech
orthologs for the cannabinoid receptors CB1 and CB2 (Meriaux et al., 2011). Endocannabinoids, however, are also known to activate the TRPV1 receptor (Ross, 2003). TRPV1 is a polymodal cation channel with a high preference for fluxing Ca2+, and it can be activated by heat, pH, and vanilloid compounds like capsaicin (Ho et al., 2012). Meriaux et al. (2011) confirmed that leeches possessed orthologs to the TRPV family of proteins, and then tested how neurite outgrowth was modulated by two agonists (arvanil and capsaicin) and one antagonist (capsazepine) of mammalian TRPV1. Both agonists accelerated neurite outgrowth and the antagonist halted all outgrowth. Intriguingly, this study showed that, subsequent to CNS injury in the leech, a TRPV1-like protein modulates neurite outgrowth.
Potential for TRPV1 to influence RGC survival in vivo
Immunolabeling for TRPV1 in primary cultures of RGCs reveals that this protein is expressed throughout the RGC, including all neurites (Sappington et al., 2009). In the DBA/2 mouse, TRPV1 exhibits an interesting expression pattern: at older ages and higher IOP, TRPV1 expression is especially localized to the inner plexiform layer, the layer of the retina into which RGC dendrites project (Sappington et al., 2009). This is interesting because Ca2+-permeable AMPA receptors exhibit localization to synaptic sites following neuronal insult and injury (Liu
25
et al., 2006). TRPV1 is also permeable to Ca2+, so if it localizes to RGC dendrites, it could exert beneficial or deterimental effects depending on its function. Previous studies in vitro indicated that Ca2+ influx into cultured RGCs exposed to pressure is partly mediated by TRPV1
(Sappington et al., 2009). In vitro, this is detrimental and causes apoptosis, especially given the acute nature of the stressor used. In vivo, this Ca2+ entry may be important, especially if TRPV1 is upregulated in RGC dendrites, where it could help modulate homeostatic synaptic interactions in response to stress (Lee, 2012). If this actually occurs, it would not be the first example of TRPV1 affording RGCs protection from damage, as has previously been demonstrated in models of NMDA-induced neuronal injury and ischemia-reperfusion injury (Nucci et al., 2007b;
Sakamoto et al., 2014).
TRPV1 modulates CNS function
The TRP channel family
The transient receptor potential (TRP) family is a diverse group of channels that regulates cation entry and contributes to a vast variety of physiological conditions. In mammals, there are 28 TRPs, divided into 6 subfamilies based on homology: canonical (TRPC1-7), vanilloid (TRPV1-6), melastatin (TRPM1-8), ankyrin (TRPA1), polycystin (TRPP1-3) and mucolipin (TRPML1-3). All six subfamilies share a common structure of six transmembrane domains with a hydrophobic pore located between the fifth and sixth domains. Situated in the plasma
membrane, TRP channels serve as polymodal integrators due to their activation by a variety of stimuli including temperature, osmolality, mechanical force, chemoattractants and ischemia.
26
One subfamily of the TRP channels is the vanilloid family, named for their
responsiveness to various ligands that possess vanillyl moieties. Within the TRPV family, TRPV1 is the best studied particularly due to its role in nociception. Although first identified as the receptor for capsaicin, TRPV1 can also be activated endogenously by voltage, noxious heat (>42°C), pH and lipoxygenase products. Endocannabinoids, including anandamide and N- arachidonoyl dopamine, can activate both TRPV1 and cannabinoid receptors, indicating the importance of cross-talk mechanisms. TRPV1 nonselectively gates cations; however, channel activation results in a 10-fold higher preference for Ca2+ (Chung et al., 2008). Functional TRPV1 preferentially forms a homotetramer but can also oligermerize with other TRP family subunits including TRPV3 and TRPA1 (Smith et al., 2002; Moiseenkova-Bell et al., 2008; Staruschenko et al., 2010).
The structure of TRPV1
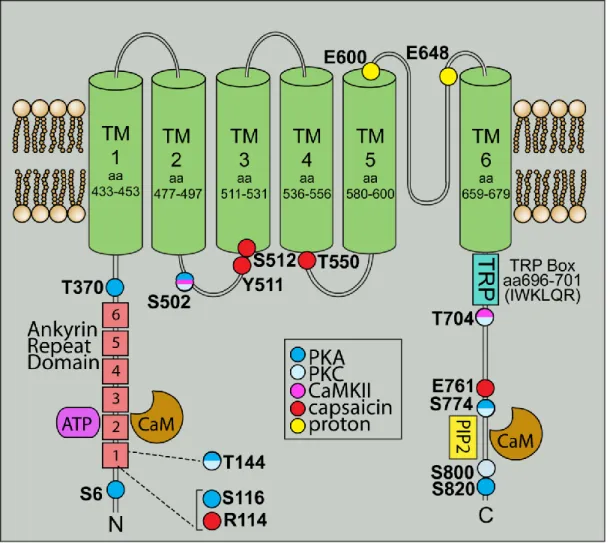
Structural analysis of TRPV1 indicates a compact transmembrane region and a large basket-like intracellular domain (Moiseenkova-Bell et al., 2008). The intracellular N-terminal tail contains numerous phosphorylation sites and ankyrin repeats that serve as binding sites for calmodulin and ATP (Lishko et al., 2007). The intracellular C-terminal tail contains a TRP domain as well as binding sites for both calmodulin and PIP2, an endogenous TRPV1 inhibitor (Numazaki et al., 2003; Garcia-Sanz et al., 2004; Ufret-Vincenty et al., 2011). Agonist activation is also mediated intracellularly, as lipophilic capsaicin readily crosses the membrane to bind several sites on TRPV1 (Figure 1.6). The cation selectivity filter for TRPV1 is believed to lie in the pore domain formed by transmembrane regions 5 and 6. This selectivity is dynamic, not static, and can vary depending on stimulus duration or agonist concentration. Activation can alter
27
Figure 1.6. TRPV1 is a member of the transient receptor potential family. TRPV1 consists of six transmembrane domains with a pore region between the fifth and sixth domain, and long
intracellular N- and C- terminal tails. Within the N-terminal tail, six ankyrin repeat domains allow binding of calmodulin and ATP to modulate TRPV1 activation. The C-terminus contains a TRP domain as well as binding sites for PIP2 and calmodulin. Throughout TRPV1 are multiple phosphorylation sites for PKA, PKC and CaMKII, in addition to putative sites for capsaicin and proton binding.
Figure from Ho et al. (2012) and used in accordance with the Creative Commons Attribution Noncommercial License.
28
the Ca2+ permeability and pore diameter of TRPV1 to allow influx of larger cations (Chung et al., 2008). The method of channel stimulation can also have a significant effect on Ca2+
permeability—activation by protons produces a smaller Ca2+ current than activation by capsaicin (Samways et al., 2008).
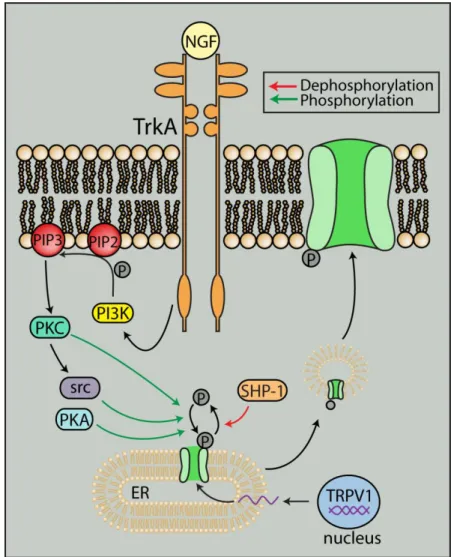
Figure 1.7. Interaction with other signaling pathways can traffic TRPV1 to the plasma membrane. TrkA stimulation by NGF can cause src-mediated phosphorylation of TRPV1 to traffic TRPV1 from the endoplasmic reticulum to the plasma membrane. Translocation of TRPV1 to the membrane can also be increased through PKA- and PKC-mediated
phosphorylation. Dephosphorylation by SHP-1, however, can inhibit translocation.
Figure from Ho et al. (2012) and used in accordance with the Creative Commons Attribution Noncommercial License.
29 Regulation of TRPV1
In addition to membrane expression, TRPV1 is also found in the endoplasmic reticulum where it mobilizes Ca2+ from intracellular stores (Liu et al., 2003; Marshall et al., 2003).
Activation of signaling pathways can translocate TRPV1 from intracellular compartments to the membrane usually via phosphorylation. For example, PKC activation can lead to membrane insertion of TRPV1 via SNARE-mediated exocytosis (Morenilla-Palao et al., 2004).
Furthermore, nerve growth factor activation of the tyrosine kinase src can phosphorylate TRPV1 to increase membrane localization (Figure 1.7).
Phosphorylation is also important in modulating the channel, allowing for rapid responses to external stimuli or environmental changes. Generally, phosphorylation sensitizes while
dephosphorylation desensitizes the channel. PKC phosphorylation reverses desensitization of TRPV1 from prolonged capsaicin treatment and increases the sensitivity of TRPV1 to agonists (Mandadi et al., 2006; Varga et al., 2006). PKA can also reduce desensitization by direct phosphorylation of TRPV1 (Bhave et al., 2002). In addition, PKC or PKA activation through stimulation of multiple receptors including the protease-activated receptor PAR2, bradykinin B1 and B2, purinergic P2 receptors, chemokine receptor CCL3, and endothelin receptors have all been shown to increase sensitivity of the channel (Figure 1.8). On the other hand,
dephosphorylation by calcineurin/PP2B and increases in intracellular Ca2+ can desensitize the channel (Koplas et al., 1997; Mohapatra and Nau, 2005).
TRPV1 in the CNS
Although it is expressed throughout the CNS, TRPV1 is most robust in the sensory neurons of the dorsal root ganglion (Sanchez et al., 2001). Using a combination of knockout
30
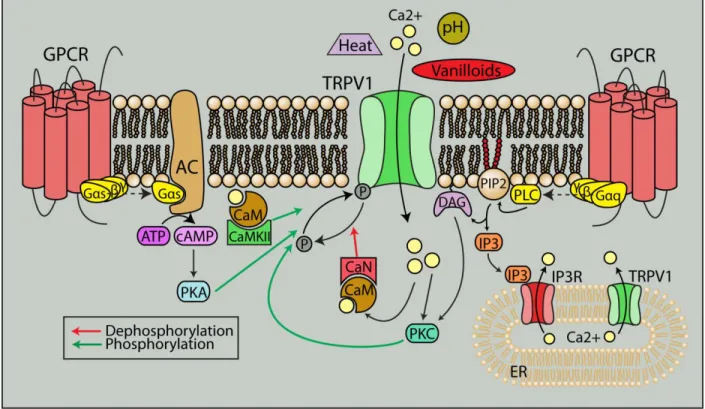
Figure 1.8. TRPV1 is a polymodal cation channel. TRPV1 can be activated by a variety of noxious stimuli such as heat, pH and pressure, and its interaction with other receptors including G protein-coupled receptors (GPCRs) contributes to its polymodal nature. GPCR activation can directly lead to recruitment of PKC and PKA, through phospholipase C and adenylyl cyclase respectively, to phosphorylate TRPV1 and sensitize the channel. Elevations in intracellular Ca2+
from TRPV1 and GPCR stimulation can activate calcineurin and CaMKII via calmodulin to further modulate TRPV1 activity.
Figure from Ho et al. (2012) and used in accordance with the Creative Commons Attribution Noncommercial License.
mice, radioligand binding and immunocytochemistry, TRPV1 expression within the CNS has been documented. These studies localize TRPV1 mainly to the hippocampus and cortex with additional expression in hypothalamus, olfactory nuclei, dentate gyrus, locus coeruleus, superior colliculus and spinal cord (Roberts et al., 2004; Toth et al., 2005). These observations of
widespread TRPV1 expression, however, are contested by a TRPV1 reporter mouse that indicates limited expression in the CNS outside of nociceptors in the sensory ganglia. CNS
31
expression was restricted to the posterior caudal hypothalamus, the rostral midbrain, the periaqueductal grey and the hippocampus (Cavanaugh et al., 2011). Although there is discrepancy regarding the exact distribution of TRPV1, it can be appreciated that CNS
expression of TRPV1 indicates a broader function of the channel beyond sensory transmission.
Subcellularly, TRPV1 expression has been found in cell bodies and synapses, predominantly on the post-synaptic dendritic spines of neurons and also in synaptic vesicles (Toth et al., 2005; Goswami et al., 2010; Puente et al., 2011; Puente et al., 2014). TRPV1 is also highly expressed in the cell bodies and neurites of both sensory neurons and neurons
differentiated by induction with retinoic acid (Puntambekar et al., 2005; El Andaloussi-Lilja et al., 2009). Retinal ganglion cells also exhibit TRPV1 expression in somas and in discrete pockets in axons (Sappington et al., 2009). In addition to neurons, TRPV1 protein has also been found in glia including astrocytes and microglia (Doly et al., 2004; Sappington and Calkins, 2008).
TRPV1 in neuronal function
As a cation channel that preferentially fluxes Ca2+, TRPV1 is also involved in neurite outgrowth and growth cone dynamics. Growth cones are incredibly dynamic and undergo rapid directional changes in response to a chemical gradient. Localized elevations in Ca2+ at the growth cone can induce extension and turning by activating CaMKII for attraction and
calcineurin for repulsion (Zheng, 2000; Wen et al., 2004). Neurite outgrowth is also believed to be Ca2+ dependent. By interacting with microtubule kinase MARK2, CaMKI is able to induce neurite outgrowth under conditions of increased intracellular Ca2+ (Uboha et al., 2007). In retinoic acid-induced differentiation of neuroblastoma cells into neurons, TRPV1 is upregulated in both cell bodies and developing neurites (El Andaloussi-Lilja et al., 2009). Activation of
32
TRPV1 can also induce the formation of varicosities along neurites and retraction of growth cones through microtubule disassembly in a dorsal root ganglia cell line (Goswami et al., 2007).
In addition to growth cones and neurites, TRPV1 also localizes to synapses, and emerging studies indicate the channel can modulate synaptic transmission. In a DRG cell line, TRPV1 colocalizes with synaptic proteins at filopodia tips, where activation results in vesicle fusion. This activity suggests that TRPV1 modulates neurotransmitter release (Goswami et al., 2010). For example, capsaicin can activate a subset of neurons in the solitary tract to induce an inward current and an increase in spontaneous activity to facilitate glutamate release (Doyle et al., 2002; Peters et al., 2010). Furthermore, in DRG and spinal cord co-cultures as well as slices from substantia nigra and hypothalamus, capsaicin increases presynaptic Ca2+ to enhance presynaptic activity and glutamate release (Sasamura et al., 1998; Marinelli et al., 2003;
Medvedeva et al., 2008). In addition to glutamate release, TRPV1 has also been implicated in dopamine release at the nucleus accumbens and in enhancing the firing of dopaminergic neurons (Marinelli et al., 2005). In the peripheral nervous system, capsaicin-induced Ca2+ increases lead to the release of neuropeptides substance P and calcitonin-gene related peptide (Gazzieri et al., 2007; Huang et al., 2008).
TRPV1 in synaptic transmission and plasticity
By altering synaptic Ca2+ levels and neurotransmitter release, TRPV1 can modulate synaptic transmission. In spinal cord slices from rats injected with Freund’s complete adjuvant, the TRPV1 antagonist, SB-366791 decreases the frequency but not amplitude of spontaneous and miniature excitatory post-synaptic currents (EPSCs) (Lappin et al., 2006). In striatal medium spiny neurons and sensory neurons, TRPV1 enhances the frequency of glutamatergic EPSCs that