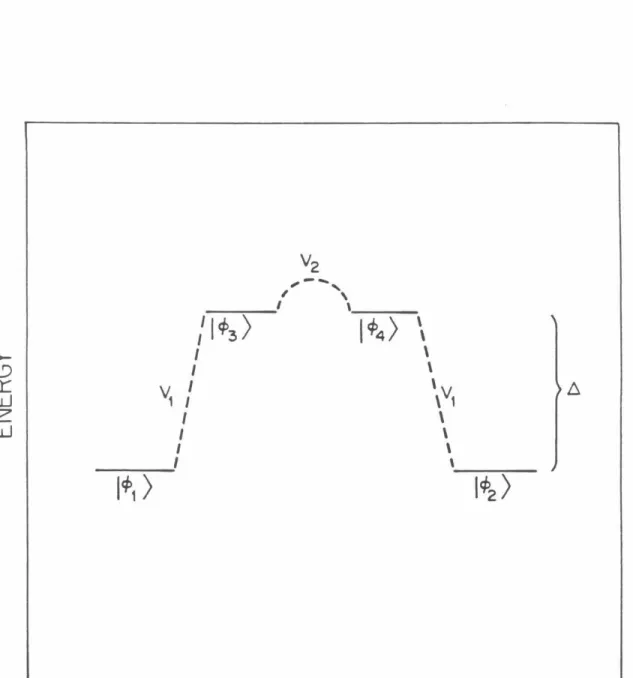
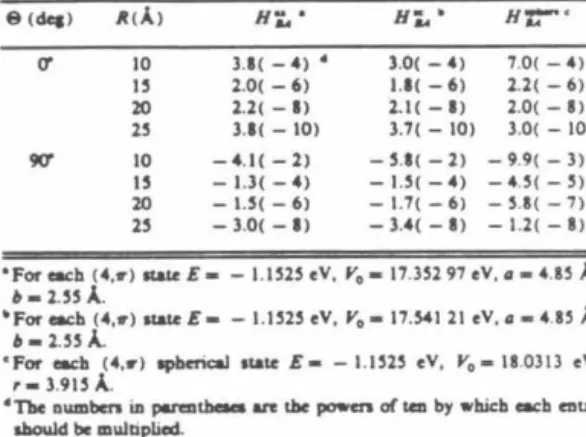
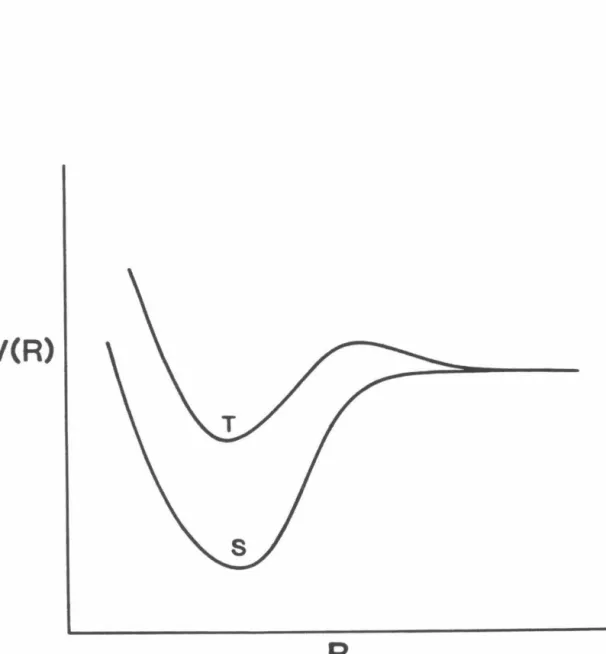
To describe the orientation of the two wells for calculating H.A, the coordinate system (R,0) shown in Fia. 1, which allow the splitting of eigenvalues by tunneling in the double well problem.
INTRODUCTION
TWO-STATE APPROXIMATION AND REACTIVE TRANSI- TION PROBABILITY CALCULATIONS
Nakamura et al.12 recently proposed the use of Eq. 8) for the collinear H-transfer system studied in Ref. The adiabatic potentials are then determined from Eq. 5), with analytical continuation serving to expand them into the complex plane.
RESULTS AND DISCUSSION
We turn next to a discussion of the error of the CS approximation in the threshold region. At least in part, it is the smallness of the p-momentum that makes you small in the threshold region.
CONCLUDING REMARKS
We now move on to choosing the value of Pc used in the functional forms for the Vi's (cf. the adiabatic potentials calculated from the analytical diabatic potentials of equation 10) to be used in determining the imaginary parts of the integrals in Eq.
TOTAL ENERGY (KCAL/MOL)
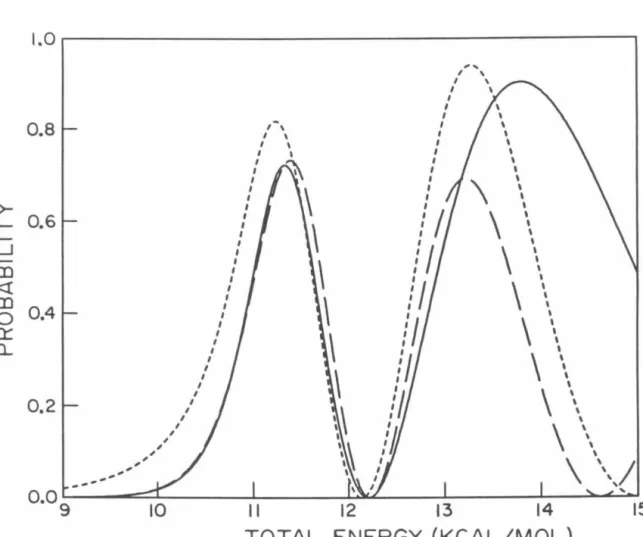
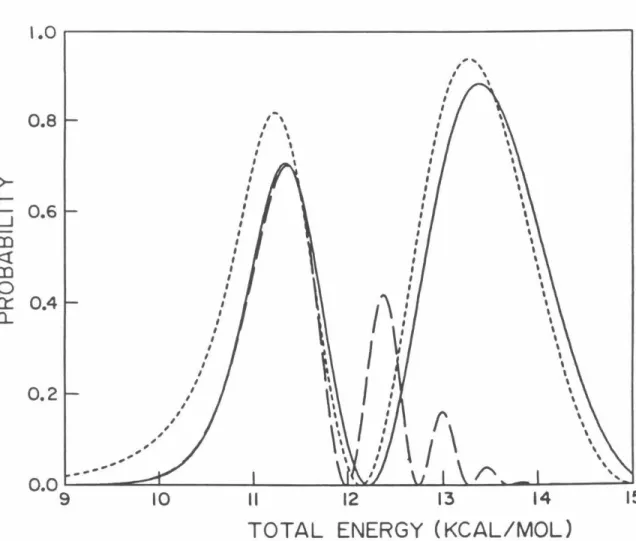
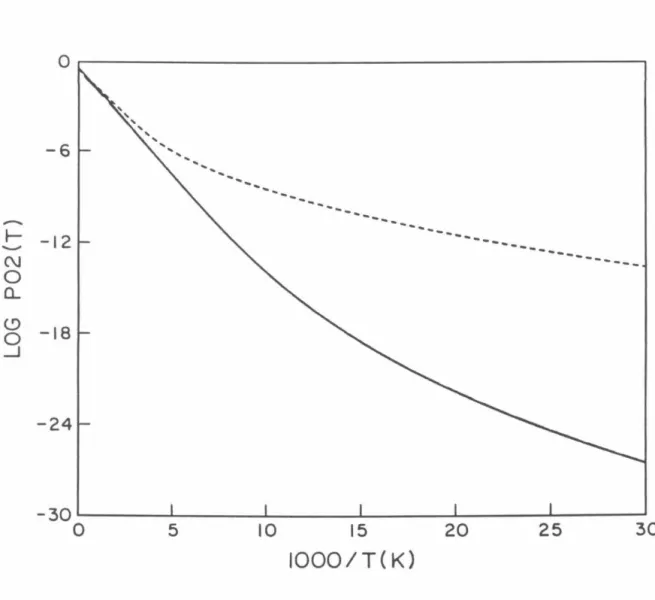
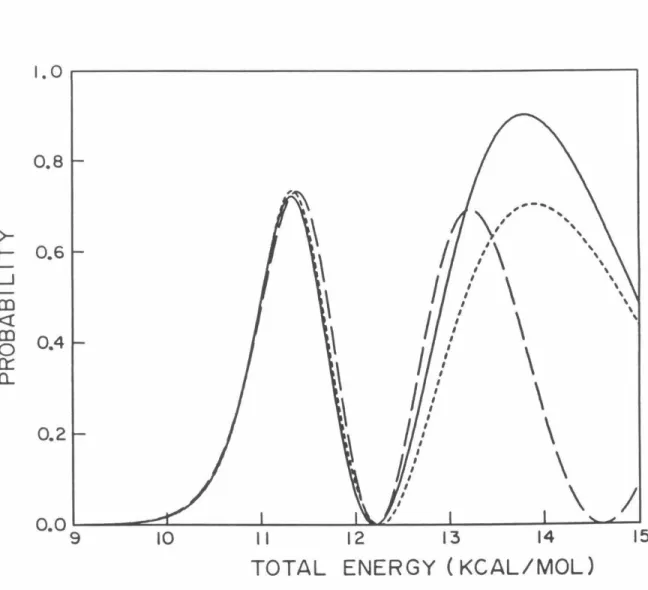
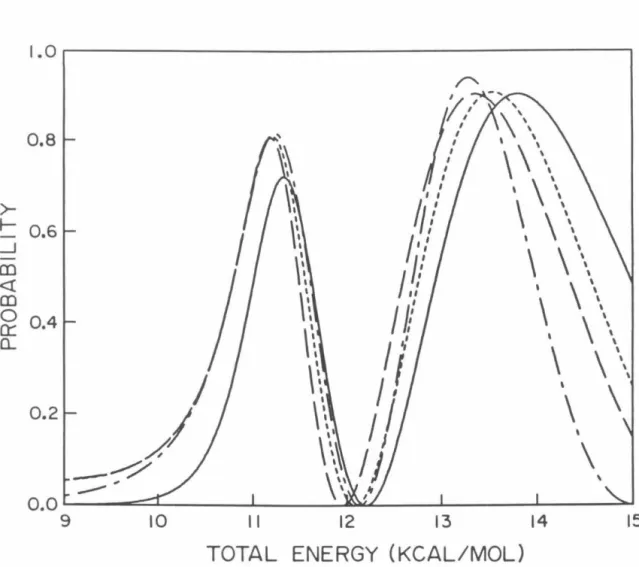
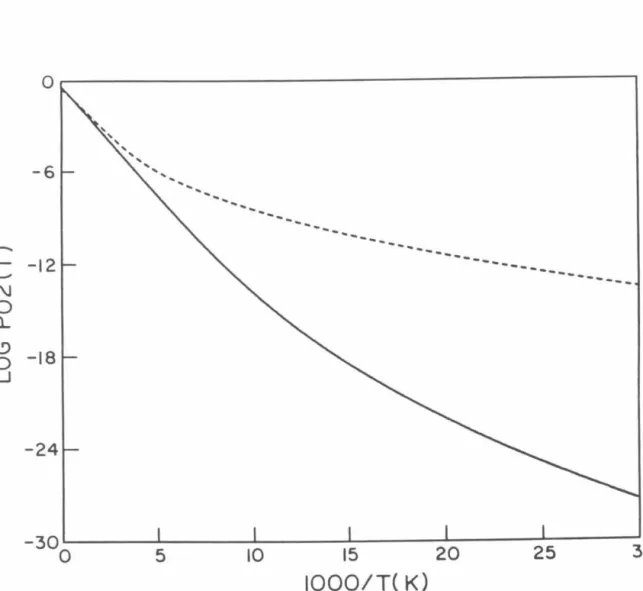
P02 probabilities as a function of total energy measured relative to the minimum of the HBr potential obtained using model analytic diabatic potentials for all calculations. Log1o probability of P02 as a function of 1/T (° K) for which analytical model diabatic potentials are used for all calculations.
TOTAL ENERGY ( KCAL/MOL)
THEORY
Coupled Equations
- RELATIONSHIP TO OTHER PARTITIONING TECHNIQUES The relationship between the present time-dependent method for determin-
- APPLICATIONS
- DISCUSSION
- CONCLUDING REMARKS
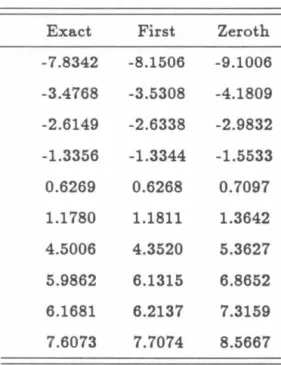
In this situation, the expression for the eigenvalue derived from the first-order effective Hamiltonian is identical to the expression derived from the first iteration of the Newton-Raphson method with the initial guess for E from (H). However, the connection between the higher-order effective Hamiltonians and further iterations of the Newton-Raphson method (as well as for resonant subspaces of dimension greater than one) requires further investigation. Using the formulas for the zero- and first-order effective Hamiltonians given in Eq. 10) and (17), the following analytical result is obtained for the time-dependent probability P1 ( t) of the initial zero-order state:.
The last two quantities can be written in terms of the vectors containing the resonant and non-resonant state amplitudes, such as .
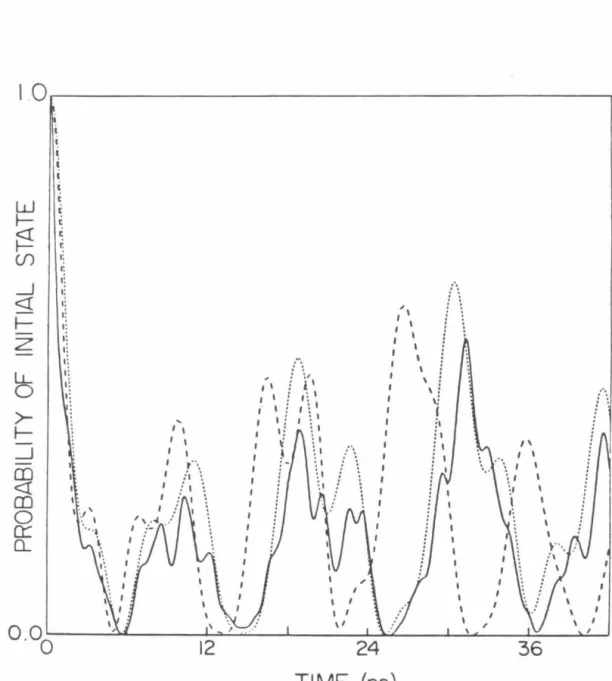
16 TIME (ps)
8 TIME (ps)
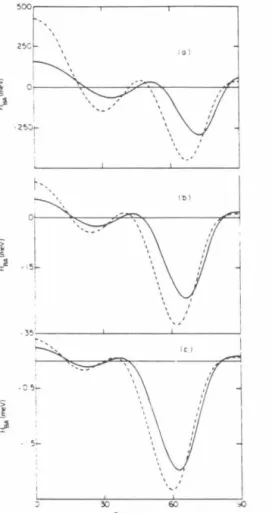
The exact results are given by the solid line, the zeroth-order results by the long dashed line and the first-order results by the short dashed line. The exact results (with no correction factor) are given by the solid line, the zeroth-order results by the long dashed line and the first-order results by the short dashed line.
ABSTRACT
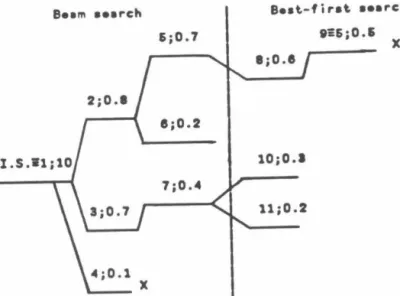
SEARCH ALGORITHM AND EVALUATION FUNCTION
4.1, the path to base state 5 has the highest evaluation function (0. 7) of the three incomplete paths leading to states 5, 6, and 7. Since the evaluation function for the path to state 7 is largest, all states connected to state 7 are found to yield the paths to states 10 and 11. The evaluation function estimates the importance of the path and is a function of the specific path.
It does not maximize (in the sense of setting some derivative equal to zero) the evaluation function for a given state.
MODEL SYSTEM
HL was pre-diagonalized due to the high excitation energies used for the left-handed ligand. Comparison of the results for the excess energy in the left ligand plotted vs. time, with A = 0.1655 (mass of Ge). Their result for the number of transition state states for a given energy and total angular momentum J was given as the convolution.
The classical partition function for the transition states in the transition state is given by
DETERMINATION OF THE QUANTUM PARTITION FUNC- TION FOR THE TRANSITIONAL MODES
Equation (21) has a form parallel to the usual one for a free translation coordinate: distance squared (here the square of the arc length) multiplied by the mass (here the moment of inertia) and divided by twice the time, /31t / P. The final expression for the quantum is therefore the distribution function for the hindered rotation of two rigid rotor molecules. The quantum distribution function for the free rotation of two fragments in their transition state configuration, Q tfrq, is given by the high-temperature expansion44. The classical distribution function for the hindered degrees of freedom of the rotor can be written as
Multiplying both sides of Eq. where ell' and A are given by Eq. 24), (25a) and (30), the relationship between the quantum and classical partition functions for the transition modes can be written as.
RESULTS AND DISCUSSION
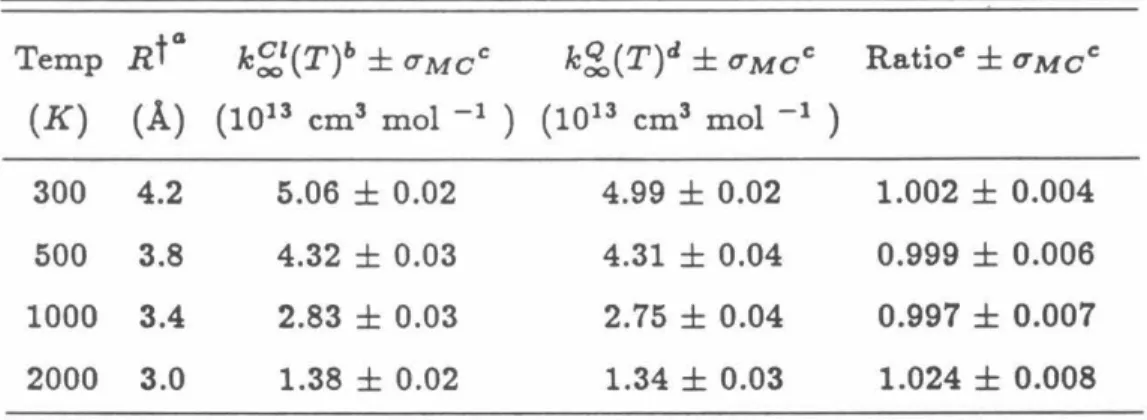
All the quantum results reported in Table 5.1 were calculated using P = 6 discretization points, as the results were found to have converged to this value of P.51 in the classical. Comparing the results for k~1(T) given in Table 5.1, with those given in Table VII of Ref. The ratio calculations were performed along the lines of the quantum calculations in Table 5.1.
In the classical calculations no initialization procedure is needed and 50000 points were used in the calculation of the integral.
DETERMINATION OF NEJ USING ABSOLUTE SPACE ORI- ENTATIONS AND CONJUGATE MOMENTA
To this end, different transformations of the coordinates and impulses are now introduced that describe the line of the centers, orientation and impulses. These transformations, in combination with several observations about the dependence of the integral on certain variables, allow for the desired reduction in the dimensionality of the integral. The first observation is that the integrand in Eq. 4) is independent of the direction of the total angular momentum vector JT and thus of the value of JTz, the z-component of JT.
A Monte Carlo evaluation of this integral requires some treatment of the sampling limits (eg assigning some maximum values to the Pi's).
FREE-ROTATION CANONICAL AVERAGE
There is a typo in the last row of rotation matrix A, namely that the '1/J's should be replaced by ¢'s. The kinetic energy T1 is given in Section III for each of the individual fragment cases. More specifically, the coordinates for the orientation of the line of midpoints ( 012 , 12 ) and their conjugate impulses are specified.
Clear definitions of the Q~ partition functions and Ti0 fragment kinetic energies for the specific cases are also given in Section III.
PROPERTIES OF DIFFERENT FRAGMENTS {a) General Formulae
The orientation of the body-fixed axes of fragment i relative to the Cartesian axes fixed in space is determined by the coordinates Oa. The Cartesian components of the rotational angular momentum fixed in space for the fragment i, iz, j11 and j;, are now given by 8. The Cartesian components of the rotational angular momentum fixed in space for the fragment i, iz., j' ll and iz, are given in terms of the transformed moment.
The definition of the free-rolling canonical partition function for use in averaging is 11.
CASE OF TWO MINIMA IN THE NEJ(R) PLOT
Such an effect causes the high-pressure recombination rate constant to decrease with increasing temperature.3•4. As noted by Chesnavich et al.11, when these ideas are applied to a unimolecular dissociation reaction, the rate constant is given by1 1. Subsequently, studies by Pollak et al.15 showed that the assumption incorporated in Eq. 29) having statistically determined reflection probabilities is not a good energy at all. Pollak et al.15 then presented a method to determine a lower bound on the reaction probabilities based on consideration of only those trajectories that cross the surface with the maximum flux twice or less.
This result can be directly applied again to the case of unimolecular dissociation and the rate constant is then given by .
ROLE OF THE REPULSIVE CURVES IN UNIMOLECULAR DISSOCIATION
As already noted, these formulas (29) and (30) for the NCNO system we studied reduce in practice to Eq. 1), with NlJ now having the smallest of the number of states at the two local minima.
CONCLUDING REMARKS
A given potential energy surface is used, along with an assumed separability of the conserved modes from the transition modes. In section II, a brief description of the theoretical determination of the number of states for the highly flexible transition state of NCNO is given. The Rt of the latter varies with l, and so there are a number of such Rt(l)s for the given J.
A final consideration involves determining the density of states for the reactant molecule.
REACTION RATE CONSTANT RESULTS
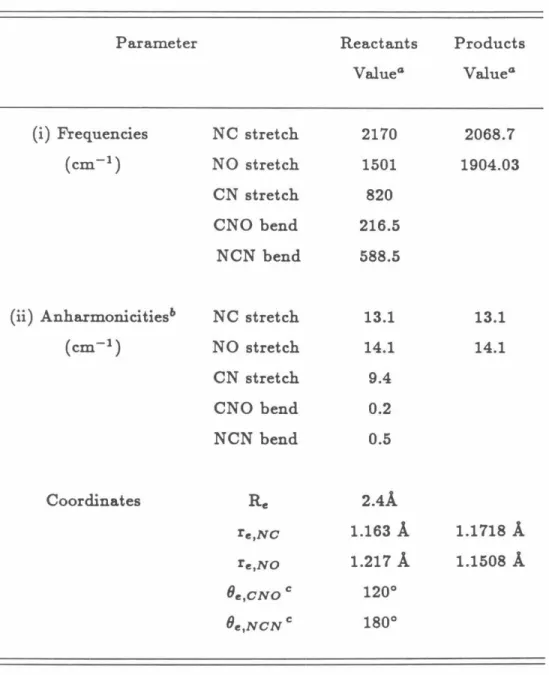
The properties for the conserved modes are given in Table 8.1, along with the frequencies and anharmonicities for the reactant transition modes. The non-bonding potential was chosen as a sum of 6-12 Lennardlones potentials for the van der Waals interactions between the non-bonded atoms of the two individual fragments, as in Eq. The parameters for this potential energy surface model for the transition modes are given in Tables 8.2 and 8.3.
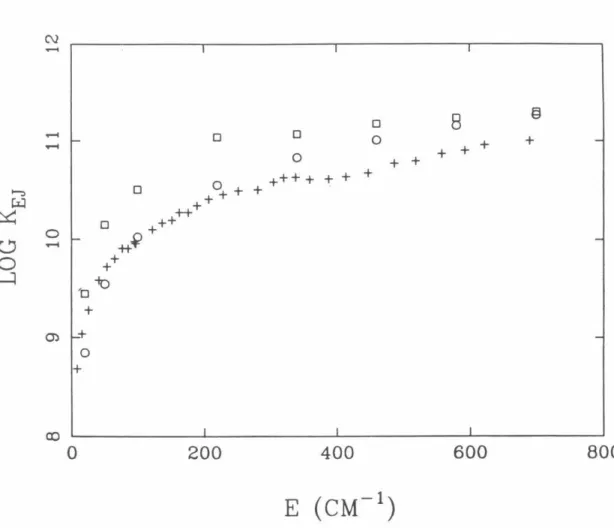
The results for the kEJ calculations for the above potential energy surface model are given in Fig.
REACTION RATE DISCUSSION
70 A -2 the RRKM results already differ from the PST results by a factor of 0.69 at E = 700 cm-1 • The calculated velocities also depend on the strength and location of the attractive wells of the Lennard-Jones potentials, which describe the hindered rotation of the fragments. 8.9 - 8.12 show the dependences of the current potential energy surfaces on certain bending angles for typical Rt. The graphs of the rotational distributions of NO and NC determined by the above method are given in Fig.
In Table 8.4 the vibrational distributions calculated from the current application of the RRKM theory are compared with those determined both experimentally and by PST by Nadler et al.4 From Table 8.4 it can be seen that the RRKM distributions for the excess energies of 2348 cm-1 and 2875 cm- 1 are in better agreement with the experimental distributions than the PST distributions.
CONCLUDING REMARKS
The RRKM theory distributions could not be determined for excess energies higher than 3000 cm-1 because the assumed Lennard-Jones potentials were so strongly repulsive in this region that there was no local minimum in the NEJ(R) plot. The need for accurate ab initio potentials for the transition states is thus emphasized once again. A common point in the results presented here is the dependence on the values used for the potential surface parameters.
Also, product state distributions could not be determined for excess energies above about 3000 cm-1 due to inaccuracies of the Lennard-Jones repulsion surface at these high energies.
Relevant Potential Energy Surfaces of NCNO
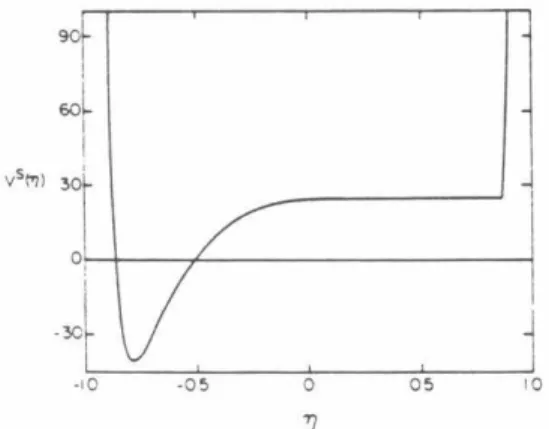
Circles indicate RRKM calculations on the singlet surface only; boxes indicate RRKM calculations including singlet and triplet surfaces with '3 degeneracy for the triplet. Graph of theoretically determined rate constants log kEJ as a function of energy for two different assumed parameters for the Varshni binding potential and graph of experimentally determined rate constants {plus signs). Plot of the potential energy surface (i) as a function of 8Nc and 8No for different R's in the transition state region.
8No and 8Nc are the angles that define the orientation of the fragments NC and NO for a planar NCNO molecule and are illustrated in the inset.