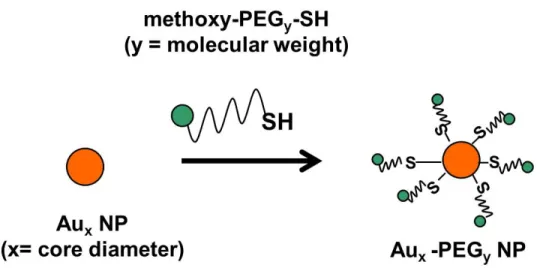
An important part of this thesis involves the use of PEGylated gold nanoparticles to test in vivo targeting of biological sites. Inductively coupled plasma mass spectrometry (ICP-MS), silver-enhanced light microscopy (LM) and transmission electron microscopy (TEM) jointly monitor the in vivo distribution of PEGylated gold nanoparticles at the level of organs, tissues and cells, respectively. - tively.
Abstract
Introduction
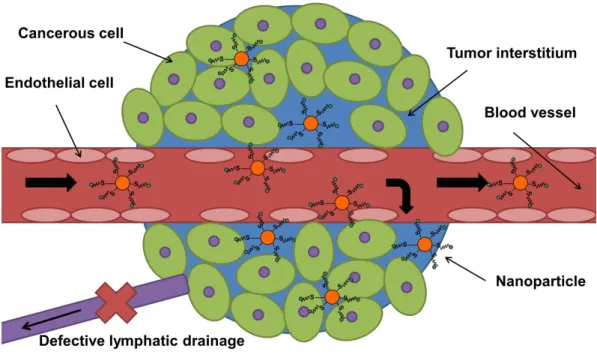
Passive targeting” exploits the unique properties of tumor biology that allow nano-sized objects to accumulate in the tumor using the EPR effect. The random retention of nanoparticles in the tumor due to the EPR effect is difficult to control and may contribute to multiple drug resistance (expulsion of therapeutics from cancer cells in the tumor) [107].
Results and Discussion
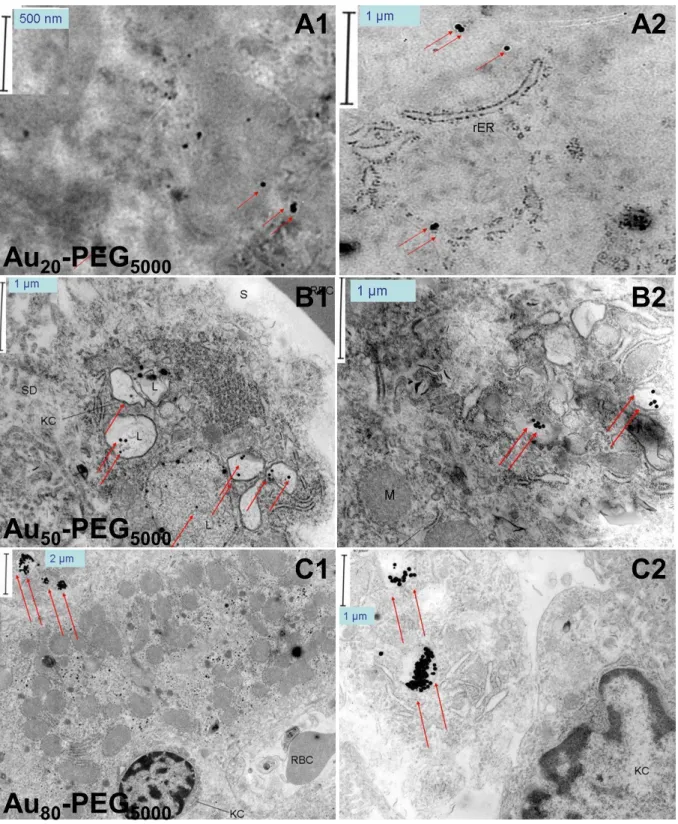
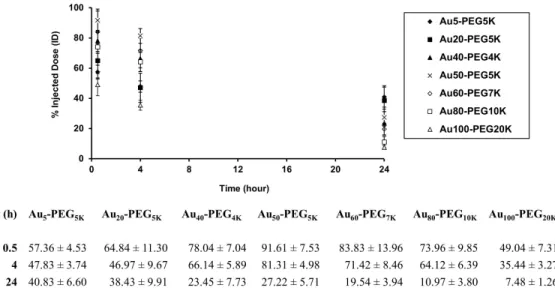
Aux-PEG5000 NPs of all dimensions agglomerated near leukocytes due to leakage and irregularity of the tumor blood vessels (Fig. 2.3A-C1). Au50-PEG5000 NPs resulted in the maximum deposition in renal corpuscles among all particle sizes.
Conclusion
From the results given in Chapter 3, a threshold content of the targeting ligand is required for nanoparticles in the tumor interstitium to enter cancer cells. Based on renal imaging data, the inevitable consequence of delivery of Au50-PEG5000 NPs (with attached targeting ligands) to tumor-bearing mice is their accumulation in renal corpuscles in the kidney.
Supporting Information
While random sampling guarantees an equal probability of capturing each segment of the section, it does not exclude the probability of repeated sampling of the same segment. This is a direct application of the "Cavalieri principle" and is similar to counting a population of cells using a hemacytometer. The association of an area with a point located at each intersection allows coverage of the entire area of the network.
Materials and Methods
The same procedure was repeated for all microscopic images that captured particles of the same size and in the same tissue area. Such counting made it possible to calculate the sum of particles of a certain dimension, i, located in a certain tissue area, j, denoted by Nij. Normalization of Nij by Aij resulted in Πij, the particle surface density per unit tissue area dimension j.
Abstract
Introduction
These results suggest that active targeting of nanoparticles occurs via a different mechanism than individual targeting ligands, e.g. antibodies. We prepared a series of gold nanoparticles with transferrin content spanning two orders of magnitude for comparison with non-targeted particles, to test the mechanistic effects of the active targeting of nanoparticles in solid tumors, as well as to delineate particle distribution patterns due to ligand targeting at the cellular level, a level not investigated in previous organ and tissue distribution studies. Human holo-transferrin (Tf) is the targeting ligand used here to investigate the effects of active targeting.
Results and Discussion
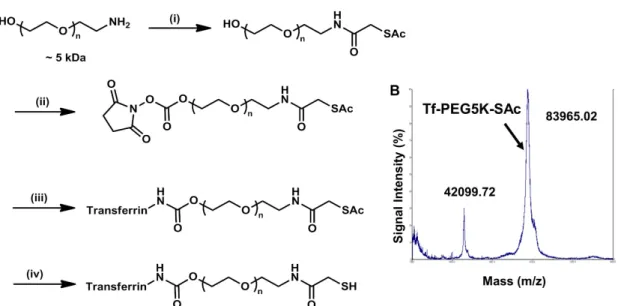
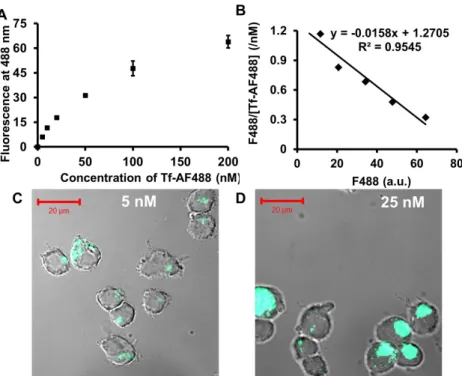
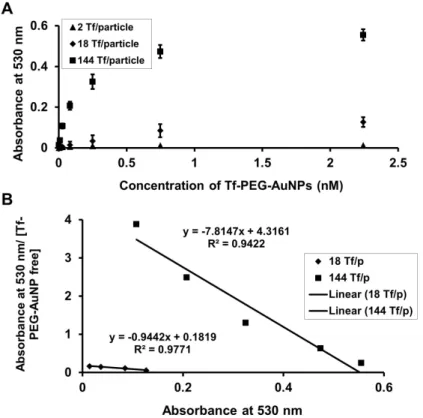
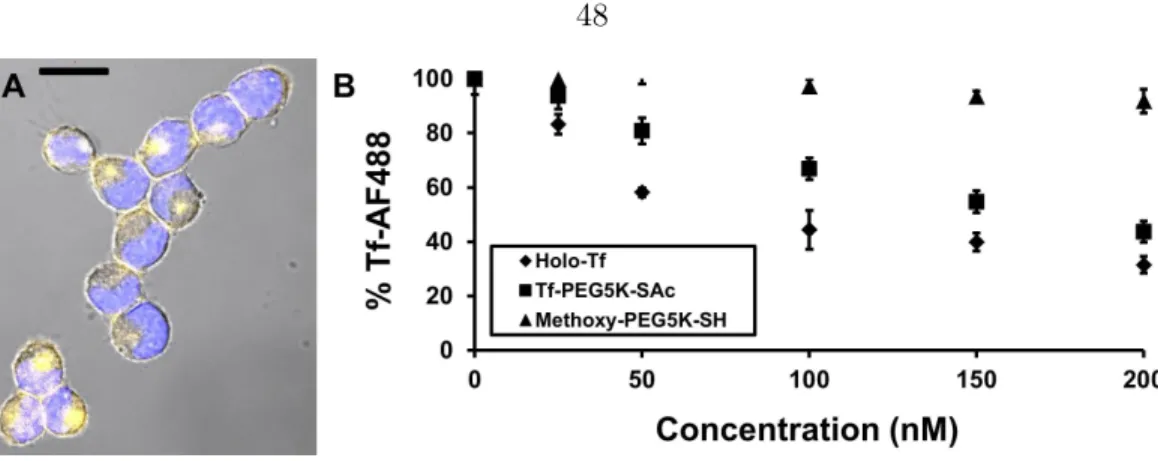
Addition of Tf-PEG5000-SH (unprotected Tf conjugate) to an aqueous suspension of 50 nm unmodified AuNPs (I) triggers the assembly of Au50-PEG5000-TfxNPs (Figure 3.4A). From the Au50-PEG5000-Tfx NP saturated binding experiment, IV-V binds to Neuro2A cells in a manner dependent on Tf content and nanoparticle concentration (Figure 3.6), confirming the successful conjugation of Tf-PEG5000-SH to the particle surface. Particle III barely bound to Neuro2A cells (Figure 3.6) and was therefore not included in the binding study with 3T3 cells (with an even lower TfR density).
Conclusion
Inserting the Kds of IV and V obtained for 3T3 cells and applying the geometric assumption that only 21.33% of the ligands bind to TfRs, the Langmuir isotherms demonstrated a significantly attenuated equilibrium binding fraction for these particles compared with its homologous curve Neuro2A ( Fig. 3.11B). From this model, even V, with the highest density of Tf ligands, could only bind to <15% of the receptors, suggesting the futility of intracellular localization of V within a 3T3 tumor (with weak TfR expression and assuming that it is tumorigenic ). These data when taken together with past tumor permeation work performed with other targeted nanoparticle delivery systems (dextran [99], immunoliposomes [145], and Tf-targeted cyclodextrin [146]), support the conclusion that targeting nanoparticles in the sub-100 nm size range will always deliver a higher payload (drug, imaging agent, or combination) to cancerous tumor cells than their untargeted counterparts.
Supporting Information
To calculate the curvature of the sphere, set the second expansion term to the same magnitude as the first term (ie, order 1). This gives the corresponding length scale in the radial direction indicating the contact of the sphere with the flat surface: r = 2R1/2 = 2(dR)1/2. By geometric assumption, the multivalent increase in binding is up to ∼600 and ∼4800-fold for IV and V, respectively.
Materials and Methods
Complete PEGylation of the unreacted gold surface required the introduction of 10 µL of 1 mM mPEG5000-SH into the reaction mixture and continued at room temperature with shaking for 30 min. The reaction mixture was centrifuged at 14,000 x g for 10 min, followed by removal of the supernatant fraction containing unreacted or dimerized Tf and methoxy-PEG5000s. Au50-PEG5000-Tfx NPs sank to the bottom of the reaction vial as a brick-red pellet.
Abstract
Introduction
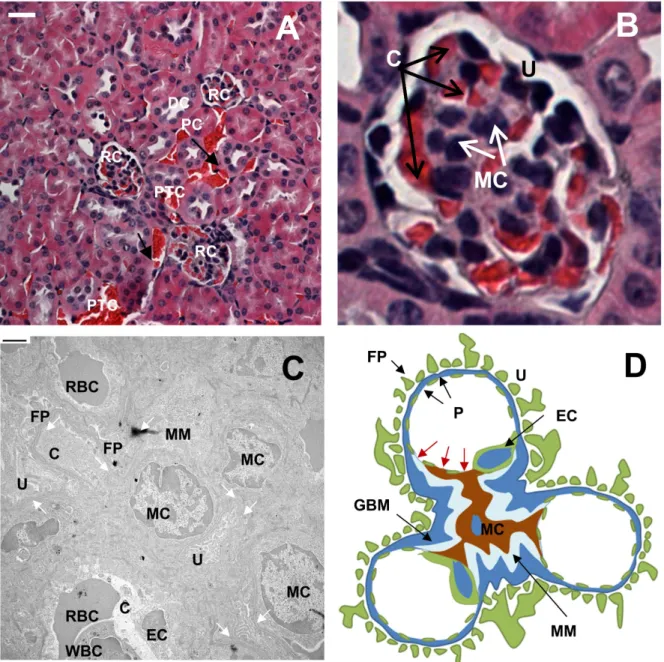
Legend: renal corpuscles (RC), distal convoluted tubules (DC), proximal convoluted tubules (PC), peritubular capillaries (PTC), red blood cells (RBC), leukocytes (WBC), mesangial matrix (MM), mesangial cells (MC), foot processes of podocytes (FP), urinary space (U), glomerular capillary space (C), endothelial cell (EC), glomerular basement membrane (GBM) and pores (P) of the fenestrated endothelium of glomerular capillaries. Closer examination of the renal corpuscle reveals the existence of another intriguing cutoff that would influence the distribution pattern. Within the renal corpuscle, in the absence of GBM and podocytes, the only separation barrier between the mesangium (mesangial cells and extracellular matrix) and the glomerulus is the fenestrated endothelium (Fig. 4.1D, modified from Sakai and Kriz [171]).
Results and Discussion
Images shown in the second column (scale bar = 500 nm) are magnified versions of those shown in the first column (scale bar = 2µm). The images shown in the second column (scale bar = 500 nm) illustrate the magnified section (black box) shown in the first column (scale bar = 2 µm). Images shown in the second column (scale bar = 500 nm) illustrate the magnified section (black box) shown in the first column (scale bar = 2µm).
Conclusion
Based on TEM data, size-dependent uptake occurs exclusively with mesangial cells, which exist in two types. The first type is contractile mesangial cells, which resemble vascular smooth muscle cells and fibroblasts, which regulate the surface area for glomerular filtration of fluids and mesangial volume. Specimen processing for microscopy involves repeated dehydration and can lead to shrinkage of fine cellular features.
Supporting Information
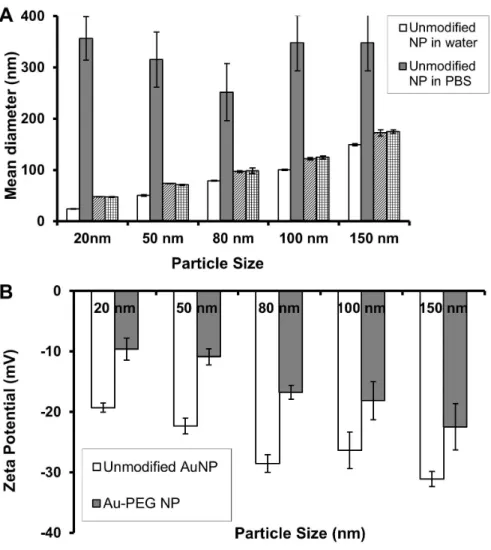
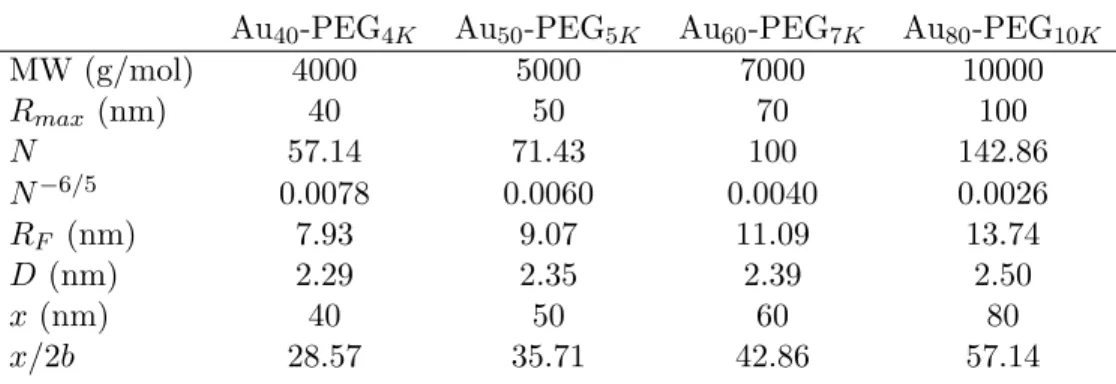
Alternatively, one can calculate the footprint (D) of each PEG chain (separation distance between each adjacent PEG chain) on the gold surface, knowing that 4πD2 = Σ. Because the RF > D result is clear for all other Aux-PEGy NPs, the grafted PEG chains take the “brush conformation” on the gold surface for all particle sizes. For Aux-PEGy NPs at hand, their values ofx/2b mainly lie in the range of.
Materials and Methods
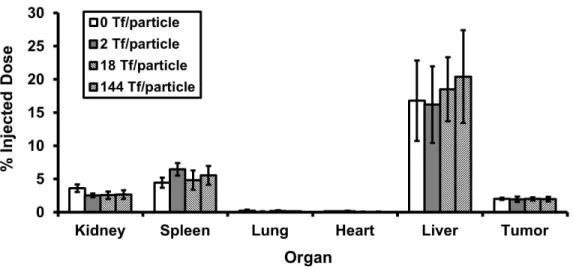
All excised organs were subjected to routine ICP-MS procedures for gold contact quantification (see Appendix A). To assess glomerular targeting efficiency (GTE) of particles to renal corpuscles from light micrographs, 300 renal corpuscles selected at random positions from 10 to 15 kidney sections per injected mouse were visually inspected for the presence of silver stains. Both staining intensity and spread of these 300 renal corpuscles were scored for staining index (SI).
Abstract
Introduction
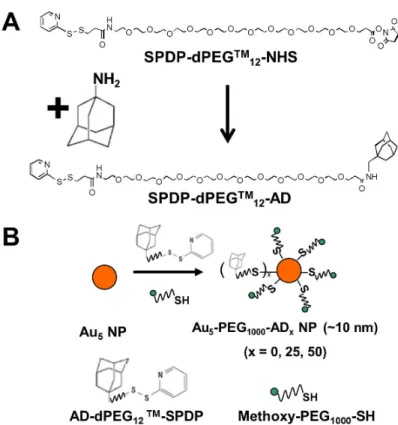
The first type of conjugate consists of repeating units of β-CD and PEG as the polymer backbone, grafted with camptothecin (CPT) as the active ingredient on their pendant chains [ 177 ]. The second type comprises repeating units of β-CD and a short cationic linker as the polymer backbone, non-covalently decorated by PEG-adamantane (for stability against salt-induced. aggregation) and Tf-PEG-adamantane (for targeting tumor cells) that overexpress Tf receptors) [160]. In aqueous medium, the combination of electrostatic (between the cationic CDP and siRNA) as well as hydrophobic foci (between adamantane and CD cups on the CDP backbone) drives the self-assembly of these ingredients into stable nanoparticles with a diameter of ~70 nm (indicated as CALAA-01) [185].
Results and Discussion
It is clear that the colocalization of IT-101 and Au5-PEG1000-ADx NPs fluorescence signals increased with AD content of the stain. Confocal microscopy of the same tumor tissues followed, used in conjunction with Au5-PEG1000-AD50 NPs. Sections of the tumor tissue were stained for the presence of CALAA-01 nanoparticles using Au5-PEG1000-AD50 NPs.
Conclusion
Here, we report the design and optimization of a chemical stain that specifically recognizes CDP nanoparticles ex vivo. Application of this chemical dye (Au5-PEG1000-AD50NPs) ex vivo to treated cells or tumor cryosections containing CDP-administered nanoparticles enables their detection. This stain reveals the intracellular accumulation of CDP nanoparticles (IT-101 and CALAA-01) in cells, animal tumor tissues and patient tumor biopsies, and thus guarantees the extraction of key pharmacological information in vivo (such as intratumoral transport and dose response). in an ex vivo setting.
Materials and Methods
20% of the siGL3 molecules in the formulation contain a Cy3 residue at the 5' end of the sense strand. In tumor-bearing animals, the in vivo distribution patterns of the liver and kidney are similar to those observed in normal mice. In Chapter 2, because PEGylated gold nanoparticles of different sizes have PEG caps of the same length (PEG5000), they do not have the same ζ-potential (unlike Chapter 4).
Based on fluid mechanical foundations, Aux-PEGy NPs as model probes can validly mimic the in vivo flow pattern of therapeutic nanoparticles of the same size (Appendix B) despite their much higher density compared to actual nanoparticles therapeutic (cyclodextrin, lipid, polymer, nucleic acid). The sedimentation of the spheres and the fluid shear due to suspension are orthogonal to each other.