The purpose of this study was to find out the effect of picture gap-filling strategy on students' writing skills of tenth grade students of SMKN 1 Jenangan. Therefore, it can be concluded that using picture gap filling strategy has a significant effect on students' writing skills among tenth grade students of SMKN 1 Jenangan.
INTRODUCTION
- Background of the Study
- Identification of The Problem
- Limitation of The Study
- Statement of The Study
- Objective of the Study
- Significance of the Study
- Organization of the Study
The researcher tries to apply the gap-filling strategy with images to improve students' writing skills. The purpose of this study is to provide a picture gap filling strategy to improve students' writing skills.
REVIEW OF RELATED LITERATURE
- Theoretical Background
- The Scope of Writing
- descriptive Text
- Gap-filling Strategy with Pictures
- Previous Research Finding
- Theoretical Framework
- Hypothesis
The objectives of this research was to find out whether the use of picture as media to improve the writing ability of descriptive text is effective or not in the eighth grade students of MTs Negeri Purworejo in the academic year of 2015/2016. The research method was pre-experimental. research using one group pretest-posttest design. The researcher teaches the students of experimental class using gap filling strategy with pictures. In the experimental class (X TOI B), the researcher taught students to use gap-filling strategy with pictures.
In the last meeting, the researcher reviewed the material on descriptive text and how to use the gap-filling strategy with pictures in descriptive text. The table below shows students' writing scores before students were taught using the gap-filling-with-pictures strategy. This means that using the gap-filling strategy with pictures has an impact on students.
This suggests that using gap-filling strategy with pictures has no effect on students' writing skills. This suggests that using gap-filling strategy with pictures has an effect on students' writing skills.
RESEARCH METHODS
Research Design
- Research Approach
- Type of Research
The research design below is divided into two points namely; approach and type of research. The use of the quantitative approach in this research is the collection and analysis of numerical data. In this research, the researcher applied non-equivalent control group design (pre-test and post-test).
The teacher asks the students to complete the task of filling in the gaps in the sentences with the pictures.
Research Setting
Population and Sample
After the treatment, the researcher administered a post-test to the students to see and compare the growing score of the students in the experimental and control classes. The researcher will obtain the data from the student's test result and then analyze it. The differences between the control class and the experimental class are the media used in the treatment.
From the table above, it can be seen that the writing result of students in the experimental class in the post-test showed that 17.60% in the good category, 76.50%. The normality test aims to state whether the data from the students' test score for the descriptive text for the experimental class (X T OI B) and the control class (X T OI . 56 A) from the population are normally distributed. 62 the impact of the strategy of filling the gaps with pictures on the students' writing skills in the tenth grade students of SMKN 1 Jenangan in the academic year 2020/2021.
Research Variable and Operational Definition
Technique and Instrument of Data Collection
Before the treatment, the researcher administered a pre-test to the students to check the extent of students' agreement, especially their competence to perform the task for descriptive text. In this test, students were asked to do the task on descriptive text without gap filling strategy with pictures in experimental and control class. After conducting the pre-test, the researcher treated the experimental class and instructed them to complete the task including descriptive text using gap-filling approach with pictures.
First meeting (pre-test and first treatment). do the pretest individually. explaining the material about descriptive text using gap-filling strategy with pictures. to ask students to form some groups to complete the task about my mother using a fill-in-the-blank strategy with pictures. Asking students to do the pre-test individually. explanation of the material about descriptive text f. The researcher asks the students to read an example of a descriptive text about avengers d. to identify the meaning of the pictures.
Validity and Reliability
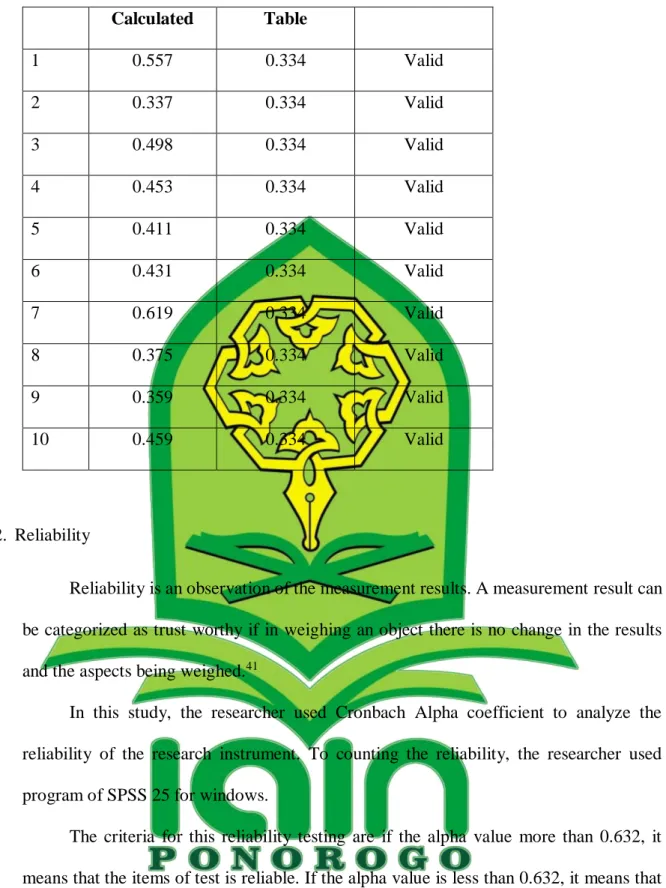
In this study, the researcher used the Cronbach Alpha coefficient to analyze the reliability of the research instrument. The criteria for this reliability test is that if the alpha value is greater than 0.632, it means that the test items are reliable. If the alpha value is less than 0.632, it means that the test items are not reliable.
Technique of Data Analysis
During the first meeting, the researcher gave a pretest to the experimental class (X TOI B) to test their skill level in receiving the materials. From the above table, it could be seen that the score of the students who wrote experimental lessons in the pre-test showed 17.65% in the good category, 47.05% in the average category and 35.30% in the low category. From the table above, it could be seen that the students' score on the experimental lesson in the post-test was a score of 5.90% in the good category, 79.50% in the average category and 14.60% in the low category. category showed.
From the table above, it could be seen that the score of the students' writing of experimental class in post-test showed that 5.90% in the good category, 70.60% in the medium category and 23.50% in the low category. Based on the data analysis, it can be seen that the mean value of the experimental class (84.12) was greater than the mean value of the control class (41.18). The results of data analysis showed that the post-test mean values in the experimental class are 84.12, while the post-test mean values in the control class are 41.18.
FINDINGS AND DISCUSSIONS
Data Description
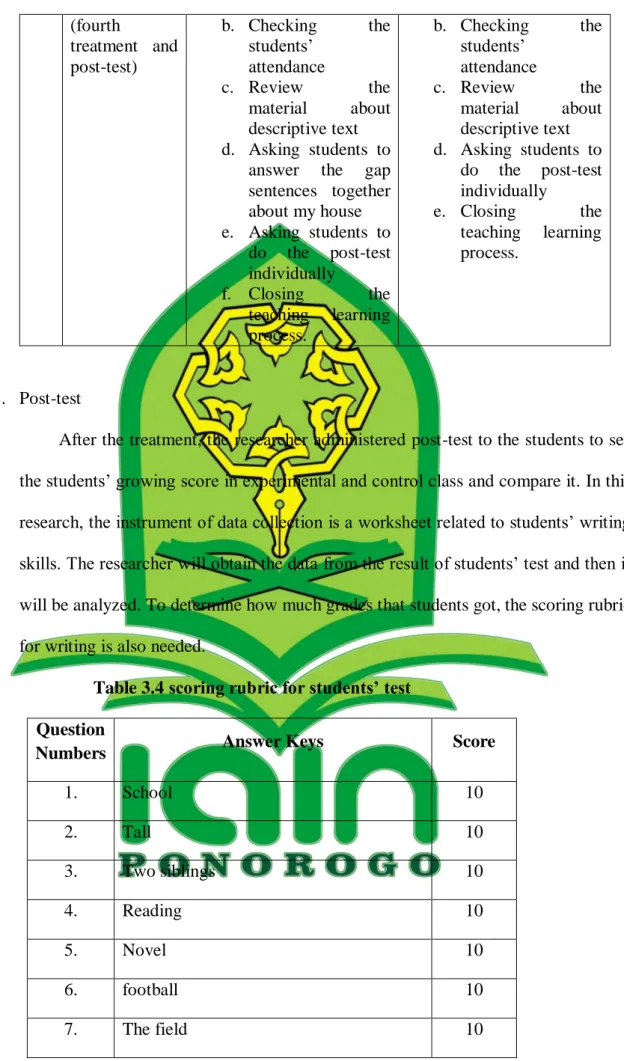
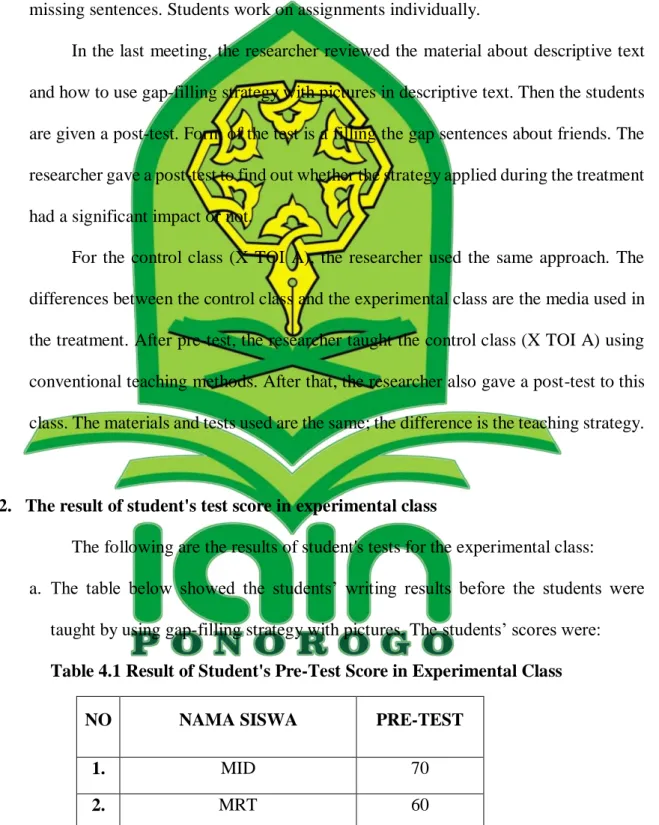
During the third meeting, the researcher asked the students to read the descriptive text about the avengers. The researcher conducted a post-test to find out whether the strategy applied during the treatment had a significant impact or not. According to Table 4.1, the highest pre-test score is 80, while the lowest pre-test score is 10.
According to Table 4.4, the highest post-test score is 100, while the lowest post-test score is 60. According to Table 4.7, the highest pre-test score is 60, while the lowest pre-test score is 20. According to Table 4.4, the highest post-test score is 60, while the lowest post-test score is 20.
Inferential Statistics
- Assumption Test
- Hypothesis Test
It can be concluded that the data of experimental class (X T OI B) was normally distributed because the value was higher than gt; 0.05). Homogeneity test was performed to determine whether the variant of data distribution on students' test scores of the two groups for each experimental class and control class was homogeneous or not. This means that the calculation of students' test scores is greater than gt; 0.05), it can be concluded that the data in this study have a homogeneous variance.
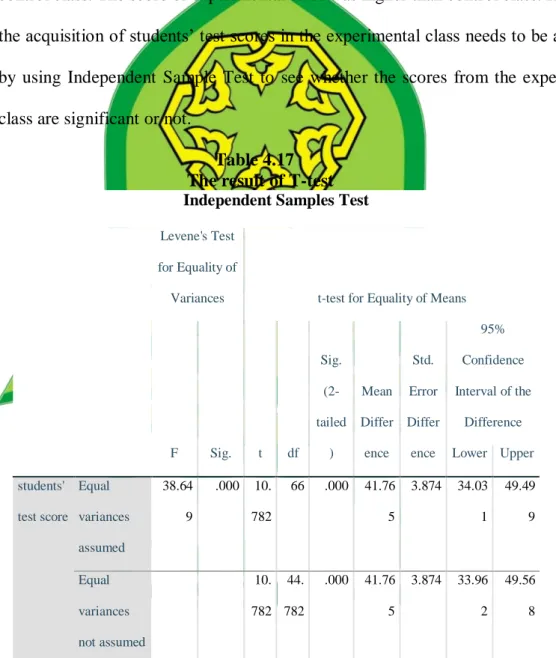
Based on the results of the above table, it was revealed that the number of students in the experimental and control classes was 68 with 34 students in each class. The mean for the experimental class was 84.12, while the mean for the control class was 41.18. However, the acquisition of test scores of students in the experimental class should be analyzed using the Independent Sample Test to see if the results from the experimental class are significant or not.
Discussion and Interpretation
The result of hypothesis test (t0) using independent sample test showed that the coefficient value of students taught by gap filling strategy with pictures and students not taught by gap filling strategy with pictures is 10.782. Based on the interpretation of the hypothesis test above, there was a significant improvement on students' learning outcomes when the gap filling strategy with picture learning method was given than those that were not. Based on the research conducted, it can be concluded that the use of gap filling strategy with pictures has a significant effect on students' writing skills in the tenth grade students of SMKN 1 Jenangan.
One of the creative strategies used to increase students' motivation is the gap-filling strategy with pictures, because this strategy can always make students curious about the meaning implied in the pictures, so they feel challenged to find the answers. The results of the posttest showed that the mean value of the experimental class, which was treated with the strategy of filling the gaps with pictures, was higher than the control class, which was taught with conventional teaching (84.12 > 41.18), which means that there is a significant increase in the results of the experimental classes compared to the results of the control classes. This research is expected to be a reference for teachers to use creative learning models, especially the gap-filling strategy with a visual learning model, because this learning model is effective in improving students' learning outcomes.
CLOSING
Conclusions
To get students excited about learning to write, teachers should provide materials that are appropriate for the students as well as the curriculum. In this case, it is necessary to use a creative teaching strategy that helps students improve their motivation in the learning process, which will affect their learning outcomes. Based on the test results, it can be assumed that H0 is accepted and H1 is rejected.
Recommendations
34; The Effectiveness of Using Image Teaching on Students' Descriptive Writing Skill (A Case Study in Eighth Grade at MTs Roudlotul Khuffadz)", STAIN Sorong, 2019. 34; The Effectiveness of Using Image in Teaching Descriptive Writing at Eighth Grade Students of MTs N Purworejo in the Academic Year of Universitas Muhammadiyah Purworejo, 2016. 34;Using picture series as media in improving students' writing skills in first grade students of SMA Negeri 1 Gowa, Universitas Muhammadiyah Makassar, 2019.
34; Improving the Writing Skills of Tenth Grade Students Using Picture Sequences", Journal of English Language and Education Vol 2. 34; The Use of Multiple Choice Questions and Gap Filling in Measuring Primary School Students' Comprehension of Grammar", ELTIN Journal. 34; Gap-Filling in English as L2 a Form of Text Construction Using Contextual Cues”, University of Economics and Humanities, Bielsko-Biała (April 17, 2019).