Understanding brain function at the molecular level represents one of the most fascinating challenges in modern science. Progenitor cells are responsible for generating the various neurons and glia at the correct locations, proportions and times for the correct development of the nervous system.
Introduction
This anatomical complexity necessitates that Ill1croarray analysis be integrated with systematic in situ hybridization studies in order to resolve the cellular distribution of identified transcripts. In situ hybridization revealed that the majority of genes identified as amygdala-specific on microarrays displayed intra-amygdaloid expression boundaries corresponding to cytoarchitectonically defined subnuclei.
Methods
- Experimental design
- Probe preparation
- Overview of Affymetrix micro array technology
- Data analysis
- In situ hybridization
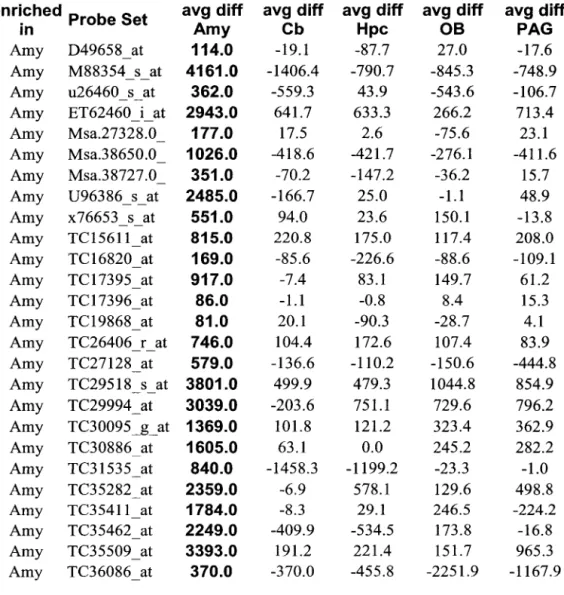
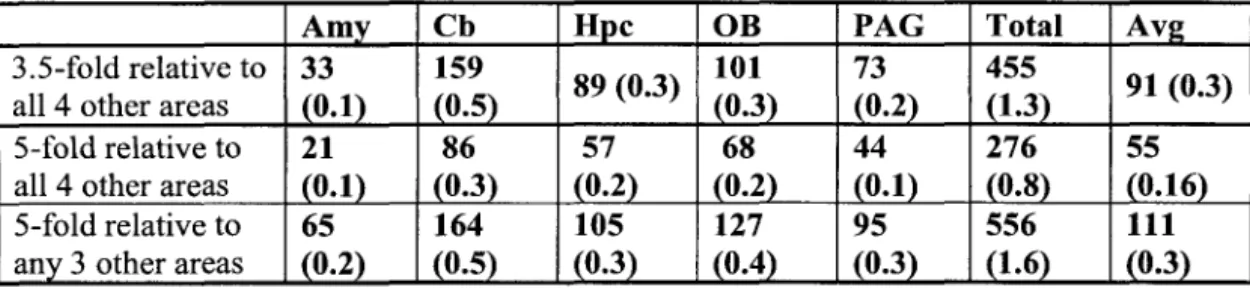
Because the purpose of the microarray analysis was to identify candidate genes for in situ hybridization analysis, rather than to provide precise measurements of individuals. Two criteria were applied to identify genes enriched in each of the five brain regions: (1) the mean difference (~) - value for the gene in that region; and (2) the ratio (fold difference) of the ~ value in the reference region to that in each of the other four.
Results
Analytical characterization of differentially expressed genes
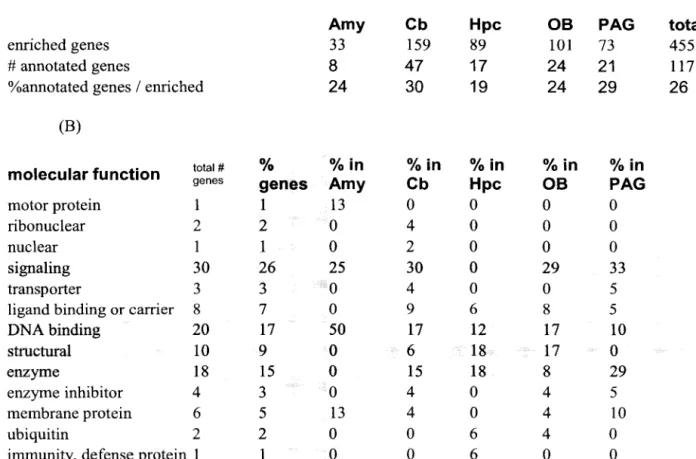
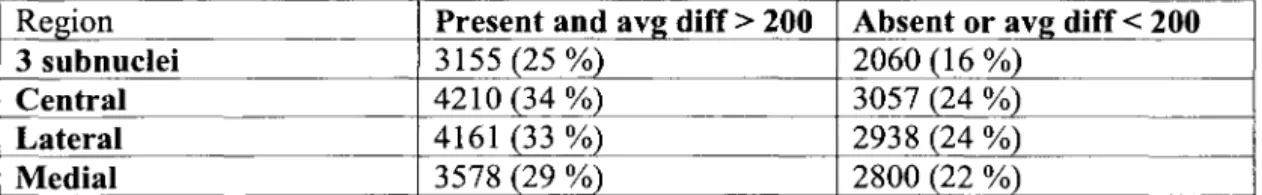
On average, 0.3% of the sampled genes were highly enriched in one of the five brain regions (Table 1). Thus, of the 19,022 genes with detectable expression in one or more regions, half were present in all regions.
Validation of GeneChip results by in situ hybridization
Thus, the expression of many amygdala-enriched genes was simply not detected by in situ hybridization in the other regions examined in the Microarray analysis. As might be expected, most of the amygdala-enriched genes proved to be expressed in at least one other brain area not tested in the Microarray experiment, such as the cortex (Fig. 3C).
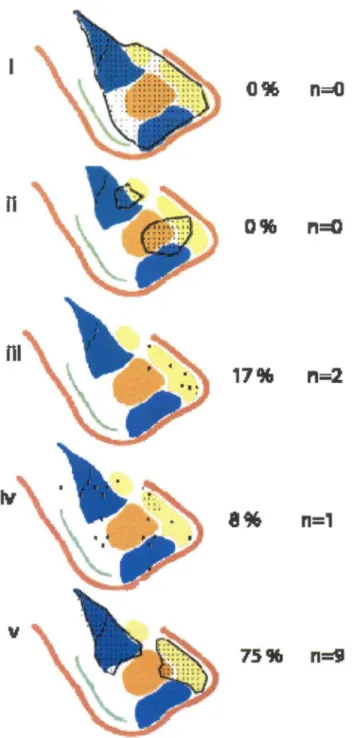
Amygdala-enriched genes respect subnuclear boundaries
The second group (5 genes; 42%) was formed by genes expressed in the central and medial nuclei (Fig. 2A, yellow), which are of sub-pallial (striatal or pallidal) origin. In contrast, 80% of genes in the second (striatal) cluster, such as the neuropeptide vasopressin, were diffusely expressed.
Discussion
A recent study (Sandberg et al., 2000) also used Affymetrix GeneChips to characterize region-specific gene expression in the brain, but did not validate the microarray results by in situ hybridization. Signal was detected in the medial amygdala (arrow) and in the lateral, basolateral, and basomedial complexes (not shown).
Introduction
2 LASER-CAPTURE MICRODISSECTION COMBINED WITH MICROARRAY TECHNOLOGY ALLOWS THE IDENTIFICATION OF GENES DIFFERENTLY EXPRESSED IN DIFFERENT AMYGDALA SUBNUCLEI. Due to the cellular diversity in the brain, important expression differences that occur in a subpopulation of cells that make up a small portion of the total population can simply be diluted and go unnoticed. We decided that although the cost of the commercial arrays was high, their convenience and proven reliability were worth using them.
A transfer film is placed on the surface of the tissue section placed on a standard glass slide, and is activated by a low-power laser beam.
Brief overview of anatomy and function of different amygdala subnuclei
Anatomically, the amygdala is a complex forebrain structure composed of more than a dozen subnuclei (Pitkanen et al., 1997), such as the central, lateral, basomedial, and medial subnuclei. The lateral nucleus is the site of convergence of sensory input (Maren and Fanselow, 1996; Pitkanen et al., 1997). In general, there is a unidirectional flow of information, from lateral structures (such as the lateral and basolateral nuclei), to more medial ones (including the medial, basomedial, and central nuclei) (Pitkanen et al., 1997; Swanson and Petrovich, 1998) .
Most subnuclei, in turn, project heavily to the central nucleus, which has sparse axonal projections to other amygdaloid nuclei (Pitkanen et al., 1997).
Methods
- Experimental design
- Sample preparation
- Data analysis
- In situ hybridization
RNA was washed and concentrated three times with Microcon-100 columns as described above and collected in 9)1l water. Chloroform:Isoamyl acetate RNA was washed three times and concentrated with Microcon-100 columns as described above and collected in 9.1 l water. Clean-up of RNA: The Qiagen Rneasy total RNA isolation kit was used (kathanol was added and the solution was applied to the affinity column.
The elution was reapplied to the same affinity column, followed by two washes with RPE buffer.
Results
Analytical characterization of differentially expressed genes
Additionally, I checked whether genes identified as enriched in the amygdala in the previous review had consistent mean difference values in the current study. Of these, 10 that had high mean difference values also had high mean difference values on the current screen. Notably, differential expression within the amygdala of some genes previously characterized by in situ hybridization was evident in the new data set.
To name a few, Lhx-7 had mean mean difference values of 1261.63 and 174 in the central, lateral, and medial amygdala, respectively, and was detected only in the central nucleus by in situ hybridization (not shown).
Validation of Genechip results by in situ hybridization
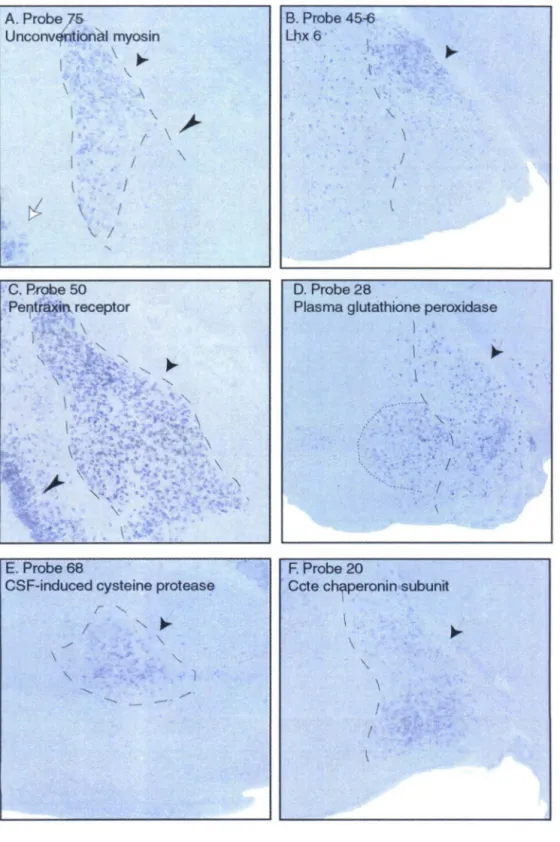
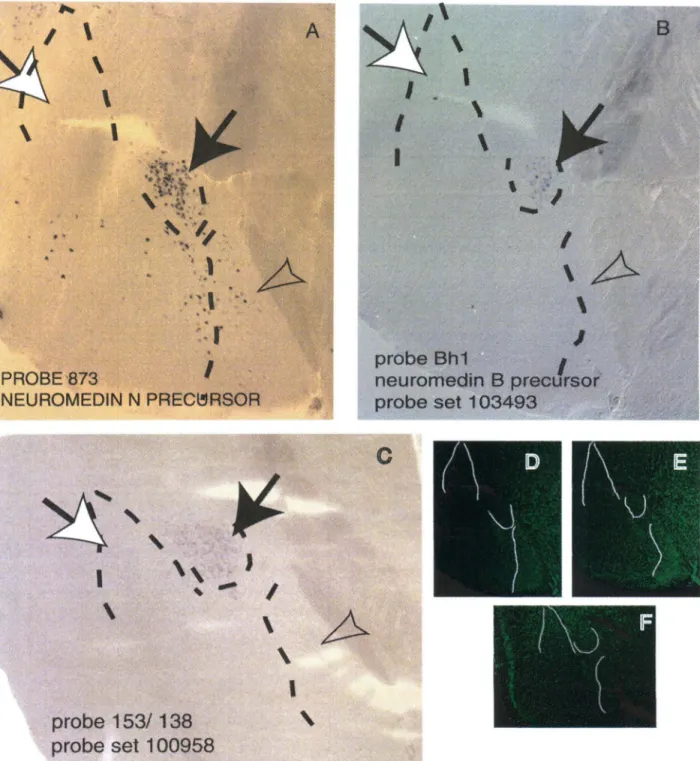
Gastrin-releasing peptide, probe 440 (Fig. 3C), was also highly enriched in the lateral nucleus (arrow) and in the basomedial nucleus (black arrowhead). Gastrin-releasing peptide, thyrotropin-releasing hormone receptor, and prolactin receptor were also expressed in the hypothalamus (not shown). Counterstaining was performed on the same sections with Neurotrace, a fluorescent nuclear stain to delineate subnuclei (Panels D, E, and F, dotted lines).
Discussion
Methodological considerations
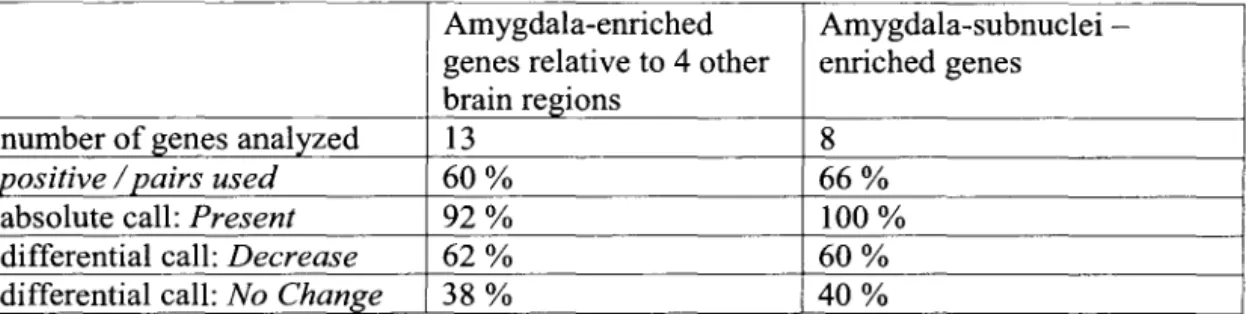
However, most genes did not appear to be enriched in the other two medial amygdala replicates, and therefore were not seriously considered as good candidates for subsequent in situ hybridization experiments. I will illustrate this claim with the behavior of genes characterized by in situ hybridization in the LCM screen, which also showed higher levels of expression in the amygdala compared to the other four brain regions previously studied (not shown). The average ratio of mean difference values in the amygdala to the other four regions was about 1.6 in these 7 cases.).
Furthermore, previous microarray measurements assumed that 4 of these 7 genes were absent from the amygdala.
When is a differentially expressed gene a good candidate for in situ
Consistent with our previous study (Zirlinger et al., 2001), these results also indicate that in situ hybridization is essential to confirm microarray data. In contrast, I observed no change in expression by in situ hybridization in genes that had a differential up- or down-regulation call (not shown). Otherwise, if a gene shows high mean difference values and similar pas and neg values in all regions, it is unlikely that relative differences in expression levels could be assessed by in situ hybridization.
I took these concepts into account when visually inspecting the genes identified with the custom program to further narrow down the number of candidate genes for in situ hybridization validation experiments.
Identity of selected genes differentially expressed in the amygdala
Others also report expression of NTS 1 in the hippocampus, amygdala and cortex, and more moderately in the thalamus (Pettibone et al., 2002). There are two bombesin-like peptides in mammals: NMB, related to amphibian ranatensin, and gastrin-releasing peptide (Merali et al., 1999) (see below). NMB is expressed in the lungs and gastrointestinal tract, where it is released in response to food intake to inhibit further food intake (Merali et al., 1999).
Interestingly, differential expression of retinoic acid-related metabolizing enzymes during mouse development was assessed (Abu-Abed et al., 2002).
On the use ofLCM and DNA microarray technologies to identify
The number of genes on subarray U74v2A Present based on the Affymetrix software and with mean difference (avg. difference) values greater than 200 are indicated in the first column. The number of genes that were either Absent or had mean difference values lower than 200 are indicated in the second column. The genes with mean difference values greater than 200, which were present in all three subnuclei, are indicated in the first row.
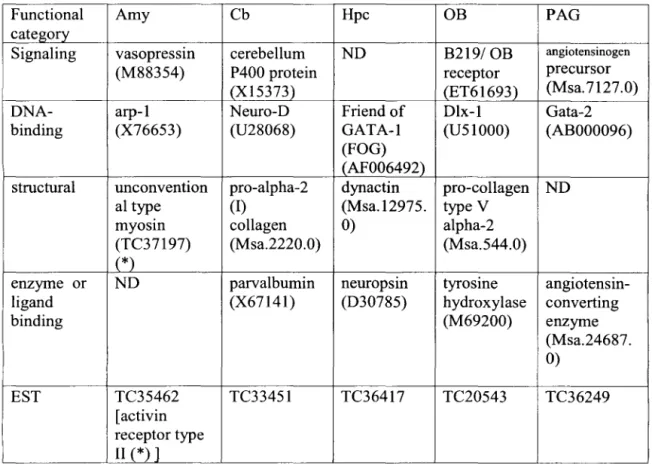
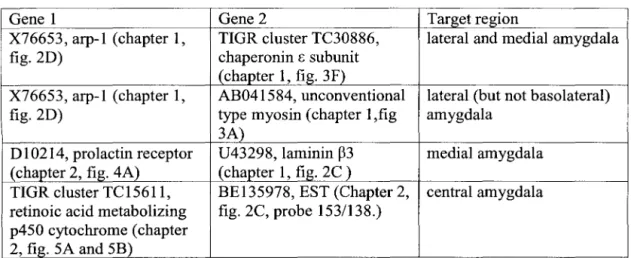
Genbank accessions or TIGR identifiers of pairs of genes showing overlapping expression in the target regions are indicated.
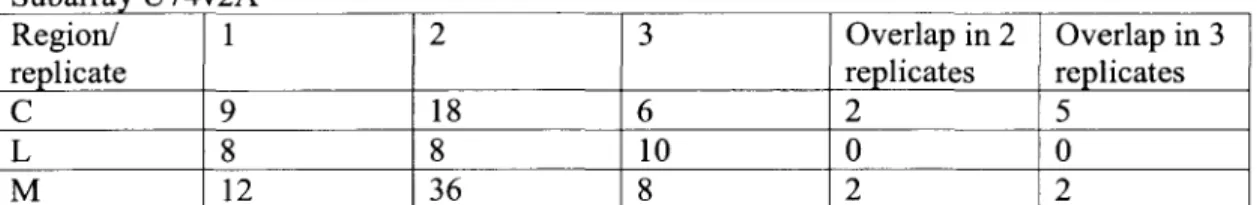
Figure legends
The medial nucleus is indicated by a black arrow, the lateral nucleus by a white arrow, and the central nucleus by an arrowhead. The in situ hybridization signal in the lateral and central amygdala was obtained with probe TC15611, derived from an EST. In situ hybridization with retinoic acid-metabolizing cytochrome p450 probe shows the same signal as in (A).
ANALYSIS OF QUANTITATIVE GENE EXPRESSION DATA
Introduction
Neural crest cells are a transient cellular population, induced at the dorsolateral edge of the neural plate, from where they delaminate and migrate along specific routes to many destinations in the vertebrate embryo. Numerous experiments suggested that at least some neural crest cells are pleuripotent (Bronner-Fraser and Fraser, 1988; Bronner-Fraser and Fraser, 1989; Serbedzija et al., 1994), generating sensory and sympathetic neurons and their associated glia. I have used a genetic system to permanently label a subpopulation of neural crest cells marked by the expression of the proneural gene Neurogenin-2.
Transient expression of the bHLH factor Neurogenin-2 marks an overpopulation of neural crest cells biased toward a sensory but not neuronal fate.
Transient expression of the bHLHfactor Neurogenin-2 marks a subpopulation
- Material and methods
- Overview of the genetic strategy employed
- Results
- Discussion
- Figure legends
- Experiments with Ngn2-CreER TM adult mice
Because activation of the reporter gene involves a cell-heritable DNA rearrangement event, lacZ expression will persist in the progeny of cells that transiently express Ngn2 ( Fig. 1C ). We next asked whether there was any bias in the differentiation of Ngn2-expressing cells to neuronal vs. By E12.5, there are very few lacZ+ cells in the dorsal neural tube and numerous labeled cells in DRG (white arrowhead) and dorsal roots (black arrowhead); contrast this with the pattern seen using the conventional Ngn2lacZ reporter (E).
The magnification in (G) is slightly higher than in (F). H, I) Ngn2-expressing NCCs generate BF ABP+ glial cells in the dorsal root (large arrow) and peripheral nerve (H, small arrows) as well as in the DRG.

A technological revolution: microarrays and biological research
I chose to study neural diversity to uncover the molecular details of the nervous system. Several conclusions can be drawn from this work, some of which can be better appreciated if we put it in perspective.
Application of micro array technology to the study of the brain
However, as sequence databases are continually expanding, the representation of genes (and predicted genes) on updated oligonucleotide arrays may be suitable enough for conclusive molecular analyzes of brain regions.
Molecular signature of brain regions
Data analysis
From molecular boundaries to functional specialization
Overall, the use of molecular markers to delineate specific brain regions opens the possibility to study the functional architecture of the brain at an unprecedented level of resolution. Specifically, the regionally enriched genes obtained by these techniques could potentially provide direct tools to experimentally manipulate and dissect specific brain functions, as discussed below, using transgenic technologies.
Immediate applications of these studies
- Identification of markers for transgenic studies
- Analysis of regulatory regions
In principle, one could build a Venn diagram of gene expression in the brain and take advantage of transcripts that have overlapping expression domains in the region of interest to design transgenic mice. Microarray data can be invaluable for this analysis, as it can potentially provide information about all transcripts expressed in each brain region. Regulatory sequences responsible for the control of gene expression during cell cycle progression or light-dark phases were identified in each case, respectively.
The identification of specific regulatory regions of the brain nucleus would predict the identification of further genes carrying the same regulatory regions that may be expressed in the same area.
Mechanisms of generation of diverse neurons and glia
In mice, it is necessary to analyze larger flanking regions, as enhancer sequences can be located several tens of kilobases upstream (or downstream) of the site of transcription initiation (Lewin, 2000). Thus, it appears that common aspects of neuronal subtype identity (i.e., sensory vs. autonomic) can be acquired when progenitor cells are still capable of generating both neurons and glia.
Long-term Applications
Vasopressin-immunoreactive cells in the dorsomedial hypothalamic region, medial amygdaloid nucleus, and locus coeruleus in the rat. Localization of transcripts of the cognate nuclear orphan receptors Coup-TF-I and Arp-1 in the adult mouse brain. Detection of prolactin receptor mRNA in the corpus striatum and substantia nigra of the rat.
Organization of intra-amygdaloid circuits in the rat: a new framework for understanding amygdala functions.