MENGGUNAKAN MIKROKONTROLER VIA IOT DI RUANG TUNGGU BANDARA
TUGAS AKHIR
Oleh :
RIZA AGUNG FIRMANSYAH NIT : 30118021
PROGRAM STUDI DIPLOMA III TEKNIK LISTRIK BANDAR UDARA POLITEKNIK PENERBANGAN SURABAYA
2021
i
RANCANGAN KONTROL DAN MONITORING AIR QUALITY MENGGUNAKAN MIKROKONTROLER VIA IOT DI RUANG
TUNGGU BANDARA
Diajukan sebagai Syarat Menempuh Tugas Akhir Pada Program Studi Diploma III Teknik Listrik Bandar Udara
Oleh :
RIZA AGUNG FIRMANSYAH NIT : 30118021
PROGRAM STUDI DIPLOMA III TEKNIK LISTRIK BANDAR UDARA POLITEKNIK PENERBANGAN SURABAYA
2021
LEMBAR PERSETUJUAN
RANCANGAN KONTROL DAN MONITORING AIR QUALITY MENGGUNAKAN MIKROKONTROLER VIA IOT DI RUANG TUNGGU
BANDARA Oleh :
RIZA AGUNG FIRMANSYAH NIT. 30118021
Disetujui untuk diujikan pada : Surabaya, 1 Agustus 2021
Pembimbing I :RIFDIAN I.S., ST, MM,MT …………...
NIP. 19810629 200912 1 002
Pembimbing II :Ir. BAMBANG WASITO, MT …………..
NIP. 19580706 199103 1 002
PROGRAM STUDI TEKNIK LISTRIK BANDAR UDARA POLITEKNIK PENERBANGAN SURABAYA
2021
LEMBAR PENGESAHAN
RANCANGAN KONTROL DAN MONITORING AIR QUALITY MENGGUNAKAN MIKROKONTROLER VIA IOT DI RUANG TUNGGU
BANDARA Oleh :
Riza Agung Firmansyah NIT. 30118021
Telah dipertahankan dan dinyatakan lulus pada Ujian Tugas Akhir Program Pendidikan Diploma 3 Teknik Listrik Bandara
Politeknik Penerbangan Surabaya Pada tanggal :1 Agustus 2021
Panitia Penguji :
1. Ketua : FIQQIH FAIZAH, ST, MT ………
NIP. 19850709 200912 2 005
2. Sekretaris : SUWITO, ST,.MT ………
NIP.19810105 200501 1 004
3. Anggota : RIFDIAN I.S., ST, MM,MT ...
NIP. 19810629 200912 1 002
Ketua Program Studi D3 Teknik Listrik Bandara
RIFDIAN I.S., ST, MM,MT NIP. 19810629 200912 1 002
ABSTRAK
RANCANGAN KONTROL DAN MONITORING AIR QUALITY MENGGUNAKAN MIKROKONTROLER VIA IOT DI RUANG TUNGGU
BANDARA
Oleh:
Riza Agung Firmansyah 30118021
Air Quality merupakan unsur alam yang perlu di jaga serta di pantau karena melalui udara bisa mengandung gas berbahaya maupun bakteri yang dapat mengganggu kesehatan. Untuk mempertahankan Air Quality ada beberapa sistem yaitu melakukan kontrol terhadap udara dengan cara sistem Filtrasi dan juga Monitoring sebagai sumber informasi. Rancangan ini di fungsikan untuk menjaga kualitas udara di ruang tunggu secara otomatis,serta melakukan pemantauan udara melalui IoT.
Rancangan ini menggunakan 2 buah sensor jika salah satu sensor mendeteksi debu atau gas maka sensor akan mengeluarkan tegangan. Nilai tegangan output dari sensor ini dihubungkan dengan mikrokontroler Arduino Nano.
Pada saat mikrokontroler menerima input, mikrokontroler akan mengaktifkan pin output untuk mengaktifkan Led sebagai indikator adanya gas atau debu dalam udara, serta mengaktifkan fan sebagai sistem filtrasi udara.Fan tersebut bekerja secara otomatis. Sensor Debu sebagai sensor pembaca partikel debu di udara jika partikel terbaca lebih dari 150 μ/g, maka otomatisasi pada fan bekerja. Informasi tentang kondisi on atau off Fan, serta jumlah partikel debu yang dideteksi sensor Debu dapat diketahui user melalui Blynk IoT.
Sistem ini sangat berguna untuk mengetahui kualitas udara di ruang tunggu.
Dan efektif dalam mendeteksi adanya gas maupun debu dalam udara. Serta sistem filtrasi udara dapat bekerja secara otomatis, apabila pembacaan debu di atas 150 μ/g yang terhadap dalam udara. Serta memantau kondisi on atau off Fan,,sensor Gas dan pembacaan presentase sensor Debu via internet dapat diakses dengan baik oleh user melalui Smartphone.
Kata Kunci: Air Quality, Sensor Debu, sensor Gas, Smartphone ,Blynk IoT dan Arduino Nano
ABSTRACT
DESIGN OF AIR QUALITY CONTROL AND MONITORING USING MICROCONTROLLER VIA IOT IN AIRPORT WAITING ROOMS
By:
Riza Agung Firmansyah 30118021
Air Quality is a natural element that needs to be maintained and monitored because through the air it can contain harmful gases and bacteria that can interfere with health. To maintain Air Quality, there are several systems, namely controlling the air by means of a Filtration system and also Monitoring as a source of information. This design is used to automatically maintain air quality in the waiting room, as well as carry out air monitoring via IoT.
This design uses 2 sensors, if one sensor detects dust or gas, the sensor will issue a voltage. The output voltage value of this sensor is connected to the Arduino Nano microcontroller. When the microcontroller receives input, the microcontroller will activate the output pin to activate the LED as an indicator of the presence of gas or dust in the air, and activate the fan as an air filtration system.
The fan works automatically. Dust Sensor as a sensor for reading dust particles in the air if the particles read more than 150 μ/g, then the automation on the fan works.
Information about the on or off condition of the Fan, as well as the number of dust particles detected by the Dust sensor can be known by the user through Blynk IoT.
This system is very useful for knowing the air quality in the waiting room.
And effective in detecting the presence of gas and dust in the air. And the air filtration system can work automatically, if the dust reading is above 150 μ /g which is in the air. As well as monitoring on or off Fan conditions, Gas sensors and readings of Dust sensor percentages via the internet can be accessed properly by users via Smartphones.
Key Words: Air Quality, Gas Sensor, Dust sensor , Smartphone ,Blynk IoT and Arduino Nano
PERNYATAAN KEASLIAN DAN HAK CIPTA
Saya yang bertanda tangan di bawah ini :
Nama : Riza Agung Firmansyah
NIT : 30118021
Program Studi : D-III Teknik Listrik Bandar Udara
Judul Tugas Akhir : Rancangan Kontrol Dan Monitoring Air Quality Menggunakan Mikrokontroler Via Iot Di Ruang Tunggu Bandara
dengan ini menyatakan bahwa :
1. Tugas Akhir ini merupakan karya asli dan belum pernah diajukan untuk mendapatkan gelar akademik, baik di Politeknik Penerbangan Surabaya maupun di Perguruan Tinggi lain, serta dipublikasikan, kecuali secara tertulis dengan jelas dicantumkan sebagai acuan dalam naskah dengan disebutkan nama pengarang dan dicantumkan dalam daftar pustaka.
2. Demi pengembangan ilmu pengetahuan, menyetujui untuk memberikan Hak Bebas Royalti Non Eksklusif (Non-Exclusive Royalty-Free Right) kepada Politeknik Penerbangan Surabaya beserta perangkat yang ada (jika diperlukan). Dengan hak ini, Politeknik Penerbangan Surabaya berhak menyimpan, mengalihmedia/formatkan, mengelola dalam bentuk pangkalan data (database), merawat, dan mempublikasikan tugas akhir saya dengan tetap mencantumkan nama saya sebagai penulis/pencipta dan sebagai pemilik Hak Cipta.
Demikian pernyataan ini saya buat dengan sebenarnya. Apabila di kemudian hari terdapat penyimpangan dan ketidakbenaran, maka saya bersedia menerima sanksi akademik berupa pencabutan gelar yang telah diperoleh, serta sanksi lainnya sesuai dengan norma yang berlaku di Politeknik Penerbangan Surabaya.
Surabaya, 1 Juli 2021 Yang membuat pernyataan
Riza Agung Firmansyah 30118021
MOTTO DAN PERSEMBAHAN
TERUSLAH
BERUSAHA
BERDOA DAN
BERSABAR
KATA PENGANTAR
Puji syukur kami panjatkan kepada Tuhan Yang Maha Esa, karena berkat limpahan rahmat dan hidayah Nya, Tugas Akhir yang berjudul “RANCANGAN
KONTROL DAN MONITORING AIR QUALITY MENGGUNAKAN
MIKROKONTROLER VIA IOT DI RUANG TUNGGU BANDARA” ini dapat diselesaikan dengan baik.
Penyusunan Tugas Akhir ini dimaksudkan sebagai salah satu syarat menyelesaikan pendidikan di Politeknik Penerbangan Surabaya dan memperoleh gelar Ahli Madya (A. Md).
Ucapan terima kasih kami sampaikan kepada segenap pihak yang telah membantu selama proses penyusunan Tugas Akhir ini, terutama kepada :
1. Tuhan Yang Maha Esa.
2. Bapak M Andra Aditiyawarman ,ST,MT selaku Direktur Politeknik Penerbangan Surabaya.
3. Bapak Rifdian I.S., ST, MM,MT. selaku Kepala Program Diklat Teknik Listrik Bandara di Politeknik Penerbangan Surabaya.
4. Bapak Rifdian I.S., ST, MM,MT selaku pembimbing I yang selalu memberi semangat, pemahaman, ilmu, dan dukungan moril dalam penyusunan Tugas Akhir.
5. Bapak Ir. Bambang Wasito, MT selaku pembimbing II yang senantiasa memberi semangat, pemahaman, ilmu, dan dukungan moril dalam penyusunan Tugas Akhir.
6. Orang tua, serta adik-adik yang saya sayangi atas doa, semangat, dukungan moril dan material yang diberikan hingga terselesaikan Tugas Akhir ini.
7. Seluruh dosen dan civitas akademi Prodi D-III Teknik Listrik Bandar Udara Politeknik Penerbangan Surabaya yang telah membantu baik secara langsung maupun tidak langsung
8. Teman–teman course Teknik Listrik Bandar Udara XIII, atas kebersamaan dan kerjasamanya di segala kondisi.
9. Teman-teman seangkatan dan adik-adik kelas, atas dukungan yang diberikan.
Penulis juga menyadari bahwa penulisan tugas akhir ini masih jauh dari sempurna. Oleh karena itu, penulis mengharapkan kritik dan saran membangun guna penyempuranaan rancangan ini kedepannya. Dengan segala kerendahan hati, penulis mempersembahkan Tugas Akhir ini, semoga bermanfaat bagi pembaca dan penulis untuk dunia penerbangan pada umumnya. Terima kasih.
Surabaya, 4 Agustus 2021
Penulis
DAFTAR ISI
HALAMAN JUDUL... i
LEMBAR PERSETUJUAN ... ii
LEMBAR PENGESAHAN ... iii
ABSTRAK ... iv
ABSTRACT... v
PERNYATAAN KEASLIAN DAN HAK CIPTA ... vi
MOTTO DAN PERSEMBAHAN ... vii
KATA PENGANTAR ... viii
DAFTAR ISI... ix
DAFTAR GAMBAR ... xi
DAFTAR TABEL ... xiii
BAB 1 PENDAHULUAN ... 1
1.1 Latar Belakang Masalah ... 1
1.2 Rumusan Masalah ... 3
1.3 Batasan masalah ... 3
1.4 Tujuan Penelitian ... 4
1.5 Manfaat Penelitian ... 4
1.6 Sistematika Penulisan ... 4
BAB 2 LANDASAN TEORI ... 6
2.1 Teori Penunjang ... 6
2.1.1 Terminal Bandara... 6
2.1.2 Arduino Nano ... 8
2.1.3 Sensor GP2Y1010AU0F ... 9
2.1.4 Sensor Gas MQ2 ... 10
2.1.5 DC FAN ... 10
2.1.6 Relay module ... 12
2.1.7 Filter ... 12
2.1.8 Smartphone ... 13
2.1.9 Internet of Things ... 14
2.1.10 Index Kualitas Udara ... 15
2.2 Kajian Penelitian Terdahulu Yang Relevan... 17
BAB 3 METODE PENELITIAN ... 18
3.1 Desain Penelitian ... 18
3.2 Perancangan Alat ... 19
3.2.1 Desain Alat ... 19
3.2.2 Cara Kerja Alat... 19
3.2.3 Komponen Alat ... 21
3.2.3.1 Perangkat Keras ... 21
3.2.3.2 Perangkat Lunak ... 27
3.3 Teknik Pengujian ... 30
3.3.1 Pengujian Pada Catu Daya ... 30
3.3.2 Pengujian pada Sensor Gas ... 30
3.3.3 Pengujian pada Sensor Debu ... 31
3.3.4 Pengujian pada Kipas ... 31
3.4 Teknik Analisis Data ... 32
3.5 Tempat dan Waktu Penelitian ... 32
BAB 4 HASIL DAN PEMBAHASAN ... 33
4.1 Hasil Penelitan ... 33
4.1.1 Hasil Pengujian pada Power Supply ... 33
4.1.2 Hasil Pengujian Arduino Nano ... 35
4.1.3 Hasil Pengujian Sensor Gas ... 36
4.1.4 Hasil Pengujian Sensor Debu ... 38
4.1.5 Hasil Pengujian Aplikasi Blynk IoT ... 41
BAB 5 KESIMPULAN DAN SARAN ... 43
5.1 Kesimpulan ... 43
5.2 Saran ... 43
DAFTAR PUSTAKA ... 43 LAMPIRAN
DAFTAR RIWAYAT HIDUP
DAFTAR GAMBAR
Gambar 2.1 Terminal Bandara ... 6
Gambar 2.2 Arduino Nano ... 8
Gambar 2.3 Sensor GP2Y1010U0F ... 9
Gambar 2.4 Semsor MQ9 ... 10
Gambar 2.5 DC Fan ... 11
Gambar 2.6 Modul Relay ... 12
Gambar 2.7 Filter ... 13
Gambar 2.8 Smartphone ... 14
Gambar 2.9 Konsep IoT ... 15
Gambar 3.1 Diagram Alur Desain Penelitian ... 18
Gambar 3.2 Diagram Blok Desain penelitian ... 19
Gambar 3.3 Flowchart ... 20
Gambar 3.4 Arduino Terpasang ... 21
Gambar 3.5 Sensor Debu ... 21
Gambar 3.6 Sensor Gas ... 22
Gambar 3.7 Fan Terpasang ... 22
Gambar 3.8 Relay... 23
Gambar 3.9 Smartphone Blynk ... 23
Gambar 3.10 Wiring Deteksi gas dan debu ... 24
Gambar 3.11 Layout Alat ... 25
Gambar 3.12 Flowchart Alat ... 26
Gambar 3.13 Void Setup ... 27
Gambar 3.14 Posisi Pin Arduino ... 27
Gambar 3.15 Void Loop ... 28
Gambar 3.16 Setting Data Blynk ... 28
Gambar 3.17 Fan dan LED... 29
Gambar 4.1 Pengujian Catu Daya ... 32
Gambar 4.2 Pengujian Arduino Nano ... 34
Gambar 4.3 Pengujian Sensor Gas ... 35
Gambar 4.4 Pengujian Sensor Debu ... 37
Gambar 4.5 Pengujian Fan DC ... 39
Gambar 4.6 Login menu Blynk ... 40
Gambar 4.7 Koneksi Arduino Dengan Blynk ... 41
Gambar 4.8 Tombol Play pada Blynk ... 41
Gambar 4.9 Aplikasi Blynk Berjalan ... 41
DAFTAR TABEL
Tabel 2.1 Speksifikasi Terminal Bandara ... 8
Tabel 2.2 Speksifikasi Arduino Nano ... 9
Tabel 2.3 Speksifikasi Fan ... 11
Tabel 4.1 Hasil Pengujian Power Supply ... 33
Tabel 4.2 Hasil Pengujian Arduino Nano ... 34
Tabel 4.3 Pengujian Jarak Pembacaan Sensor Gas ... 35
Tabel 4.4 Jenis Jenis Gas MQ2 ... 37
Tabel 4.5 Hasil Pengujian Sensor Debu ... 38
Tabel 4.6 Hasil Pengujian Fan DC ... 39
DA
FTAR PUSTAKA
[1] Baehaqi,P N.(2017).Rancang Bangun Sistem Pemantau Kualitas Udara Menggunakan Sensor GP2Y1010AU0F dan MQ-7 Berbasis Web di Pelabuhan Tanjung
Priok.Jakarta,Indonesia:Universitas Negeri Jakarta
[2] Hutangalung,A.(2016). Alat Ukur Kualitas Udara Berbasis Mikrokontroler Arduino Uno.Medan,Indonesia :Universitas Sumatera Utara
[3] Pavlenski,M.(2019).https://create.arduino.cc/projecthub/mircemk/diy-air-quality-monitor-with- sharp-gp2y1010au0f-sensor-7b0262
[4] Syafrial,Agus.(2019). Prototype Smart Parking Stand Menggunakan Konsep Internet of Things Berbasis Mikrokontroler di apron bandar udara.Surabaya:Politeknik Penerbangan
Surabaya
[5] Zulias,J.(2011). bahasa-pemrograman-arduino.http://blog.famosastudio.com/2011/06/tutorial/
tutorial-singkat-bahasa-pemrograman-arduino/82
[6] Junaidy,B.(2019). Pendeteksi Dan Penetralisir Debu Dan Asap Pada Udara Menggunakan Sensor GP2Y1010U0F dan MQ-2 Berbasis Arduino Uno R3 Atmega
328p.Medan,Indonesia:Universitas Medan
#include <ESP8266_Lib.h>
#include <BlynkSimpleShieldEsp8266.h>
#include <SoftwareSerial.h>
#define BLYNK_PRINT Serial
char auth[] = "MfuKmdiJsiCjlRtTd_zV-Kl-5vpizt2P";
char ssid[] = "AP";
char pass[] = "123456789";
#define EspSerial Serial
#define ESP8266_BAUD 115200 ESP8266 wifi(&Serial);
int pin_debu = A0;
int pin_gas = 6;
int ledPower_debu = 7;
int led = 13;
int fan = 5;
int gas_state;
int samplingTime = 280;
int deltaTime = 40;
int sleepTime = 9680;
float voMeasured = 0;
float calcVoltage = 0;
float dustDensity = 0;
void setup() {
Serial.begin(ESP8266_BAUD);
pinMode(ledPower_debu,OUTPUT);
pinMode(led,OUTPUT);
pinMode(fan,OUTPUT);
pinMode(pin_gas,INPUT);
Blynk.begin(auth, wifi, ssid, pass);
}
void loop() {
Blynk.run();
digitalWrite(ledPower_debu,LOW);
delayMicroseconds(samplingTime);
voMeasured = analogRead(pin_debu);
delayMicroseconds(deltaTime);
digitalWrite(ledPower_debu,HIGH);
delayMicroseconds(sleepTime);
calcVoltage = voMeasured * (5.0 / 1024.0);
dustDensity = 170 * calcVoltage - 0.1;
Blynk.virtualWrite(V0, dustDensity);
gas_state = digitalRead(pin_gas);
if(gas_state == 0) {
Blynk.virtualWrite(V1, "Intensitas Gas Tinggi!");
}
if(gas_state == 1) {
Blynk.virtualWrite(V1, "Intensitas Gas Aman");
N
if(dustDensity >=150.00) {
Blynk.virtualWrite(V2, "Intensitas Debu Tinggi!");
}
if(dustDensity < 150.00) {
Blynk.virtualWrite(V2, "Intensitas Debu Aman");
}
if(gas_state == 0 || dustDensity >= 150.00) {
digitalWrite(led,HIGH);
digitalWrite(fan,HIGH);
} else {
digitalWrite(led,LOW);
digitalWrite(fan,LOW);
}
delay(1000);
LAMPIRAN C. RANCANGAN ANGGARAN BIAYA
Standar Operasional Prosedur (SOP)
Tata Cara Penggunaan Alat:
1. Colokkan power ke Alat, Pasang Adaptor ke stopkontak kemudian pastikan output adaptor terkoneksi pada alat detektor.
2. Hubungkan jaringan wifi dengan smartphone, Nyalakan hotspot pada smartphone dan tunggu hingga aplikasi blynk terhubung.
3. Letakkan alat detektor pada lokasi yang strategis, Posisi dimana sering terdapat kerumunan.
4. Pantau Alat detektor melaui Aplikasi, Pada aplikasi akan muncul indikator gas dan Debu.
5. Alat Bekerja Otomatis, Alat akan bekerja apabila ada debu dan gas
terdeteksi secara otomatis
Arduino Nano
(V2.3)
User Manual
Released under the Creative Commons Attribution Share-Alike 2.5 License http://creativecommons.org/licenses/by-sa/2.5/
More information:
www.arduino.cc Rev. 2.3
Arduino Nano Pin Layout
D1/TX (1) (30) VIN
D0/RX (2) (29) GND
RESET (3) (28) RESET
GND (4) (27) +5V
D2 (5) (26) A0
D3 (6) (25) A1
D4 (7) (24) A2
D5 (8) (23) A3
D6 (9) (22) A4
D7 (10) (21) A5
D8 (11) (20) A6
D9 (12) (19) A7
D10 (13) (18) AREF
D11 (14) (17) 3V3
D12 (15) (16) D13
Pin No. Name Type Description
1-2, 5-16 D0-D13 I/O Digital input/output port 0 to 13 3, 28 RESET Input Reset (active low)
4, 29 GND PWR Supply ground
17 3V3 Output +3.3V output (from FTDI)
18 AREF Input ADC reference
19-26 A7-A0 Input Analog input channel 0 to 7
27 +5V Output or
Input
+5V output (from on-board regulator) or +5V (input from external power supply)
30 VIN PWR Supply voltage
Arduino Nano Mechanical Drawing
Arduino Nano Bill of Material Item
Number
Qty. Ref. Dest. Description Mfg. P/N MFG Vendor P/N Vendo
r
1 5 C1,C3,C4,C7,C9
Capacitor, 0.1uF 50V 10%
Ceramic X7R 0805 C0805C104K5RACTU Kemet 80"C0805C104K5R Mouser
2 3 C2,C8,C10
Capacitor, 4.7uF 10V 10%
Tantalum Case A T491A475K010AT Kemet 80"T491A475K010 Mouser
3 2 C5,C6
Capacitor, 18pF 50V 5%
Ceramic NOP/COG 0805 C0805C180J5GACTU Kemet 80"C0805C180J5G Mouser
4 1 D1 Diode, Schottky 0.5A 20V MBR0520LT1G ONSemi 863"MBR0520LT1G Mouser
5 1 J1,J2 Headers, 36PS 1 Row 68000"136HLF FCI 649"68000"136HLF Mouser
6 1 J4
Connector, Mini"B Recept
Rt. Angle 67503"1020 Molex 538"67503"1020 Mouser
7 1 J5 Headers, 72PS 2 Rows 67996"272HLF FCI 649"67996"272HLF Mouser
8 1 LD1
LED, Super Bright RED 100mcd 640nm 120degree
0805 APT2012SRCPRV Kingbright 604"APT2012SRCPRV Mouser
9 1 LD2
LED, Super Bright GREEN 50mcd 570nm 110degree
0805 APHCM2012CGCK"F01 Kingbright 604"APHCM2012CGCK Mouser
10 1 LD3
LED, Super Bright ORANGE 160mcd 601nm 110degree
0805 APHCM2012SECK"F01 Kingbright 04"APHCM2012SECK Mouser
11 1 LD4
LED, Super Bright BLUE 80mcd 470nm 110degree
0805 LTST"C170TBKT Lite"On Inc 160"1579"1"ND Digikey
12 1 R1
Resistor Pack, 1K +/"5%
62.5mW 4RES SMD YC164"JR"071KL Yageo YC164J"1.0KCT"ND Digikey
13 1 R2
Resistor Pack, 680 +/"5%
62.5mW 4RES SMD YC164"JR"07680RL Yageo YC164J"680CT"ND Digikey
14 1 SW1
Switch, Momentary Tact
SPST 150gf 3.0x2.5mm B3U"1000P Omron SW1020CT"ND Digikey
15 1 U1
IC, Microcontroller RISC 16kB Flash, 0.5kB EEPROM,
23 I/O Pins ATmega168"20AU Atmel 556"ATMEGA168"20AU Mouser
16 1 U2
IC, USB to SERIAL UART 28
Pins SSOP FT232RL FTDI 895"FT232RL Mouser
17 1 U3
IC, Voltage regulator 5V,
500mA SOT"223 UA78M05CDCYRG3 TI 595"UA78M05CDCYRG3 Mouser
18 1 Y1
Cystal, 16MHz +/"20ppm
HC"49/US Low Profile ABL"16.000MHZ"B2 Abracon 815"ABL"16"B2 Mouser
ARDUINO NANO SCHEMATIC
GP2Y1010AU0F
GP2Y101OAUOF Compact Optical Dust Sensor
■ Description
GP2Y1010AU0F is a dust sensor by optical sensing system.
An infrared emitting diode (IRED) and an phototran- sistor are diagonally arranged into this device.
It detects the reflected light of dust in air. Especially, it is effective to detect very fine particle like the
cigarette smoke.
In addition it can distinguish smoke from house dust by pulse pattern of output voltage.
Features
1. Compact, thin package (46.0 x 30.0 x 17.6 mm) 2. Low consumption current (Icc: MAX. 20 mA) 3. The presence of dust can be detected by the
photometry of only one pulse
4. Enable to distinguish smoke from house dust 5. Lead-free and RoHS directive compliant
■ Compliance
1. Compliant with RoHS directive (2002/85/EO)
■ Applications
1. Detecting of dust in the air.
2. Example: Air purifier, Air conditioner, Air monitor
GP2Y1010AU0F
Sheet No.: E4-A01501 EN
1 Date Dec. 1. 2006
0 SHARP Corporation
nternal schematic
■ Outline Dimensions
(Unit : mm)
Notice The content of data sheet is subject to change without prior notice.
In the absence of confirmation by device specification sheets, SHARP takes no responsibility for any defects that may occur in equipment using any SHARP devices shown in catalogs, data books, etc. Contact SHARP in order to obtain the latest device specification sheets before using any SHARP device.
GP2Y1010AU0F
Sheet No.: E4-A01501 EN 2
gT 0.15
Terminal
R2 ” R2 m
/1\ V-LED
/3\ LED /4\ S-GND
Dust
(3) R2
Hole for sensitivity
* Unspecified tolerance : + 0.3 mm.
The dimensions in parenthesis are shown for reference. Product mass : approx. 16 g
2000 2001 2002 2003 2004 2005 2006 2007 2008 2009 2010
: Die stamp marking : Ink stamp marking
1st digit 2nd digit Year of production Month of production
A.D. Mark Month Mark
0 1 1
1 2 2
2 3 3
3 4 4
4 5 5
5 6 6
6 7 7
7 8 8
8 9 9
9 10 X
0 11 Y
: : 12 Z
(Ta 25 C) Parameter Symbo
l
Rating Unit
Supply voltage V CC 0.3 to 7 V
*1 Input terminal voltage
VLED 0.3 to VCC V
Operating temperature Topr 10 to 65
C
Soldering temperature Tsol 20 to 80
C
*1 Open drain drive input
(T
a25 C, V
CC5V)
Parameter Symbo l
Conditions MIN. TYP. MAX. Unit
Sensitivity K *1 *2 *3 0.35 0.5 0.65 V/(0.1mg/m3 )
Output voltage at no dust
VOC *2 *3
0 0.9 1.5 V
Output voltage range VOH *2 *3 RL 4.7k 3.4 V LED terminal current ILED *2 LED terminal voltage
0
10 20 mA
Consumption current ICC *2 RL 11 20 mA
*1 Sensitivity is specified by the amount of output voltage change when dust density changes by 0.1 mg/m3. And the dust density for detection is a value of the density of cigarette (MILD SEVEN®) smoke measured by the digital dust monitor (P-5L2: manufactured by SHIBATA SCIENTIFIC TECHNOLOGY LTD.).
*2 Input condition is shown in Fig. 1
*3 Output sampling timing is shown in Fig. 2
Parameter Symbol Value Unit
Pulse Cycle T 10 1 ms
Pulse Width PW 0.32
0.02
ms
Operating Supply voltage
VCC 5 0.5 V
GP2Y1010AU0F
Sheet No.: E4-A01501 EN 5
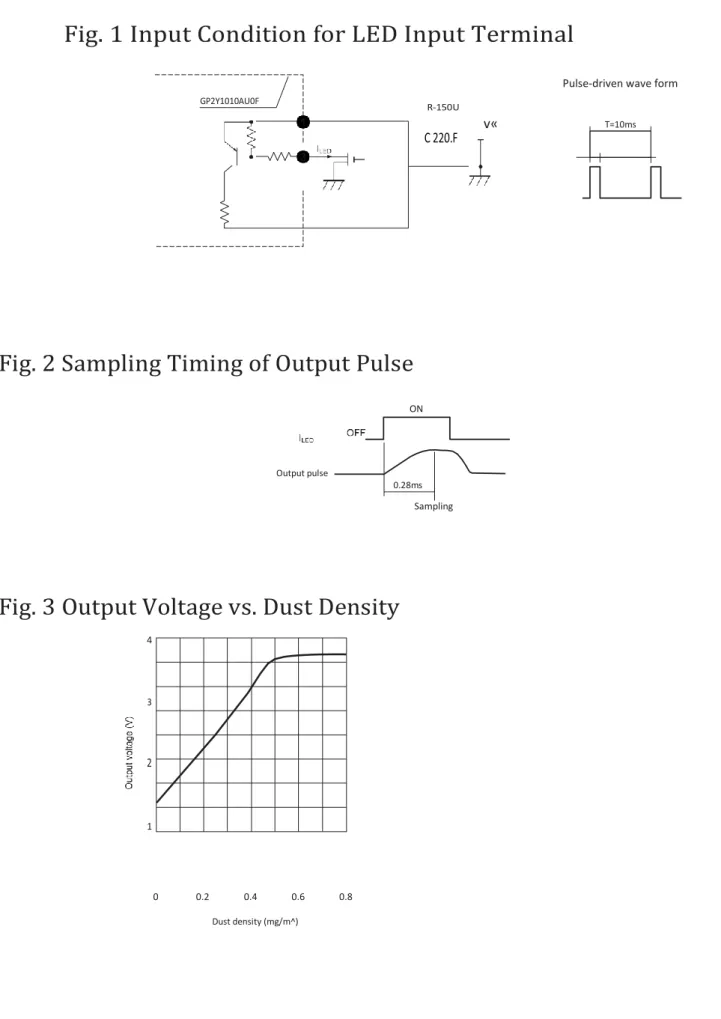
Fig. 1 Input Condition for LED Input Terminal
Pulse-driven wave form
T=10ms
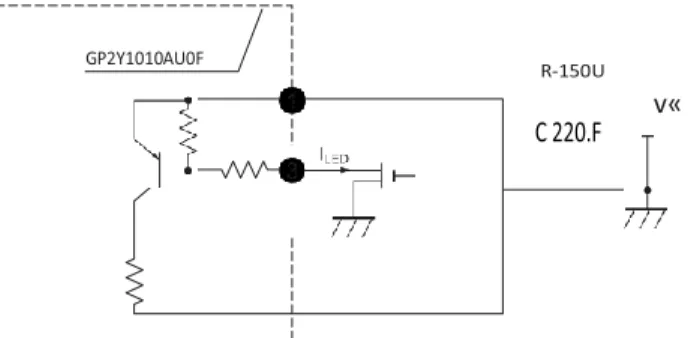
Fig. 2 Sampling Timing of Output Pulse
ON
Sampling
Fig. 3 Output Voltage vs. Dust Density
4
3
2
1
0 0.2 0.4 0.6 0.8
Dust density (mg/m^) Output pulse
0.28ms
v«
GP2Y1010AU0F
Sheet No.: E4-A01501 EN 6
Remarks : Please be aware that all data in the graph are just for reference and
are not for guarantee.
GP2Y1010AU0F
Sheet No.: E4-A01501 EN 7
• Notes
1 Connection of case and GND
Case material use conductive resin as cover case (printed model No.) and metal (test terminal side) as bottom cover. The metal case connects with GND in sensor.
2 Cleaning
Please don’t do cleaning, because there is a case that this device is not satisfied with its characteristics by cleaning.
3 Pulse input range
Please subject to recommendation as regard input condition for LED in order to keep reliability.
4 Dust adhesion
There is a case that this product does not detect the dust density correctly, since the dust adhered to the inside of the dust through hole may project into the detecting space which consist of emitter and detector light axis. Please take the structure and mechanism of the equipment into consideration to avoid the influence of adhered dust. And when the dust is adhered, please consider the maintenance such as vacuuming or blowing off the dust by air.
In addition, please pay attention to structure and placing location of the application to avoid any adhesive particle like oil, etc. to gets into the device. If it sticks to optical part, malfunction may occur.
5 Light output
In circuit designing, make allowance for the degradation of the light emitting diode output that results from long continuous operation. (50% degradation/5 years)
6 Sensitivity adjustment VR
VR for sensitivity adjustment is set up at shipping from sharp. Please do not touch the VR or Electro-optical characteristics specified on the specification will be invalid.
7 Resolution
Please do not disassemble the device such as removing tapping screw and so on. Even if the device is reassembled, it may not satisfy the specification.
8 Application to fire alarm
Please do not use this device for a fire alarm application. When using this device to application other than air purifying and equipment with air purifying function, please inform us before usage.
9 Noise influence
If the sensor is located close to noise generator (ex. Electric dust collector, etc. ), the sensor output may be affected by leaded noise. On top of that noise from power supply line also may affect the sensor output.
When desinging the system, please consider the effect from noise.
10 Vibration influence
The sensor may change its value under mechanical oscillation. Before usage, please make sure that the device works normally in the application.
11 Incident light influence
There is a case that the sensor output may be affected when outer-light comes through dust through hole on printed side. In order to avoid any influence from outer-light, please locate the printed side of sensor facing to inside of the application.
12 When inside of the sensor is moisturized, this product does not keep its proper function. Please design the application so that moisturization of the sensor does not happen.
GP2Y1010AU0F
Sheet No.: E4-A01501 EN 8
• Presence of ODC etc.
This product shall not contain the following materials.
And they are not used in the production process for this product.
Regulation substances : CFCs, Halon, Carbon tetrachloride, 1.1.1-TrichIoroethane (Methylchloroform) Specific brominated flame retardants such as the PBB and PBDE are not used in this product at all.
This product shall not contain the following materials banned in the RoHS Directive (2002/65/EO).
• Lead, Mercury, Cadmium, Hexavalent chromium, Polybrominated biphenyls (PBB), Polybrominated diphenyl ethers (PBDE).
GP2Y1010AU0F
Sheet No.: E4-A01501 EN 9
■ Packing Specification
Product trays (5 trays/case)
Connector Product
(B) Packing
case
Packing tape
number
Inspection date PACKING METHOD
1. Each tray holds 50 pieces. Packing methods are shown in (A).
2. Each box holds 5 trays. Pads are added to top (B).
3. The box is sealed with packing tape. (C) shows the location of the Model number, Quantity, and Inspection date.
4. Weight is approximately 5.6 kg
The circuit application examples in this publication are provided to explain representative applications of SHARP devices and are not intended to guarantee any circuit design or license any intellectual property rights. SHARP takes no responsibility for any problems related to any intellectual property right of a third party resulting from the use of SHARP's devices.
Contact SHARP in order to obtain the latest device specification sheets before using any SHARP device.
SHARP reserves the right to make changes in the spec- ifications, characteristics, data, materials, structure, and other contents described herein at any time without no- tice in order to improve design or reliability. Manufactur- ing locations are also subject to change without notice.
Observe the following points when using any devices in this publication. SHARP takes no responsibility for damage caused by improper use of the devices which does not meet the conditions and absolute maximum ratings to be used specified in the relevant specification sheet nor meet the following conditions:
(i) The devices in this publication are designed for use in general electronic equipment designs such as:
--- Personal computers
--- Office automation equipment
--- Telecommunication equipment [terminal]
--- Test and measurement equipment --- Industrial control
--- Audio visual equipment --- Consumer electronics
(ii) Measures such as fail-safe function and redundant design should be taken to ensure reliability and safety when SHARP devices are used for or in connection
Sheet No.: E4-A01501 EN 11
GP2Y1010AU0F
with equipment that requires higher reliability such as:
--- Transportation control and safety equipment (i.e., aircraft, trains, automobiles, etc. ) --- Traffic signals
--- Gas leakage sensor breakers --- Alarm equipment
--- Various safety devices, etc.
(iii) SHARP devices shall not be used for or in connec- tion with equipment that requires an extremely high level of reliability and safety such as:
--- Space applications
--- Telecommunication equipment [trunk lines]
--- Nuclear power control equipment
--- Medical and other life support equipment (e.g., scuba).
If the SHARP devices listed in this publication fall within the scope of strategic products described in the Foreign Exchange and Foreign Trade Law of Japan, it is necessary to obtain approval to export such SHARP devices.
This publication is the proprietary product of SHARP and is copyrighted, with all rights reserved. Under the copyright laws, no part of this publication may be re- produced or transmitted in any form or by any means, electronic or mechanical, for any purpose, in whole or in part, without the express written permission of SHARP. Express written permission is also required before any use of this publication may be made by a third party.
Contact and consult with a SHARP representative if there are any questions about the contents of this publi- cation.
FEATURES
Wide detecting scope Fast response and High sensitivity Stable and long life Simple drive circuit
APPLICATION
They are used in gas leakage detecting equipments in family and industry, are suitable for detecting of LPG, i-butane, propane, methane ,alcohol, Hydrogen, smoke.
SPECIFICATIONS
A. Standard work condition
www.DataSheet4U.
B. Environment condition
Symbol Parameter name Technical condition Remarks
Tao Using Tem -20℃-50℃
Tas Storage Tem -20℃-70℃
RH Related humidity less than 95%Rh
O2 Oxygen concentration 21%(standard condition)Oxygen concentration can affect sensitivity
minimum value is over 2%
C. Sensitivity characteristic
Symbol Parameter name Technical parameter Remarks
Rs Sensin
g Resista nce
3KΩ-30KΩ (1000ppm iso-
butane )
Detecting
concentration scope:
200ppm-5000ppm LPG and propane 300ppm-
5000ppm butane 5000ppm-
20000ppm methane 300ppm-5000ppm H2 100ppm- 2000ppm Alcohol α
(3000/1000) isobutane
Concentrat ion Slope rate
≤0.6
Standard Detecting Condition
Temp: 20℃±2℃ Vc:5V±0.1 Humidity: 65%±5% Vh: 5V±0.1
Preheat time Over 24
hour
Symbol Parameter name Technical condition Remarks
Vc Circuit voltage 5V±0.1 AC OR DC
VH Heating voltage 5V±0.1 ACOR DC
com RL Load resistance can adjust
RH Heater resistance 33Ω±5% Room Tem
PH Heating consumption less than 800mw
Structure and configuration of MQ-2 gas sensor is shown as Fig. 1 (Configuration A or B), sensor composed by micro AL2O3 ceramic tube, Tin Dioxide (SnO2) sensitive layer,
measuring electrode and heater are fixed into
Fig.2 Fig. 1
A
向
Configuration B
A 向
Configuration A
Copper plating Ni Tube Pin
Bakelite Resin base
Copper plating Ni Clamp ring
Stainless steel gauze (SUS316 100-mesh) Anti-explosion
network
Al2O3 Tubular ceramic
Ni-Cr alloy Heater coil
Pt Electrode line
Au Electrode
SnO2
Gas sensing layer
Materials Parts
TEL: 86-371- 67169070 67169080 FAX: 86-371-67169090 E-mail:
[email protected] crust made by plastic and stainless steel net. The heater provides necessary work conditions for work of sensitive components. The enveloped MQ-2 have 6 pin ,4 of them are used to fetch signals, and other 2 are used for providing heating current.
Electric parameter measurement circuit is shown as Fig.2
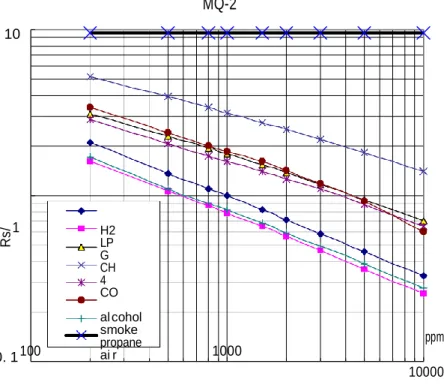
A. Sensitivity characteristic curve
MQ-2
10 Fig.3 is shows the typical
sensitivity characteristics of the MQ-2 for several gases.
in their: Temp: 20℃、
Humidity: 65%、
O2 concentration 21%
RL=5kΩ
w w w . D a t a S h e e t Ro: sensor resistance at 1000ppm of
1
0. 1 100
H2 LP G CH 4 CO al cohol smoke propane
ai r 1000
ppm 10000
H2 in the clean air.
Rs:sensor resistance at various concentrations of gases.
Rs/ Ro
Fig.4 is shows the typical
dependence of the MQ-2 on
temperature and humidity.
Ro: sensor resistance at 1000ppm of H2
in air at 33%RH and 20 degree.
Rs: sensor resistance at 1000ppm of H2
at different temperatures and humidities.
SENSITVITY ADJUSTMENT
Resistance value of MQ-2 is difference to various kinds and various concentration gases. So,When using this components, sensitivity adjustment is very necessary. we recommend that you calibrate the detector for 1000ppm liquified petroleum gas<LPG>,or 1000ppm iso-butane<i-C4H10>concentration in air and use value of
Load resistance that( RL) about 20 KΩ(5KΩ to 47 KΩ).
When accurately measuring, the proper alarm point for the gas detector should be determined after
considering the temperature and humidity influence.
1. 8 1. 6 1. 4 1. 2
0. 8 0. 6
Fig.4
-20 -10 10 20 30 40 50 60
R s / Ro
Riza Agung Firmansyah, lahir di Mojokerto, Jawa Timur pada tanggal 10 Januari 2000, anak kedua dari tiga bersaudara, dari pasangan Kukuh dan Heri . Bertempat tinggal di Dusun Dungus Kec Puri Kab Mojokerto, Jawa Timur. Dengan pendidikan formal yang pernah diikuti sebagai berikut:
1. Sekolah Dasar di SD Negeri Ketemasdungus Kabupaten Mojokerto lulus pada tahun 2012.
2. Sekolah Menengah Pertama di SMP Negeri 1 Puri Kabupaten Mojokerto lulus pada tahun 2015.
3. Sekolah Menengah Atas di SMA Negeri 1 Kutorejo lulus pada tahun 2018.
4. Mengikuti pendidikan D III Teknik Listrik Bandar Udara di Perguruan Tinggi Kedinasan Politeknik Penerbangan Surabaya dari tahun 2018 sampai dengan saat ini