© Asian Academy of Management and Penerbit Universiti Sains Malaysia, 2017. This work is
THE USE OF FINANCIAL DERIVATIVES IN MEASURING BANK RISK MANAGEMENT EFFICIENCY: A DATA
ENVELOPMENT ANALYSIS APPROACH
Shahsuzan Zakaria
Faculty of Business and Management, Universiti Teknologi MARA Kelantan Bukit Ilmu, 18500 Machang, Kelantan, Malaysia
E-mail: [email protected]
Published date: 29 December 2017
To cite this article: Zakaria, S. (2017). The use of financial derivatives in measuring bank risk management efficiency: A data envelopment analysis approach. Asian Academy of Management Journal, 22(2), 209–244. https://doi.org/10.21315/aamj2017.22.2.8
To link to this article: https://doi.org/10.21315/aamj2017.22.2.8
ABSTRACT
As risk-taking is an essential part of the banking industry, it is important for banks to practice efficient risk management to ensure survival in uncertain climates, such as the Asian Financial Crisis of 1997. Due to banking operations being specifically affected by fluctuations in interest rates, which cause financial imbalances, banks are now required to put in place an effective management structure that incorporates risk management efficiency measures that help mitigate the wide range of risks they face. Such efficient risk management measures are paramount in building robust and sound financial systems. This study provides a new approach for measuring risk management efficiency levels in banks by offering a more detailed insight into the data envelopment analysis (DEA) approach based on the usage of a financial risk instrument. Comparatively, the results of this study confirm the findings by Hahn (2008) indicating that Japanese banks are superior in terms of managerial efficiency when compared to European and US banks. Risk management efficiency measurement contributes to the strengthening of the efficiency levels of banking risk management and the achievement of sound risk management in banking operations, thus underscoring the impact of derivative usage on banking risk management efficiency.
Keywords: financial risk, financial instrument, bank efficiency, data envelopment analysis (DEA)
INTRODUCTION
Firms and businesses operate in a constantly changing and risky environment, which causes unpredictability, volatility, and complexity. Risk management strategies that are effective in terms of costs and resources are becoming increasingly important to the success of any business (Lam, 2014; Power, 2004), with the measurement and analysis of risk management efficiency being crucial for the survival of all business activities both domestically and internationally (Figueira-de-Lemos, Johanson, & Vahlne, 2011). In spite of the availability of guidelines for firms to make financial decisions, Scholtens and Van Wensveen (2000) maintain that the most important rationale for financial risk management is to protect company balance sheets against severe monetary losses. Currently, derivatives, as risk hedging tools, have become prominent, particularly in financial institutions. The creation of financial derivatives has served as a risk reduction tool for managers of financial institutions in many developed countries. Banking institutions may use derivatives as a risk management tool to hedge on-balance sheet transactions by speculating on movements in exchange rates, interest rates, and commodity prices. Therefore, these advantages encourage banks to position their businesses and improve their efficiency in risk management. Hence, efficiency in risk management should be quantified to maintain value creation and prevent the occurrence of adverse events that might not have been properly considered in the relevant business scenario. In times of uncertainty and global economic turmoil, the role of risk management as a leverage for business management and operations becomes more crucial (Schroeck, 2002; Grote, 2015). The context of risk management, with clearly defined objectives by corporate management, has become a key tool for supporting decision-making processes at strategic and tactical levels. The same concept applies to banking operations where risk arises from inaccurate business decisions. Therefore, appropriate risk management efficiency measurements in banks can substantially contribute to the implementation of activities that are aimed at reducing possible future liabilities. Pastor (1999) notes that risk management efficiency measures are important for avoiding poor risk management and increased competition in financial markets. Thus, as far as the risk management of a firm is concerned, it is essential to develop a new method for measuring risk management efficiency. This implies the necessity of having robust measurements of risk management in financial institutions.
Furthermore, a limited number of studies have been conducted, which demonstrated the impact of derivatives usage in the risk management efficiency of financial institutions using a good measurement approach. For example, Rivas, Ozuna, and Policastro (2006) found that derivative items had no clear effect on the risk management efficiency of banks. However, their discussions on the use of a data
envelopment analysis (DEA) approach failed to examine the technical aspects and roles of derivatives in controlling market risk and measuring risk management efficiency using derivatives based inputs and outputs. The shift of risk management measurement in this study emphasises to some extent the role of banks as financial intermediaries (Allen & Santomero, 1998; Cornett & Saunders, 2003).
These two points are of particular interest in commercial banks in relation to the efficiency of risk management in developed and emerging market economies (EMEs), particularly in the Asia-Pacific region (Yong, Faff, & Chalmers, 2009).
This study fills the above research gap through an empirical investigation and analysis of the risk management efficiency of banks based on the usage of derivative instruments in developed and developing financial markets in the Asia- Pacific region. The measurement and development of a model for financial risk management efficiency measures in banks were carried out using a DEA approach involving 21 commercial banks covering the period from 2007 to 2012. The 21 banks selected are from Asia-Pacific countries, of which six are developed countries (Australia, Hong Kong, Japan, New Zealand, Singapore, and Taiwan) and three are developing countries (Malaysia, the Philippines, and Thailand). The selection of banks from Asia-Pacific countries is based on the finding of Elzinga and Mills (2011), and Fu, Lin, and Molyneux (2014), who conducted an empirical study on bank competition and financial stability in 14 Asia-Pacific countries and found that banks in this region are able to obtain greater discretion in terms of derivatives’ price-setting. Good price discretion boosts the profitability of banks and reduces their insolvency risk, in addition to increasing banking concentration (product differentiation) (Homburg, Jensen, & Hahn, 2012; Phillips, Simsek, &
van Ryzin, 2015). This situation illustrates that pricing power boosts the capacity in Asia-Pacific banks that serve as “capital buffers.” This enables banks and protects them against liquidity shocks and external macroeconomic risks. This study seeks to address the following questions:
1. What is the need and significance of risk management efficiency measures and analysis?
2. How can risk management efficiency be optimised using a DEA that incorporates derivatives as a risk financial mitigation instrument?
3. Are derivatives more efficient in managing risk in developed countries compared to developing countries in the Asia-Pacific region?
THE RISK AND RISK MANAGEMENT: ISSUES IN EFFICIENCY MEASUREMENT USING FINANCIAL DERIVATIVE INSTRUMENTS Risk in banking organisations refers to uncertainties resulting in adverse impacts on profitability that can give rise to outright losses. According to Omar, Jawad, Cindy, Alfonso, and Ozgur (2014); McNeil, Frey, and Embrechts (2010); and Bessis (2002), the concept of risk in a banking environment has shifted from the traditional qualitative risk assessment to quantitative management. Due to the uncertainties of global market forces and financial movements, there is now an increased potential for an adverse effect on banks’ profitability. In the banking atmosphere, interest rate risk is often referred to as a negative impact of the economics of banking and on financial statements through assets and liabilities (Scannella & Bennardo, 2013; Hassan & Bashir, 2003), and it can be substantial (Bank for International Settlements, 2003). This justifies a focus on analysis that highlights the importance of interest rate risk, which is employed in this research.
Most scholars believe that interest rate risk has an impact on the overall earnings and can create outright losses, threatening the financial stability of institutions (Drehmann, Sorensen, & Stringa, 2008; Madura & Zarruk, 1995; Fraser, Madura,
& Weigand, 2002; Saunders & Schumacher, 2000). Therefore, risk management policies and procedures that limit and control interest rate risk are crucial in bank risk management (Greuning & Bratanovic, 1999).
Derivatives and their Relationship with Risk Management in Commercial Banks
The use of financial instruments or derivatives as risk management weapons to draw inference on the current situation warrants that firms achieve competitive advantage (Clarke & Varma, 1999; Triantis, 2000). As derivatives are extensively traded in developed markets and are experiencing larger trading volume, they serve a valuable purpose for hedging risk in the spot market (Rao, 2012) and providing a means for managing financial risk (Chance & Brooks, 2009). Chance and Brooks (2009) show that by using derivatives as protective strategies, individuals and companies can transfer not only risk from one party to another but can also protect their investment portfolios against market turmoil and downsizing losses. As interest rates have become more volatile, depository institutions have recognised the importance of derivatives, particularly interest rate futures and interest rate swaps, in reducing risk and achieving acceptable financial performance. Moreover, Adkins, Carter, and Simpson (2007) argued that higher investment allocation is channelled to derivative instruments because management has been persuaded on the effectiveness of derivatives in reducing interest rate and foreign exchange risk.
According to Smith and Stulz (1985), banks use derivative instruments for hedging
purposes. Fok, Carroll, and Chiou (1997) argued that there are three major benefits of using derivatives, namely reduced taxes under a progressive tax schedule, reduced expected cost of financial distress (Borokhovich, Brunarski, Crutchley, &
Simkins, 2004), and reduced agency cost problems. Smith and Stulz (1985) first developed financial distress arguments for derivative usage in hedging, claiming that hedging can reduce the volatility of a firm’s value by reducing the likelihood of costly financial distress, and thus increasing the expected value of the firm.
Usage of Derivative Instruments and their Relationships in Emerging Market Economies (Developing Country Markets)
In EMEs, derivatives are traded in almost equal proportion over the counter (OTC) and on exchanges. For comparison, in developed economies almost two-thirds of derivatives are traded on exchanges, with 38% being over the counter. In EME markets, derivatives are primarily used to hedge or speculate on the exchange rate, and to a lesser extent, equity market risk. Foreign exchange (FX) derivatives account for 50% of total turnover in emerging markets, equity-linked derivatives for 30%, and interest rate derivatives for the remaining percentage of the total turnover. On the other hand, derivatives in advanced economies are used mostly to trade interest rate risk (77% of total turnover), with the FX and equity-related derivatives receiving less focus. These differences are due to the relatively limited concerns about exchange rate risk in developed markets compared to that in emerging markets. However, according to Guay, Kothari, and Loktionov (2008), to achieve efficiency in derivatives markets, firms should consider continuous trading across time zones. In addition to resulting in better market efficiency, continuous trading can benefit local firms. Thus, efficiency is also important for gaining competitive advantage when trading with other countries in the same time zone.
Limitations of Existing Literature and Motivation for the Study
In the context of measurement of risk management efficiency, methodologically there is an absence in the literature of attempts to test the use of DEA to ascertain the risk management efficiency of banks in relation to their derivative instruments.
This study uses a different type of input and output compared to the traditional input and output used in measuring bank efficiency. Previous studies (e.g., Pastor, 1999; Paradi, Asmild, & Simak, 2004) only measure a bank’s efficiency without addressing different purposes and therefore find no clear evidence of risk management implications. It may have been more fruitful if these studies had been based on the actual derivative financial instruments used by banks to demonstrate their direct effect on risk management efficiency. This is because input and output determination in these studies was not based on the use of derivative
instruments (e.g., interest rate swaps) that correspond with the affected hedged items. In addition, most efficiency studies have made little attempt to analyse the risk management efficiency of banks, even though it can be measured by using a frontier analysis approach and by measuring risk management efficiency in the same way as measuring the overall performance of firms (Cummins, 1999).
As there are no studies on the relationship between the usage of derivatives and a bank’s risk management efficiency in two different financial markets, a major limitation in the literature exists. This is because most evidence is limited to individual countries with no studies examining and comparing this issue in developed and emerging countries. Although Prevost, Rose, and Miller (2000) compared derivatives usage and financial risk management in small and large economies, they did not do so in different financial markets of developing countries that experienced robust economic growth (e.g., Malaysia and the Philippines). Most literature focuses on the developed countries, especially the USA. Hence, there is a need to compare derivatives usage and its impacts on efficiency levels across developed and developing countries. Rivas et al. (2006) analysed bank efficiency, but they did not isolate the derivative types used by commercial banks. Therefore, there is a need to redefine the derivative instruments and test the relationships between derivatives usage and banks’ risk management efficiency. Additionally, there has been limited investigation into the impact of derivatives’ usage on commercial banks’ performance, with most studies focusing on their impact on non-financial companies; excluding commercial banks among the firms exposed to high external risks of interest rate and foreign exchange (Mulugetta & Hadjinikolov, 2004). In short, there is a need to confirm whether derivatives usage leads to improvements in the efficiency of banks in both the developed and developing markets. The above limitations of the existing literature on the use of derivative instruments and risk management using a DEA approach justify the present study, which combines multiple areas to allow for accurate and precise methods for measuring risk management efficiency in commercial banks influenced by both the developed and developing financial markets.
Methodology and Modelling Scheme: A DEA Modelling Approach for Financial Risk Management Efficiency Measures
Pursuant to the brief discussion above, the modelling scheme of this study adopts the DEA approach as an efficiency measure for financial risk management efficiency.
As far as the literature is concerned, since no specific application of this approach for financial risk management efficiency measures has been found, an example of its application is needed. Furthermore, in relation to financial risk management, the literature shows that the derivative instrument has received less attention
in investigating the impact of its usage in analysing banks’ risk management efficiencies. Indeed, the results of this investigation may assist in reducing the long-standing controversy about how the usage of derivative instruments impacts firm’s performance. In measuring risk management efficiency based on the derivative instrument, derivatives as hedging tools, its impacts on the hedged items can evaluate and determine whether hedging relationships should be terminated or not. The impact that hedging instruments have on risk management is not yet clear, however. This indicates the need to understand the various perceptions on the derivative instrument existing in hedge effectiveness (hedge accounting rule) and to determine the extent to which the derivative can affect risk management efficiency levels. Therefore, this study provides an exciting opportunity to advance the knowledge of financial risk management efficiency measures.
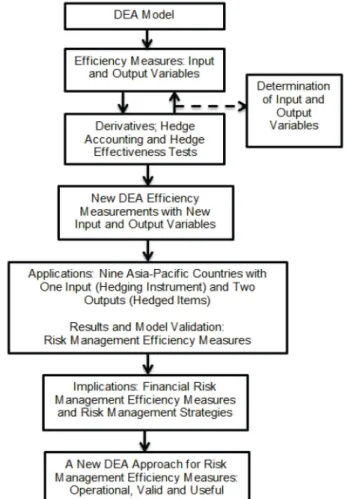
Figure 1. Modelling scheme: A new DEA modelling approach for financial risk management
DEA THEORY: A DETERMINISTIC NON-PARAMETRIC METHOD Based on the survey of literature, there are two widely used empirical approaches used in evaluating the efficiency of banks, namely, parametric (stochastic frontier approach, SFA) and non-parametric approaches (DEA). In measuring the risk management efficiency of commercial banks, this study employs the DEA approach due to its strength over the parametric SFA. The following subsections elaborate the various aspects and justifications of using DEA for risk efficiency analysis of derivatives usage in this study. A DEA is based on linear programming, making it more powerful compared to other productivity management tools (Cooper, Seiford,
& Zhu, 2011). DEA uses actual data to obtain the efficiencies in cases where every boundary of firms in the sample can be measured such that no explicit functional form must be specified in advance. The production frontier will be generated by a mathematical programming algorithm that also calculates the optimal efficiency score for each of the decision-making units (DMUs). In addition to its ability to make no assumptions about the functional form that links inputs to outputs, DEA also seeks a set of weights to maximise the technical efficiency (Athanassopoulos
& Curram, 1996).
CCR Model of DEA
This study focuses on the CCR model developed by Charnes, Cooper, and Rhodes (1978). In this model, the efficiency of a DMU is defined as the ratio of the sum of its weighted outputs to the sum of its weighted inputs. Given the CCR model, where the ratio measure of relative efficiency for DMUk is given by the following non-convex, nonlinear, fractional programming (1) and (2):
, 1,2 ... ,
Maximise: h p n
v x w y
1 p 1
i i ip m k r rp
= r =
=
/
=/
(1)1, 1,2 ... , 0,
0,
Subject to: j n
v x w y
w v
, ..., , ...,
1 1 i i i m
r r k
j r j
r r k
i i m
1 2 1 2
#
$
$
=
=
=
=
=
/ /
(2)
In this model, there are two constraints for assigning weights, no DMU can get a score more than 1 and the weights must be positive and the sum of the weights equals one. This is the weight selection limitation for the inputs and outputs. The weights wr and vi are determined by xij and yrj data. The objective function, hp
represents the relative efficiency of DMUj, and j ranges from 1 to n. The xij and yrj
(all positive) are known input and output values of the j – th DMU. The efficiency of the DMU must not exceed unity (100%.). Thus, the DMU is efficient if the score is 1 and inefficient if the score is less than 1. The objective function and constraints are composed of fractions and need to be transformed into linear form so that the model can be solved using simple linear programming, such as the simplex method.
Methodological Issues in Adapting DEA for Risk Management Measurement Having provided the conceptual definitions as well as the justifications for using DEA, this study followed Arjomandi (2011) to analyse three important methodological issues, namely: (1) input-output orientation, (2) CRS vs. VRS, and (3) input and output variables.
Input-output orientation
In DEA, two types of models in the linear programming technique can be used, namely, the output orientation and the input orientation models. The input-oriented model maximises the proportional reduction in inputs while retaining the same level of outputs; on the other hand, the output-oriented model maximises the proportional expansion in outputs for the same level of inputs. Input-oriented technical efficiency focuses on the use of minimum input resources to achieve a given level of output. The model addresses questions relating to the reduction of input quantities without changing the output quantities produced. Meanwhile, the output-oriented model focuses on using a given set of input to achieve the maximum possible output quantities that can be expanded without altering the input quantities used (Coelli, Rao, O’Donnell, & Battese, 2005; Joro & Korhonen, 2015).
CRS vs. VRS
There are two types of efficient scale of operations that can be applied in DEA, namely, constant returns to scale (CRS) or variable returns to scale (VRS). The CRS assumption is only suitable when all firms are operating at an optimal scale.
However, factors, like imperfect competition and market size, that may affect income distribution, and international trade constraints, alongside other factors in the banking system, may cause a firm to not be operating at its optimal scale.
Therefore, Banker, Charnes, and Cooper (1984) stated that to comprehend both pure technical efficiency (PTE) and scale efficiency (SE), and yield, the score that specifies the overall technical efficiency (OTE) for each firm, the VRS assumption is more appropriate. The VRS assumption is more appropriate for large samples
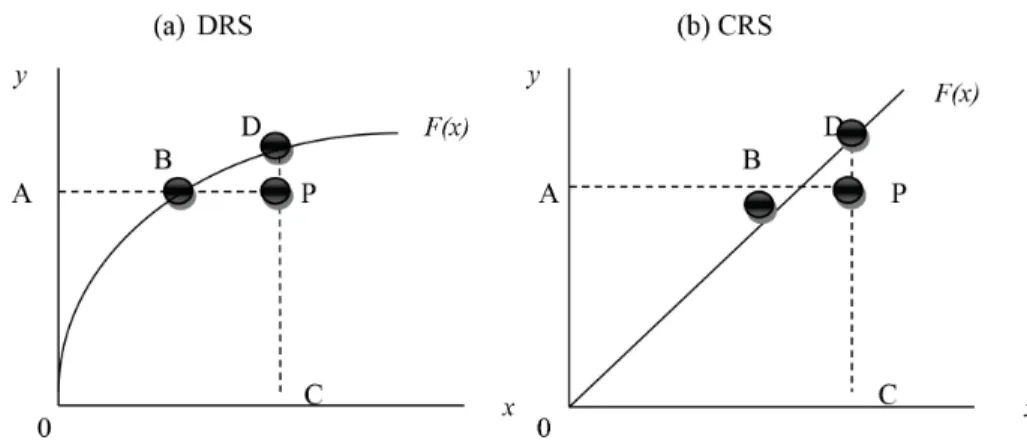
(Arjomandi, 2011), and each unit is compared only against other units of similar size, instead of against all units (Avkiran, 1999b). VRS enables PTE by improving the ability of managers to utilise a firm’s given resources, and certainly enables the exploitation of scale economies by operating at a point in which the production frontier exhibits CRS. Due to those advantages, the majority of efficiency studies using DEA are based on the assumption of VRS, which has been commonly used since the 1990s (Coelli, Rao, & Battese, 1998). Therefore, Banker (1984) suggests an extension of the CCR model to account for VRS cases. Figure 2 (a) shows a decreasing returns to scale (DRS) technology represented by F(x), and an inefficient DMU operating at point P. Farrell (1957) notes that the input orientation measure of technical efficiency will be equal to the ratio AB/AP, while the output- oriented measure of technical efficiency would be CP/CD. Figure 2 (b) illustrates the CRS case, where AB/AP = CP/CD, for any inefficient firm operating at point P.
There is no difference as input- and output-oriented measures provide equivalent measures of technical efficiency only when CRS exist. These orientations will be unequal if decreasing or increasing returns to scale are present. Again, all these two measurements are bounded by zero and one. These two orientations share a similar envelopment surface, or efficiency frontier. However, an inefficient firms measure may differ under the two CRS.
Figure 2. Input and output technical efficiency measures and returns to scale Source: Coelli et al. (2005)
Input and output variables for DEA model
To date, there is considerable disagreement on the choice of inputs and outputs for banks. For instance, there is no consensus regarding whether deposits should be treated as inputs or outputs (Jackson & Fethi, 2000; Holod & Lewis, 2011;
Bogetoft, 2012). Furthermore, Gregoriou, Sedzro, and Zhu (2005) considered
outputs as the effect of processing the inputs, and suggested that this assesses how efficiently a company has attained its goals. In relation to this, three distinct approaches are provided in the literature and are used for selecting inputs and outputs, namely, the production approach, intermediation approach, and value- added approach. The production approach views banks as producers who use the physical inputs of capital and labour to generate the outputs of loan accounts and deposits. Sufian (2010) and Neal (2004) are among the researchers who used this approach. The intermediation approach views banks as intermediaries of financial services that transfer and convert financial assets from a surplus or deficit units.
This approach assumes that banks collect deposits from customers, using labour and capital to transfer deposits into loans and other earning assets (Sealey &
Lindley, 1977; Freixas & Rochet, 1997). Within this approach, there are alternative conceptualisations when defining inputs and outputs. Fried, Knox Lovell, and Eeckaut (1993), and Kirkwood and Nahm (2006) conceptualised inputs in terms of labour, capital costs and deposits, and outputs in terms of financial investments and loans. In another type of intermediation approach, inputs are determined in terms of expenses, and outputs in terms of revenue (Charnes, Cooper, Huang, &
Sun, 1990; Miller & Noulas, 1996; Avkiran 1999b; Paul & Kourouche, 2008). The value-added approach is based on the share of value-added to identify inputs and outputs for the banking sectors. According to Minh, Van Khanh, and Tuan (2012), this approach considers deposits as outputs since they focus on value-addition.
Verification and validation of the model
To avoid any computational error and ensure the internal consistency of the model, this study follows McCarl and Spreen (1997, 2011) and uses two general approaches of validity, namely: (1) validity by construct, and (2) validity by results.
They believe that validity by construct is most applicable for both predictive and prescriptive models. To ensure verification and validity, the following processes are most applicable:
1. Following the right procedure when developing the model. The model needs to be consistent with the industry, previous research and/or theory.
The data also needs to be specific based on reasonable scientific estimation or risk management procedure.
2. Ensuring that the results indicate that the model is behaving satisfactorily.
3. Ensuring the constraints are imposed, which restrict the model to realistic solutions.
Mathematical model and statistical tests used in this study
In specifying the model, this study assumes that commercial banks are producers that have full control over most of their financial activities, including turning funds into finance or investments, and reflecting the banks’ goals of profit maximisation in an ambiguous environment dealing with risk. Due to the growing importance of new financial instruments and markets (swaps) characterised as facilitators of risk transfer (Scholtens & Van Wensveen, 2000), the control over derivative transactions for hedging purposes can determine the level of risk management efficiency. The DEA framework used in this study employs: one derivative input of interest rate swaps (x1); and two outputs including mortgages, corporate and commercial loans (y1), and customer deposits (y2). In agreement with Berger and Humphrey (1997), the determination of inputs and outputs in this study is based on an intermediation approach. However, the determination of inputs and outputs needs to be viewed in the context of their relationship with risk management.
Hence, in assessing the efficiency of derivatives and risk management, this study will examine the elements in a specific order, considering interest rate swaps as the input, and customer deposits together with mortgage, corporate and commercial loans as the outputs.
Descriptive Statistics of Input and Output Variables
To cope with the business environment test concept and following the general acceptance theories and prerequisite conditions of the DEA model, Ueda and Hoshiai (1997) strongly suggest that outputs need to positively correlate with input variables. Hence, this study assesses the relationships between input and output variables using the Pearson’s correlation test (Hair, 2009).
Table 1
Summary of descriptive statistics of input and outputs
Variables Units Minimum Maximum Mean Std. deviation
Outputs
Customer deposits Dollar 0.046 243669 0.0848 0.0332
Mortgages, corporate and
commercial loans Dollar 14.848 2922.070 530.327 716.600 Input
Interest rate swaps Dollar 0.011 5.615 1.476 1.916
Note: Figures are presented in USD for nine Asia-Pacific countries over 2007–2012. The minimum value for interest rate swaps is referring to the percentage of LIBOR swaps after the company (bank) finds it advantageous to enter into the swap.
Following the descriptive statistics, the correlation coefficient test is performed (Table 2). Here, both customer deposits and mortgages, corporate and commercial loans show a positive correlation to interest rate swaps . Therefore, both output variables are appropriate to be included in measuring the banks’ risk management in the performance evaluation model of this study.
Table 2
Correlation of coefficients between input and outputs
Input Outputs
Customer deposits Mortgages, corporate and commercial loans
Interest rate swaps 0.730** 0.588*
Note: *** p ≤ 0.001, ** p ≤ 0.01, * p ≤ 0.05
A coefficient of determination is used for a satisfactory and robust model that explains the relationships between variables. According to Taylor (1990)1, although the correlation coefficient is the best known and is preferred for statistical testing, the coefficient of determination may be a more meaningful and more conservative measure of the relationships between the two variables. However, even though this test is seldom reported in the statistical analyses of research data, the results for the coefficient of determination in this study are presented in Table 3.
Table 3
Correlation of determination between input and output variables
Input Outputs
Customer deposits Mortgages, corporate and commercial loans
Interest rate swap 0.533* 0.345*
Note: *** p ≤ 0.001, ** p ≤ 0.01, * p ≤ 0.05
RESULTS
Risk Management Efficiency Estimates
By applying the DEA approach, the risk management efficiency levels based on derivatives were estimated. Based on the input-oriented approach under the CRS assumption of 2007, the OTE scores of 21 commercial banks (CBs), along with the magnitude of overall technical inefficiency (OTIE), were estimated. The results indicate that the commercial banking sector of the Asia-Pacific region has been characterised with small asymmetries between banks regarding OTEs (in
percentage terms) that range from 83.8% to 100%, with an average OTE of 93.7%
(0.937). This implies that on average, these banks could proportionally reduce their input by 6.3% and produce the same amount (proportion) of output. Of the 21 CBs, CB7 from Japan is the only bank found to be technically efficient, since its OTE score of 1.000 achieved the unity scale efficiency score, thus operating at its most productive scale size (MPSS). CB7 defines the “best practice” or “efficient frontier” bank in managing both inputs and outputs, within the Asia-Pacific region.
At MPSS, this bank operates at the minimum point of its long-run average cost curve. This result is consistent with the findings by Gulati (2011). For 2007, the remaining 20 banks have OTEs of less than 1.000, which means that they are technically inefficient, thus indicating the presence of marked deviations of the banks from the best practice or efficient frontier levels.
The result also reveals that banks in Malaysia and Australia are the most technically efficient in the sample period of 2007–2012, with the country average efficiency scores of 92.9% and 92.8%, respectively. With average efficiency scores of 92.9%, Malaysian banks compete with other banks in both the developed and developing countries to gain the highest average OTE scores in the region, while commercial banks in Japan are rated as the worst performers with a mean value of 91.1%.
These results may seem counter-intuitive, since economists assume that banks in developed countries should achieve better results. Interestingly, the mean score of banks in Malaysia, a developing country, outperformed that of Australian banks, which are found to be the best among other banks in the developed countries.
Overall, this study found that the majority of banks in the sample scored above 90% and close to 100% (1.000). Such a pattern in the results might reflect the relatively small market size of the country and the extent of banking competition in the country (inefficient banking institutions). Overall, their average OTE in 2012 was found to be the best compared to all previous years, with 99% scores.
Overall, seven banks were operating at MPSS (CB1, CB2, CB3, CB5, CB7, CB14, and CB17). As per the 2007 data, only CB7 from Japan (the country achieving lowest mean scores of OTE) had achieved MPSS. This bank was found to be fully technically efficient at the MPSS during the sample period, achieving MPSS three times in 2007, 2008, and 2010, thus dominating as the top performer (best efficiency frontier) for the period from 2007 to 2012. Three Australian banks also reached MPSS in 2008 (CB1) and in 2012 (CB2 and CB3), which means that all three banks were operating at maximum level in those years as they switched to MPSS. In this context, the MPSS results indicate that the risk management divisions in these banks were becoming more skilful and proficient in controlling
and managing their interest rate risks. Furthermore, the results could help to determine the procedures and principles of internal supervision, including auditing and controlling activities and risk management systems that banks should establish to monitor and control the interest rate risks they are exposed to. It also helps in risk management issues by defining, verifying, and assessing interest rate risks that banks are exposed to, through quantitative measurements, thus lending support to equip the staff with better knowledge in risk management. The developing financial market environment in the Asia-Pacific region yields remarkable efficiency results, with CB14 from Malaysia operating at MPSS levels in 2009 and 2011, and CB17 in 2008. This phenomenon may have been influenced by the direct market access for derivatives launched by the government to facilitate the sophisticated trading strategies of trade and commerce algorithmic baskets (basket trading). This enabled the Bursa Malaysia (stock exchange) derivatives to obtain reciprocal recognition of change and expand the range of derivatives products. When compared to the Philippines and Thailand, Malaysian banks are more successful in their derivatives strategy2. The MPSS banks also do not share a common size, which implies that it is feasible for different banks to reach MPSS at different sizes, depending on their configurations of inputs and outputs. This has been confirmed in several related studies by Paul and Kourouche (2008), Neal (2004), and Avkiran (1999a, 2001).
Comparative Efficiency Results for Banks in the Developed and Developing Countries in the Asia-Pacific Region
Commercial banks in developing countries (Malaysia, the Philippines, and Thailand) achieved higher mean scores than banks in developed countries (Australia, Hong Kong, Japan, New Zealand, Singapore, and Taiwan). These results revealed that the mean (average) OTE scores for banks in the developed countries were higher than for banks in the developing countries in 2007, 2010, and 2012, while the means for banks in the developing countries were higher than for banks in the developed countries in 2008, 2009, and 2011. Throughout this time, the risk management efficiency of the 21 banks ranged from 0.757 to 1.000.
In 2008, two banks (CB1 and CB7) from the developed countries were operating at the best practice or efficient frontier of technical efficiency (100%), where no wastage of inputs affected the quantity level of outputs. However, these two banks were unable to increase their mean scores in 2008 due to the lower efficiency scores of other banks in the same group. However, it is important to recognise that CB1, located in Australia, and CB7, located in Japan, experienced advanced risk management strategies by using derivative instruments (Table 4).
Table 4
Comparative analysis based on OTE for commercial banks between the developed and developing countries in the Asia-Pacific region
2007 2008 2009 2010 2011 2012
Bank/Country
(developed countries) Efficiency scores for 13 banks in developed countries Australia
CB1 0.953 1.000 0.835 0.976 0.840 0.991
CB2 0.945 0.993 0.845 0.985 0.803 1.000
CB3 0.947 0.993 0.867 0.977 0.809 1.000
CB4 0.943 0.994 0.827 0.970 0.791 0.996
Hong Kong
CB5 0.943 0.993 0.825 0.969 0.808 1.000
Japan
CB6 0.949 0.960 0.827 0.970 0.799 0.994
CB7 1.000 1.000 0.843 1.000 0.836 0.974
CB8 0.838 0.890 0.813 0.954 0.757 0.994
New Zealand
CB9 0.948 0.993 0.827 0.970 0.817 0.994
CB10 0.948 0.993 0.827 0.970 0.796 0.993
CB11 0.911 0.997 0.826 0.970 0.796 0.998
Singapore
CB12 0.949 0.994 0.827 0.970 0.806 0.996
Taiwan
CB13 0.954 0.995 0.822 0.969 0.783 0.984
Mean 0.941 0.984 0.832 0.973 0.803 0.993
Bank/Country
(developing countries) Efficiency scores for 8 banks in developing countries Malaysia
CB14 0.923 0.988 1.000 0.969 1.000 0.974
CB15 0.898 0.970 0.854 0.970 0.781 0.969
CB16 0.957 0.990 0.825 0.970 0.803 0.969
CB17 0.895 1.000 0.824 0.970 0.803 0.986
Philippines
CB18 0.949 0.993 0.827 0.970 0.795 0.993
(continued on next page)
2007 2008 2009 2010 2011 2012 Bank/Country
(developing countries) Efficiency scores for 8 banks in developing countries Thailand
CB19 0.949 0.993 0.827 0.970 0.794 0.994
CB20 0.944 0.993 0.826 0.969 0.795 0.993
CB21 0.940 0.993 0.826 0.970 0.795 0.992
Mean 0.932 0.990 0.851 0.970 0.821 0.984
In 2007, on average, commercial banks in the developed countries had a higher technical efficiency of 0.941 compared to 0.932 for those in the developing countries. Again, CB7 contributed to the highest mean score for risk management efficiency ranking. These results were expected and further confirmed the findings in other cross-country studies (e.g., Eling & Luhnen, 2010; Rai, 1996). The results for 2010 and 2012 also indicate that banks in the developed countries yielded higher mean scores of 0.973 > 0.970 and 0.993 > 0.984, respectively, compared to the banks in the developing countries in 2008, 2009, and 2011, when the mean scores were 0.990, 0.851, and 0.821, respectively. Almost all banks in the developed and developing countries had lower risk management efficiency scores.
This scenario might have been affected by the falling stock market in August 2011, when a sharp drop in the overall stock market price was experienced across the USA, Middle East, Asia, and Europe. The fear of sovereign debt crises in Italy and Spain, and concerns over the slower economic growth in the USA affected the performance of financial institutions all over the world (Lane, 2012). However, the results for 2007, 2008, and 2012 do not show that banks continued to be affected by the global credit crunch beginning in August 2007. In fact, banks in Japan are indicated as being the most successful banks in managing risk during that period.
Financial analysts believe that Japan is among the major economies that continued to pursue an aggressive monetary stimulus policy, with almost all banks being well capitalised under “crisis containment,” aimed at buffering the impact of a global crisis (Nanto, 2009). Their involvement in multilateral swap agreements in 2009 sharpened their strategies for facing global financial crises. Cautious management and continuous monitoring improved their efficiency in providing the best value while managing interest rate risk. This result confirms the findings by Hahn (2008) that Japanese banks are significantly more managerially efficient when compared to European and USA banks.
In contrast to previous studies on DEA, this study first presents the strongly expressed role of derivative instruments used in a hedging effectiveness test for Table 4 (continued)
banks’ risk management efficiency measurements. The analysis is based on annual data using 2007 as the base year for estimated efficiency scores in individual banks (Table 5). For the period of 2007, the nature of RTS indicates that all banks, except CB7, were operating in a region of DRS, implying that they were operating on scales that were too large. These results indicate that almost all Asia-Pacific banks in this study are too large to take full advantage of scale. Likewise, Kumar and Gulati (2008) stated that banks included in the DRS region had supra-optimum scale size, necessitating a reduction of inputs to increase efficiency levels. OTE scores among these inefficient banks range from 0.838 for CB8 (Japan) to 0.957 for CB16 (Malaysia). These findings imply that CB8 and CB16 can potentially reduce their input levels of derivatives (for hedging size reductions) by 16.2%
and 4.3%, respectively, while retaining an unchanged impact on output levels.
This study observed that OTIE levels ranged from 4.3% to 16.2% among all the inefficient commercial banks.
Table 5
Efficiency summary (OTE, PTE, SE) in 2007 and RTS for 21 commercial banks in Asia- Pacific countries
CBs OTE score OTIE (%) PTE score PTIE (%) SE
score SIE (%) Nature of RTS Australia
CB1 0.953 4.7 1.000 0.0 0.953 0.47 DRS
CB2 0.945 5.5 0.995 5.0 0.950 5.0 DRS
CB3 0.947 5.3 0.997 3.0 0.950 5.0 DRS
CB4 0.943 5.7 0.986 1.4 0.956 4.4 DRS
Hong Kong
CB5 0.943 5.7 0.988 1.2 0.955 4.5 DRS
Japan
CB6 0.949 5.1 0.992 0.8 0.957 4.3 DRS
CB7 1.000 0.0 1.000 0.0 1.000 0.0 CRS
(MPSS)
CB8 0.838 16.2 1.000 0.0 0.838 16.2 DRS
New Zealand
CB9 0.948 5.2 0.995 5.0 0.953 4.7 DRS
CB10 0.948 5.2 0.994 0.6 0.955 4.5 DRS
CB11 0.911 8.9 0.952 4.8 0.957 4.3 DRS
(continued on next page)
CBs OTE score OTIE (%) PTE score PTIE (%) SE
score SIE (%) Nature of RTS Singapore
CB12 0.949 5.1 0.996 0.4 0.953 4.7 DRS
Taiwan
CB13 0.954 4.6 0.997 0.3 0.957 4.3 DRS
Malaysia
CB14 0.923 7.7 0.967 3.3 0.955 4.5 DRS
CB15 0.898 10.2 0.946 5.4 0.949 5.1 DRS
CB16 0.957 4.3 1.000 0.0 0.957 4.3 DRS
CB17 0.895 10.5 0.936 06.4 0.957 4.3 DRS
Philippines
CB18 0.949 5.1 0.992 0.8 0.957 4.3 DRS
Thailand
CB19 0.949 5.1 0.992 0.8 0.957 4.3 DRS
CB20 0.944 5.6 0.987 1.3 0.957 4.3 DRS
CB21 0.940 6.0 0.982 1.8 0.957 4.3 DRS
Mean 0.937 0.985 0.951
Notes: CB denotes commercial bank; OTE denotes overall technical efficiency; OTE = pure technical efficiency (PTE) × scale efficiency (SE); OTIE% = Overall technical inefficiency = (1-OTE) × 100; PTIE% = Pure technical inefficiency = (1-PTE) × 100; SIE% = Scale inefficiency = (1-SE) × 100; CRS denotes constant returns to scale;
DRS denotes decreasing returns to scale; MPSS denotes most productive scale size
DEA Based Test Results
The results show that the development level and status of a country3 affects the risk management efficiency of the banks. From the DEA evaluation, it appears that banks in the developed countries are more capable in terms of financial structuring and play more effective roles when using derivatives, particularly in the banking sector. However, due to the growth of derivatives in developing countries (Mihaljek
& Packer, 2010; Njoroge, Matumo, & Maina, 2013) and the inconclusive evidence of relationships between the derivative market and economic growth in these countries (Baluch & Ariff, 2007; Haiss & Sammer, 2010), further tests need to be conducted. For this reason, the hypotheses H1, H2, and H3 are used to further strengthen and confirm previous evidence from the DEA results. Thus, a DEA based test analysis is performed to provide evidence to support the third question of this study.
Table 5 (continued)
Following Havrylchyk (2006) and Isik and Hassan (2002), the DEA based analysis in this study performs parametric (t-test) and non-parametric (Wilcoxon Rank-Sum, Kruskal-Wallis, and Kolmogorov-Smirnov) tests to confirm the null hypothesis that all banks come from the same population. The first main test aims at comparing the efficiency scores across 21 commercial banks in the Asia-Pacific region, with an emphasis on efficiency comparison between the developed and developing countries in the same region. A probability of the p-value difference explains that a value lower than 0.05 (p ≤ 0.05) indicates strong evidence for differences in group scores. The cut-off point of 0.05 is used as the level of significance that is an acceptable percentage for determining whether the tests are statistically significant between both groups, with the first test of differences shown in Table 4 as: (1) a parametric t-test, and (2) the non-parametric Mann-Whitney (Wilcoxon) and Kruskal-Wallis tests. Table 6 presents the Kolmogorov-Smirnov test in which each hypothesis is tested using panel regression to evaluate the following hypotheses:
Ha1: The OTE of banks in developing countries is higher than that in developed countries.
Ha2: The PTE of banks in developing countries is higher than that in developed countries.
Ha3: The SE of banks in developing countries is higher than that in developed countries.
Mann-Whitney U-test results
The Mann-Whitney test is used to evaluate the hypotheses in which the results indicate that based on OTE (64.56 > 61.78) and PTE (68.16 > 55.93), banks’
ownership in the developed countries scores higher than banks in developing countries but have lower mean ranks for SE (57.68 < 72.96) (see Table 6). It appears that PTE does not significantly differ in both groups. Here, there is sufficient evidence to reject the null hypothesis, which implies that banks in the developed countries do not efficiently utilise their resources in an exogenous environment.
However, OTE does not show significant results nor provide evidence to support the claim that the ownership or country’s location influences the levels of risk management efficiency of the banks. These efficiency levels are determined based on the performance of the banks. This can be seen by the SE mean rank for banks in the developing countries, which was found to be statistically significant and higher than for banks in the developed countries (p = 0.014). This result enhances the level of understanding for guiding banks in both the developed and developing countries. Banks in both country types need to concentrate on their scale size
to boost their levels of performance, particularly when incorporating derivative instruments in their risk management strategy.
Parametric t-test
The parametric t-test and non-parametric Mann-Whitney (Wilcoxon) tests were performed (see Table 6). Under the parametric test, banks in the developed countries have higher mean scores for OTE and PTE. Even though the mean scores for banks in the developing countries are higher than that for banks in the developed countries in OTE, the difference is not significant. The same result was found for PTE, with higher mean scores for banks in the developing countries, but the differences are not significant. However, the result also shows that the mean value for banks in the developed countries in terms of SE is 0.973, which is lower than for banks in the developing countries with a mean value of 0.987, at a 1%
level of significance. This result indicates that banks in the developing countries have significantly higher scales of efficiency, which implies that regardless of size, all the eight banks in the developing countries are operating at their optimal levels (most productive scale size). In relation to the risk management efficiency context, the sizes and risk management strategies of the banks are currently sufficient to face the market risks.
Kruskal-Wallis test results
The Kruskal-Wallis test yields the same results as the Mann-Whitney test, with statistically significant differences between the bank groups in the developed and developing countries. The results indicate that PTE is not statistically significant, which implies that the analysis provides sufficient evidence to reject the null hypothesis and claim that the PTE performances of banks in the developing countries are lower than those of the banks in the developed countries. In contrast, banks in the developing countries have an SE average rank of 72.96 compared to 57.68 for banks in the developed countries, where the p-value of SE is less than the cut-off point (0.05). Since the results provide insufficient evidence, at = 0.05, thus Ha3 is accepted. The SE result posits that the distributions differ according to the geographical location of the banks, which indicates that the banks in the developing countries performed better than those in the developed countries (see Table 6).
Table 6
Summary of parametric and non-parametric tests on banks in the developed and developing countries in the Asia-Pacific region
Parametric
test Non-parametric test
Individual test t-test Mann-
Whitney Kruskal-Wallis
Hypothesis Median Equality of populations
test
Test statistics t (Prb > t) z (Prb > z) X2 (Prb > X2)
Mean T Mean rank z Mean
rank X²
OTE Developed
countries 0.921 0.221 64.56 –0.415 64.56 0.172
Developing
countries 0.924 61.78 61.78
PTE Developed
countries 0.948 –0.749 68.16 –1.834* 68.16 3.365*
Developing
countries 0.937 55.93 55.93
SE Developed
countries 0.973 2.317** 57.68 –2.451** 57.68 6.006**
Developing
countries 0.987 72.96 72.96
Notes:
1. Developed countries include 13 banks from 6 Asia-Pacific countries. Developing countries include 8 banks from 3 Asia-Pacific countries.
2. t = 2.317 shows a significant difference because the value in the ‘Sig. (2-tailed)’ row is .022, which is less than 0.05.
3. (***), (**), and (*) indicate significance at the 1%, 5%, and 10% levels, respectively.
The PTE and SE tests of difference between the banks in the developed and developing countries were found to not be consistent and not of the same order for the three types of differences. However, it was found that banks in the developing countries group are more efficient and outperformed their counterparts in the developed countries in scale efficiency scores with a statistical significance of a p-value at less than 0.05. These results do not support the stated assumption (no significant difference) that banks located in developed countries are more efficient
than banks in developing countries. Turning again to country type, this study assumed that banks in the developing countries were said to be more scale efficient when it was proven that their risk management operations size is optimal. The enhancement of regulatory power in their internal control and risk management, indicates that their banks have good coordination and control regarding financial risks (e.g., Greuning & Bratanovic, 1999). Indirectly, the results reveal that the optimal scale efficiency obtained by banks located in the developing countries can provide both the resilience to withstand adverse events and the ability to take advantage of development opportunities. For example, for banks in Thailand, the establishment of their financial risk management was found to be influenced by the risk management’s seven critical success factors, based on the Standards Australia and Standards New Zealand (2004). These success factors were found to provide sound financial risk management strategies. The study by Na Ranong and Phuenngam (2009) confirmed that these critical success factors can be used to support the theory for effective risk management procedures in financial industries from the perspective of financial institutions in Thailand. This shows how critical success factors influence the risk management environment, as risk management theory has suggested. Based on this argument, the evidence shown in Table 4 supports both the stakeholder and finance theories, which renewed attention to the issue of maximising benefits for stakeholders as well as supporting the model of financial risks. Moreover, Bank Negara Malaysia (the central bank of Malaysia) has encouraged financial institutions in Malaysia to establish a well-resourced independent risk management strategy and take pro-active measures to fully embrace all aspects of financial risks. These initiatives have created a robust risk management framework for Malaysian banks (e.g., Aziz, 2016). By showing the correlation between the results and theoretical issues, it helps all investigated banks to refine their risk management framework and guides them on the amount of hedging activity to undertake. This will help risk management managers to consider advanced risk management strategies and drive their efficiency improvements.
Kolmogorov-Smirnov (K-S) test
As an alternative to the Mann-Whitney and Kruskal-Wallis tests, a Kolmogorov- Smirnov (K-S) test is used to compare whether the two samples are sensitive to differences in geographical locations.
Contrary to expectations, Table 7 reveals that the OTE and SE scores are significant, and the null hypothesis (Ha3) is therefore rejected. This result indicates that there is no difference between banks in the developed and developing countries when measuring risk management efficiency performance. The findings indicate that neither banks in the developing nor developed countries provide any significant
impact in measuring technical efficiency and scale efficiency. Overall, the study accepted the proposition that the SE levels of banks in the developing countries are higher than those in developed countries. However, the findings show that there is no significant difference between the developing and developed countries in terms of OTE and PTE. However, both OTE and PTE scores are inconclusive. These results are in contrast with previous findings (e.g., Havrylchyk, 2006; Bonin, Hasan, &
Wachtel, 2005; Sufian, 2007) that compare efficiencies between domestic banks in developing countries and foreign banks from developed countries. As these studies found that foreign banks are more scale efficient than domestic banks in all tests, the findings of the present study must be inconclusive. Furthermore, in measuring the relationships between bank size and efficiency levels, both theoretical and empirical studies found them to be ambiguous (Beck, 2008; Beck, Demirgüç- Kunt, & Levine, 2006). Thus, in accordance with Zhang (2009), a combination of parametric and non-parametric tests can provide robust efficiency differences in banks in both country types by adequately providing normality to the valuation biases of arguments.
Table 7
Kolmogorov-Smirnov (K-S) test
Kolmogorov-Smirnov OTE PTE SE
Exact Sig.
D (prob > D) 0.734
0.654** 1.529
0.019 1.214
0.105**
Note: (***), (**), and (*) denote significance at the 1%, 5%, and 10% levels, respectively.
Exact sig. = exact p-value
DISCUSSION AND IMPLICATIONS
The implications of this study are important for areas that include: (1) theoretical and methodological approaches in risk management efficiency measures, (2) risk assessment embedded in supporting the risk management frameworks of banks, (3) derivative measures, (4) portfolio management and monitoring predictions, and (5) regulatory policy reforms in cross-country operations. The following subsections elaborate on the expected advantages from adapting a DEA model to further justifying its use for measuring the risk management efficiency of derivatives in this study.
Theoretical and Methodological Approaches in Risk Management Efficiency Measures
Based on the literature, more than two decades of research and work with risk measurement in banks have shown that there are a number of common risk factors when one investigates banking efficiency. However, the majority of efficiency studies have ignored the role played by using a risk management tool for measuring the efficiency of risk management. Even though companies have used many different strategies in risk management, including insurance, derivatives, and diversifications, the problem of whether the implementation of these strategies has been measured efficiently or not, has been neglected. Previous researchers have focused on accounting ratio elements, without any concern for its risk management indication, while ignoring the derivative instrument indications. This can lead to confusion and misinterpretation of true performance level measurements.
Therefore, this methodological implication indicates a need to systematically incorporate a measurement approach in the context of risk management.
An important methodological implication of this study lies in the fact that it systematically incorporates the financial derivatives and DEA measurement approaches in the context of risk management. This study expands the multi- disciplinary boundaries within both financial instruments and operational research for DEA by proposing financial derivatives usage as a means of risk management.
By introducing the DEA approach in the risk management efficiency context, the risk management analysis can be improved by using mathematical programming to organise the ratios into aggregate measures of efficiency. This can lead to a better measurement approach to avoid incorrect judgements and misclassifications.
Although the DEA method used in this study is not new, this approach is synthesised in novel ways that have not been previously attempted. In particular, the analysis began by identifying risk management efficiency measurements using the DEA model based on derivatives.
Risk Assessment Embedded in Supporting the Banking Risk Management Framework
In contrast to the perception that derivatives usage increases risk exposure in banks, the impact from volatility of interest rates is examined on hedged items to support the risk management framework of banks. This assessment provides a mechanism to show how the derivative instrument can be considered as an important factor in operational and strategic planning for risk management. As most finance studies have noted, these derivative instruments cannot be separated (Cebenoyan
& Strahan, 2004; McNeil, Frey, & Embrechts, 2005). Analysis of the efficiency